catalogue
EFK architecture (elasticsearch\filebeat\kibana)
1. Download elasticsearch, kibana, filebeat
3.1 install and start using elasticsearch account
>3.1.2} configure elasticsearch
3.2 # install and start kibana
3.3. Install and start filebeat
>3.3.1 decompress & configure filebeat
3.4 spring boot logback configuration
EFK architecture (elasticsearch\filebeat\kibana)
1. filebeat collection log (multiple log types can be collected). For specific collection configuration, refer to: https://www.elastic.co/guide/en/beats/filebeat/current/configuration-filebeat-options.html)
2. filebeat pushes the collected log parsing to es
3. kibana show
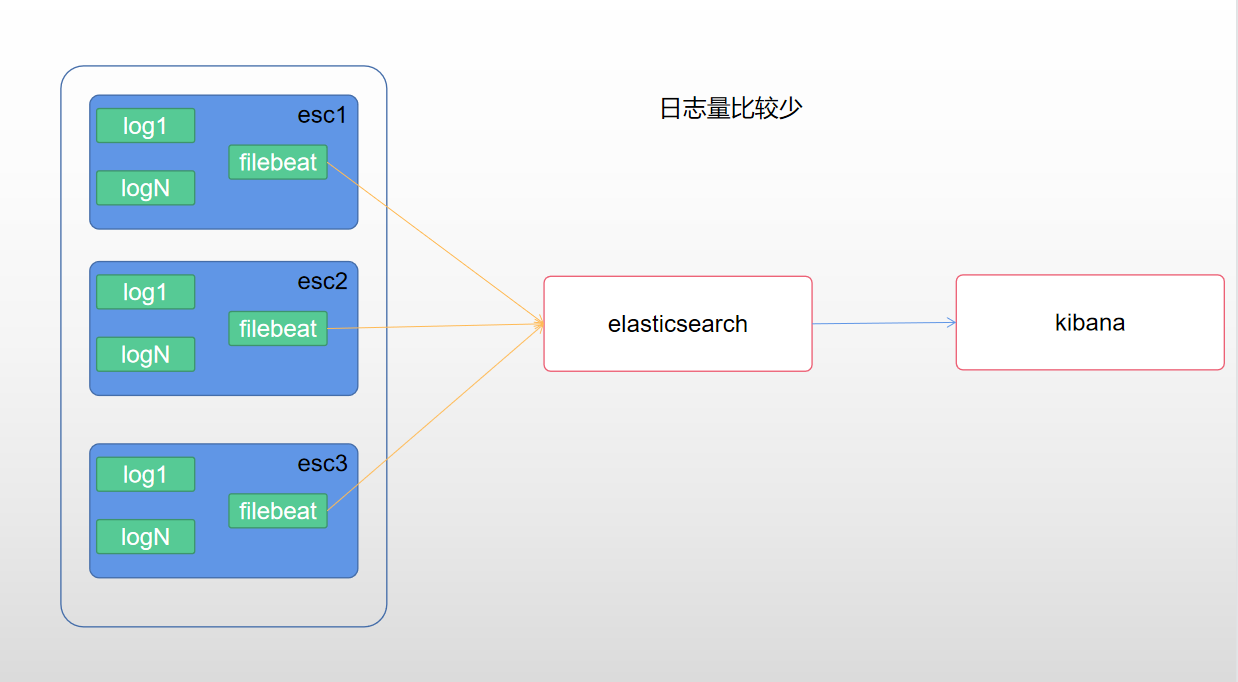
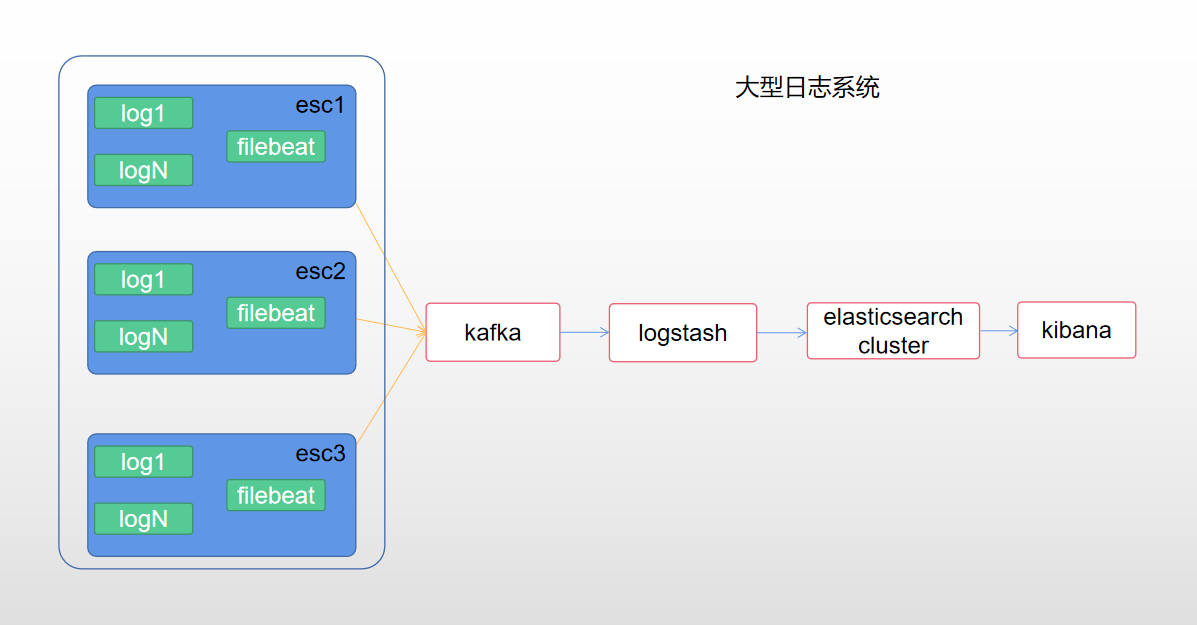
If the log volume is very large, you can refer to this scheme
1. filebeat collects logs to kafka and uses kafka's high concurrent processing capability. kafka can also be a cluster
2. logstash consumes kafka data and stores it in the es cluster. logstash can also be a cluster
Of course, you can choose other solutions. The complexity of large-scale log system is high. Choose your own appropriate log solution
The version of this deployment is 7.12.0. Ensure that the version is consistent during deployment.
1. Download elasticsearch, kibana, filebeat
[root@ecs7 efk]# curl -L -O https://artifacts.elastic.co/downloads/elasticsearch/elasticsearch-7.12.0-linux-x86_64.tar.gz
[root@ecs7 efk]# curl -L -O https://artifacts.elastic.co/downloads/kibana/kibana-7.12.0-linux-x86_64.tar.gz
[root@ecs7 efk]# curl -L -O https://artifacts.elastic.co/downloads/beats/filebeat/filebeat-7.12.0-linux-x86_64.tar.gz
2. Create and authorize users
[root@ecs7 efk]# groupadd elastic
[root@ecs7 efk]# useradd -g elastic elasticsearch
[root@ecs7 efk]# chown -R elasticsearch:elastic /data/efk/
3. Install and start
3.1 install and start using elasticsearch account
>3.1.1 unzip elasticsearch
[root@ecs7 efk]# su elasticsearch
[elasticsearch@ecs7 efk]$ tar -zxvf elasticsearch-7.12.0-linux-x86_64.tar.gz
>3.1.2} configure elasticsearch
[elasticsearch@ecs7 efk]$ cd elasticsearch-7.12.0/config/
Back up the original configuration file
[elasticsearch@ecs7 config]$ cp elasticsearch.yml elasticsearch.yml.org
elasticsearch.yml full text (this deployment is a single node deployment)
# Cluster name
cluster.name: test-efk
# Node name
node.name: master
# Index data store directory
path.data: /data/efk/elasticsearch-7.12.0/data
# journal
path.logs: /data/efk/elasticsearch-7.12.0/dlogs
# Internet access
network.host: 0.0.0.0

# port
http.port: 9200
# Automatic index creation
action.auto_create_index: .security,.monitoring*,.watches,.triggered_watches,.watcher-history*,app-a-*,app-b-*

# Node network
discovery.seed_hosts: ["191.168.0.107"]
# Current node type
cluster.initial_master_nodes: ["master"]
>3.1.3} start elasticsearch
[elasticsearch@ecs7 efk]$ cd elasticsearch-7.12.0/bin/
[elasticsearch@ecs7 bin]$ ./elasticsearch -d
[elasticsearch@ecs7 bin]$ ERROR: [1] bootstrap checks failed. You must address the points described in the following [1] lines before starting Elasticsearch.
bootstrap check failure [1] of [1]: max virtual memory areas vm.max_map_count [65530] is too low, increase to at least [262144]
ERROR: Elasticsearch did not exit normally - check the logs at /data/efk/elasticsearch-7.12.0/dlogs/test-efk.log
There will be exceptions when starting es. For solutions, refer to the blog: https://blog.csdn.net/F1004145107/article/details/106279907/
>3.1.4 access
http://localhost:9200
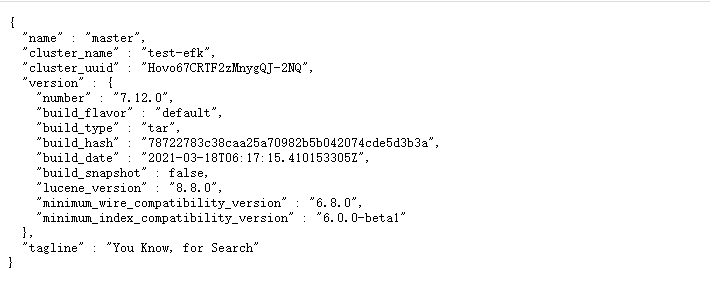
[elasticsearch@ecs7 bin]$ curl http://localhost:9200
{
  "name" : "master",
  "cluster_name" : "test-efk",
  "cluster_uuid" : "Hovo67CRTF2zMnygQJ-2NQ",
  "version" : {
    "number" : "7.12.0",
    "build_flavor" : "default",
    "build_type" : "tar",
    "build_hash" : "78722783c38caa25a70982b5b042074cde5d3b3a",
    "build_date" : "2021-03-18T06:17:15.410153305Z",
    "build_snapshot" : false,
    "lucene_version" : "8.8.0",
    "minimum_wire_compatibility_version" : "6.8.0",
    "minimum_index_compatibility_version" : "6.0.0-beta1"
  },
  "tagline" : "You Know, for Search"
}
3.2 # install and start kibana
>3.2.1 unzip kibana
[root@ecs7 efk]# su elasticsearch
[elasticsearch@ecs7 efk]$ tar -zxvf kibana-7.12.0-linux-x86_64.tar.gz
>3.2.2} configure kibana
[elasticsearch@ecs7 efk]$ cd kibana-7.12.0-linux-x86_64
[elasticsearch@ecs7 kibana-7.12.0-linux-x86_64]$ cd config/
[elasticsearch@ecs7 config]$ cp kibana.yml kibana.yml.org
Back up the original configuration file
[elasticsearch@ecs7 config]$ cp kibana.yml kibana.yml.org
kibana.yml full text
# port
server.port: 5601
# host
server.host: "0.0.0.0"
# name
server.name: "master"
# es cluster address
elasticsearch.hosts: ["http://127.0.0.1:9200"]
# Log directory
logging.dest: /data/efk/kibana-7.12.0-linux-x86_64/logs/kibana.log
>3.2.3} start kibana
[elasticsearch@ecs7 kibana-7.12.0-linux-x86_64]$ ll
total 1476
drwxr-xr-x   2 elasticsearch elastic    4096 Mar 18 13:56 bin
drwxr-xr-x   2 elasticsearch elastic    4096 Apr 13 09:53 config
drwxr-xr-x   2 elasticsearch elastic    4096 Apr  7 11:26 data
-rw-r--r--   1 elasticsearch elastic    3860 Mar 18 13:55 LICENSE.txt
drwxr-xr-x   2 elasticsearch elastic    4096 Apr  7 11:26 logs
drwxr-xr-x   6 elasticsearch elastic    4096 Mar 18 13:55 node
drwxr-xr-x 831 elasticsearch elastic   36864 Mar 18 13:55 node_modules
-rw-r--r--   1 elasticsearch elastic 1428396 Mar 18 13:55 NOTICE.txt
-rw-r--r--   1 elasticsearch elastic     740 Mar 18 13:55 package.json
drwxr-xr-x   2 elasticsearch elastic    4096 Mar 18 13:55 plugins
-rw-r--r--   1 elasticsearch elastic    3968 Mar 18 13:55 README.txt
drwxr-xr-x  12 elasticsearch elastic    4096 Mar 18 13:55 src
drwxr-xr-x   3 elasticsearch elastic    4096 Mar 18 13:55 x-pack
[elasticsearch@ecs7 kibana-7.12.0-linux-x86_64]$ cd bin
[elasticsearch@ecs7 bin]$ ll
total 16
-rwxr-xr-x 1 elasticsearch elastic 850 Mar 18 13:55 kibana
-rwxr-xr-x 1 elasticsearch elastic 783 Mar 18 13:55 kibana-encryption-keys
-rwxr-xr-x 1 elasticsearch elastic 776 Mar 18 13:55 kibana-keystore
-rwxr-xr-x 1 elasticsearch elastic 813 Mar 18 13:55 kibana-plugin
[elasticsearch@ecs7 bin]$ ./kibana &
>3.2.4} access
Browser access http://localhost:5601
3.3. Install and start filebeat
It can be pushed to the same server as other demo servers. It can be pushed to the same server as other demo servers
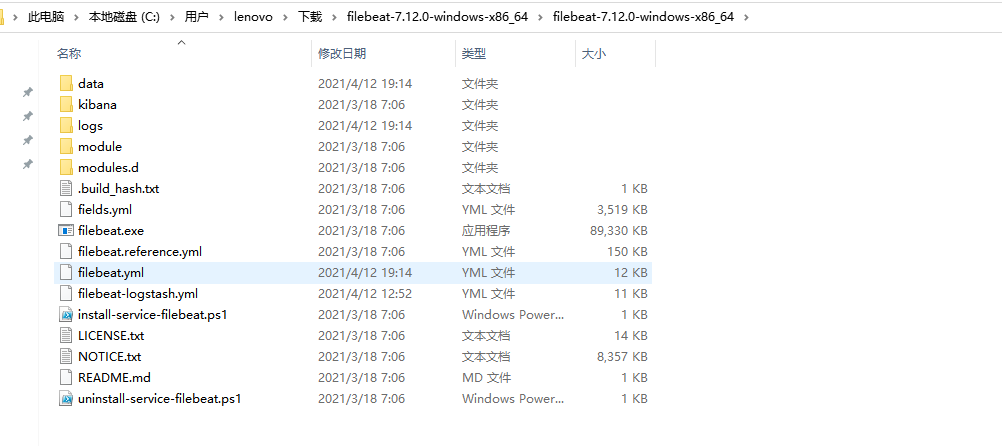
>3.3.1 decompress & configure filebeat
Back up the original configuration file
filebeat.yml full text
# ============================== Filebeat inputs ===============================
filebeat.inputs:
- type: log
  enabled: true
  encoding: UTF-8
  # Paths that should be crawled and fetched. Glob based paths.
  paths:
  #Log files to be collected
    - D:/data/**/*.log
  json.key_under_root: true
  json.overwrite_keys: true
  json.message_key: message
  json.add_error_key: true
  tags: ["saas"]

# ============================== Filebeat modules ==============================
filebeat.config.modules:
  # Glob pattern for configuration loading
  path: ${path.config}/modules.d/*.yml
  # Set to true to enable config reloading
  reload.enabled: false
  # Period on which files under path should be checked for changes
  #reload.period: 10s
# ======================= Elasticsearch template setting =======================
setup.template.settings:
  index.number_of_shards: 1
  #index.codec: best_compression
  #_source.enabled: false

setup.kibana:
# ---------------------------- Elasticsearch Output ----------------------------
output.elasticsearch:
  # Array of hosts to connect to.
# es address
  hosts: ["191.168.0.107: 9200"]

processors:
  - add_host_metadata:
      when.not.contains.tags: forwarded
  - add_cloud_metadata: ~
  - add_docker_metadata: ~
  - add_kubernetes_metadata: ~
# Log time processing
  - timestamp:
      field: json.@timestamp
      timezone: Asia/Shanghai
      layouts:
        - '2006-01-02T15:04:05+08:00'
        - '2006-01-02T15:04:05.999+08:00'
      test:
        - '2019-06-22T16:33:51+08:00'
        - '2019-11-18T04:59:51.123+08:00'
# Delete related fields
  - drop_fields:
      fields: [json.@version,json.level_value,json.@timestamp]
# Rename field
  - rename:
      fields:
        - from: "json.logName"
          to: "json.appName"
      ignore_missing: false
      fail_on_error: true
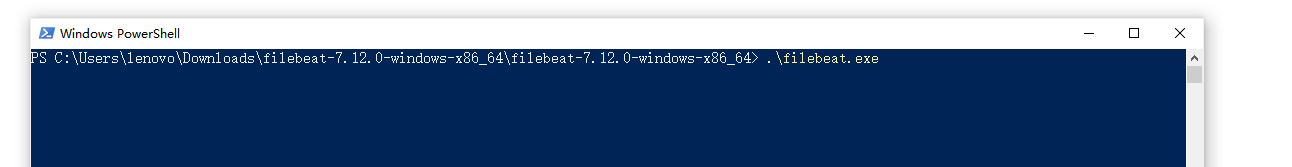
>3.3.3 start filebeat
Run filebeat.com using cmd exe
3.4 spring boot logback configuration
pom.xml adds the dependency of logstash logback encoder. Logstash logback encoder can output logs in json mode, and we don't need to deal with multi line recording separately
<dependency>
    <groupId>net.logstash.logback</groupId>
    <artifactId>logstash-logback-encoder</artifactId>
    <version>5.3</version>
</dependency>
<?xml version="1.0" encoding="UTF-8"?>
<configuration scan="true" scanPeriod="30 seconds">
    <!--  Some parameters need to come from the properties file -- >
    <springProperty scope="context" name="logName" source="spring.application.name" defaultValue="localhost.log"/>

    <!-- % M output information,% p log level,% t thread name,% d date,% c full name of class,,, --- >
    <appender name="STDOUT" class="ch.qos.logback.core.ConsoleAppender">
        <encoder>
            <pattern>%d{yyyy-MM-dd HH:mm:ss.SSS} [%thread] %-5level %logger - %msg%n</pattern>
            <charset>UTF-8</charset>
        </encoder>
    </appender>

    <appender name="FILE" class="ch.qos.logback.core.rolling.RollingFileAppender">
        <file>logs/${logName}/${logName}. log</file>    <!--  How to use -- >
        <append>true</append>
        <rollingPolicy class="ch.qos.logback.core.rolling.SizeAndTimeBasedRollingPolicy">
            <fileNamePattern>logs/${logName}/${logName}-%d{yyyy-MM-dd}.log.%i</fileNamePattern>
            <maxFileSize>64MB</maxFileSize>
            <maxHistory>30</maxHistory>
            <totalSizeCap>1GB</totalSizeCap>
        </rollingPolicy>
        <encoder class="net.logstash.logback.encoder.LogstashEncoder" >
            <providers>
                <timestamp>
                    <timeZone>Asia/Shanghai</timeZone>
                </timestamp>
                <pattern>
                    <pattern>{"level": "%level","class": "%logger{40}","message": "%message","stack_trace": "%exception"}</pattern>
                </pattern>
            </providers>
        </encoder>
    </appender>

    <!--  Print only error level content -- >
    <logger name="com.netflix" level="ERROR" />
    <logger name="net.sf.json" level="ERROR" />
    <logger name="org.springframework" level="ERROR" />
    <logger name="springfox" level="ERROR" />

    <!--  SQL Print Configuration -- >
    <logger name="com.github.pagehelper.mapper" level="DEBUG" />
    <logger name="org.apache.ibatis" level="DEBUG" />

    <root level="info">
        <appender-ref ref="STDOUT" />
        <appender-ref ref="FILE" />
    </root>
</configuration>
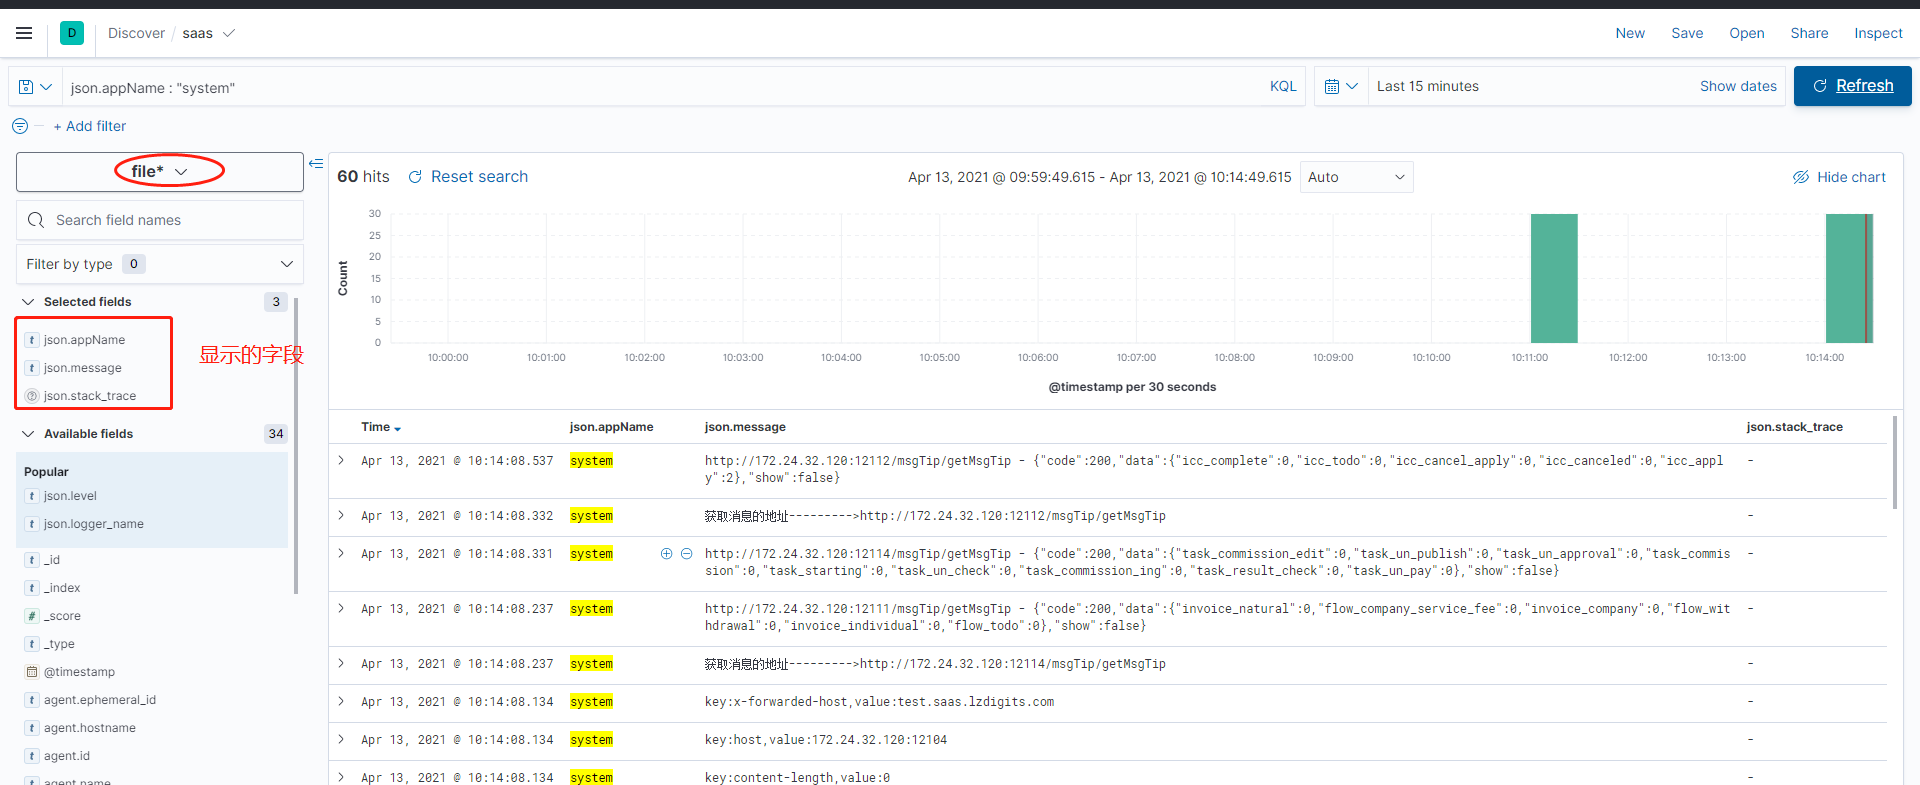
Start the springboot service, and the generated logs will be automatically collected by filebeat and pushed to es.
Final effect
Reference to relevant articles
https://blog.csdn.net/ctypyb2002/article/details/106095377
filebeat: https://www.elastic.co/guide/en/beats/filebeat/current/filebeat-input-log.html