1, Configure ELK log analysis system
1. Topology
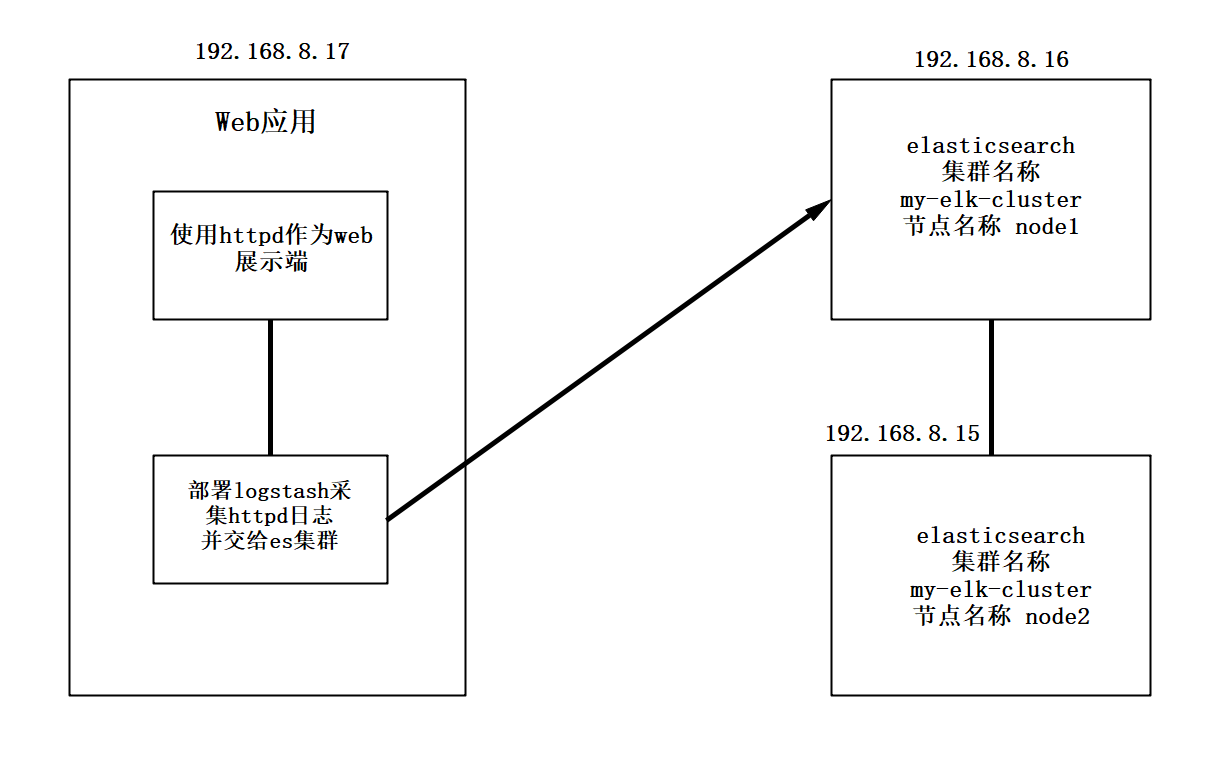
- Configure and install ELK log analysis system, install cluster mode, two elasticsearch nodes, and monitor tomcat server logs
| host | operating system | IP address | Main software |
|---|---|---|---|
| Node1 | Centos7.4 | 192. 168.8.15 | Elasticsearch,Kibana |
| Node2 | Centos7.4 | 192.168.8.16 | Elasticsearch |
| apache | Centos7.4 | 192.168.8.17 | Logstash |
2. Environment configuration
- Turn off the firewall, change the host name, view the host mapping, and configure the Java environment
systemctl stop firewalld
systemctl disable firewalld
setenforce 0
hostnamectl set-hostname node1
hostnamectl set-hostname node2
hostnamectl set-hostname apache
#node1 and node2 nodes operate the same
vim /etc/hosts
192.168.8.15 node1
192.168.8.16 node2
upload jdk Compressed package to opt Directory
tar xzvf jdk-8u91-linux-x64.tar.gz -C /usr/local/
cd /usr/local/
mv jdk1.8.0_91 jdk
vim /etc/profile
#Add the following at the end of the line
export JAVA_HOME=/usr/local/jdk
export JRE_HOME=${JAVA_HOME}/jre
export CLASSPATH=.:${JAVA_HOME}/lib:${JRE_HOME}/lib
export PATH=${JAVA_HOME}/bin:$PATH
source /etc/profile
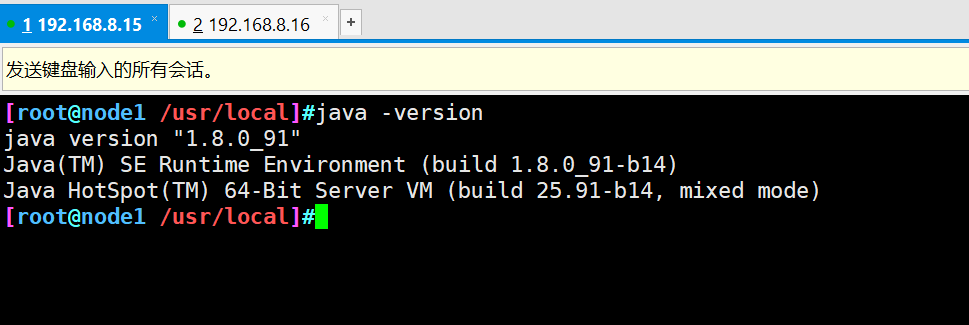
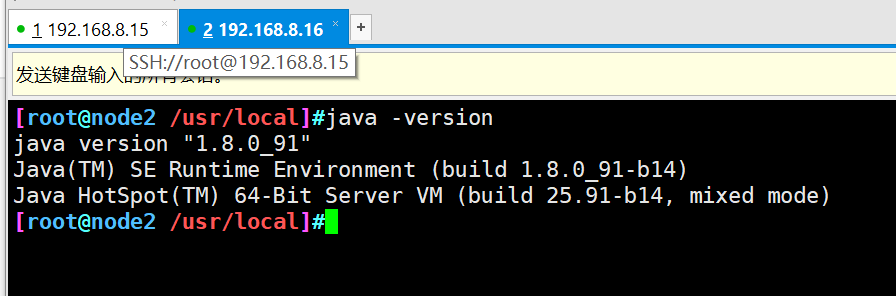
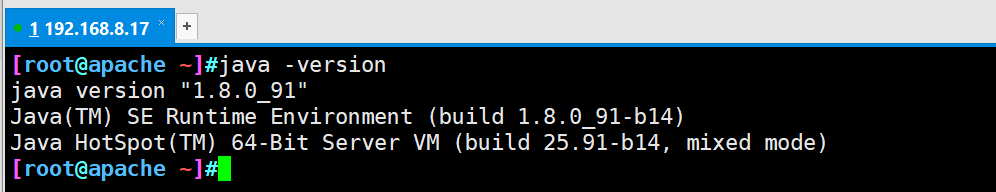
java -version
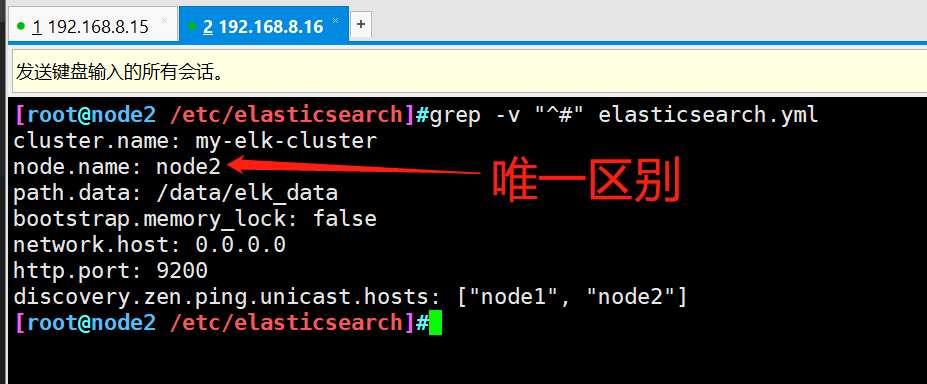
3. Install Elasticsearch (node1 and node2)
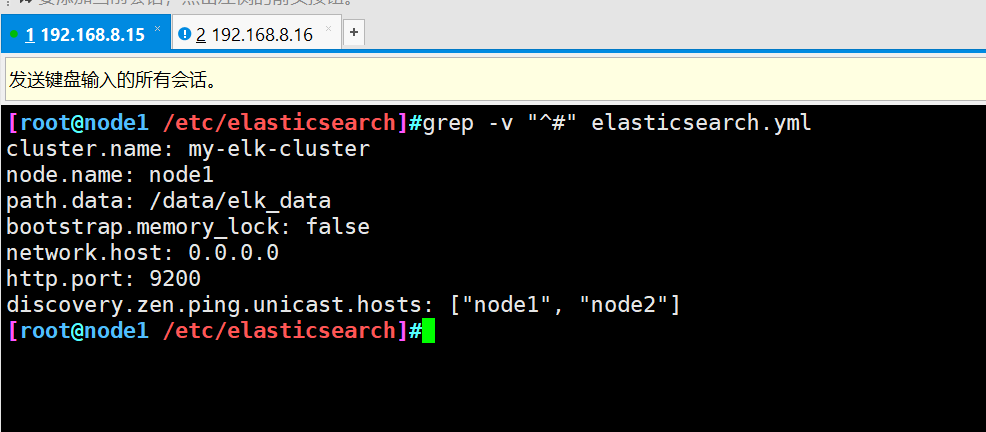
#Put the installation package in the opt directory and unpack it
cd /opt/
rpm -ivh elasticsearch-5.5.1\(1\).rpm
#Load system services
systemctl daemon-reload
systemctl enable elasticsearch.service
#Backup profile
cd /etc/elasticsearch/
cp elasticsearch.yml elasticsearch.yml.bak
#Modify master profile
vim elasticsearch.yml
17 that 's ok	cluster.name: my-elk-cluster							#Cluster name
23 that 's ok	node.name: node1										#Node name
33 that 's ok	path.data: /data/elk_data								#Data storage path
37 that 's ok	path.logs: /var/log/elasticsearch/						#Log storage path
43 that 's ok	bootstrap.memory_lock: false							#Do not lock the memory at startup (front-end cache, related to IOPS performance test method and read / write times per second)
55 that 's ok	network.host: 0.0.0.0									#Provides the IP address of the service binding. 0.0.0.0 represents all addresses
59 that 's ok	http.port: 9200											#The listening port is 9200
68 that 's ok	discovery.zen.ping.unicast.hosts: ["node1", "node2"]	#Cluster discovery is implemented by unicast

#Check configuration
grep -v "^#" /etc/elasticsearch/elasticsearch.yml
-
The node2 node master configuration file needs to change the node name to node2
-
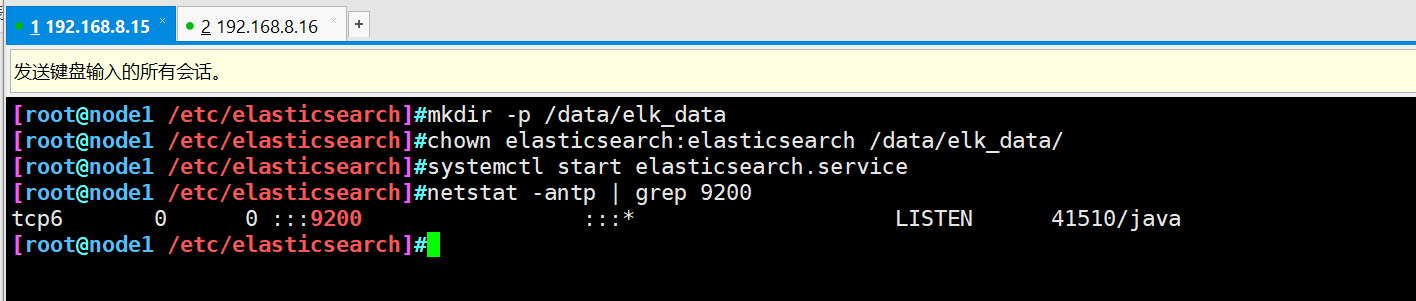
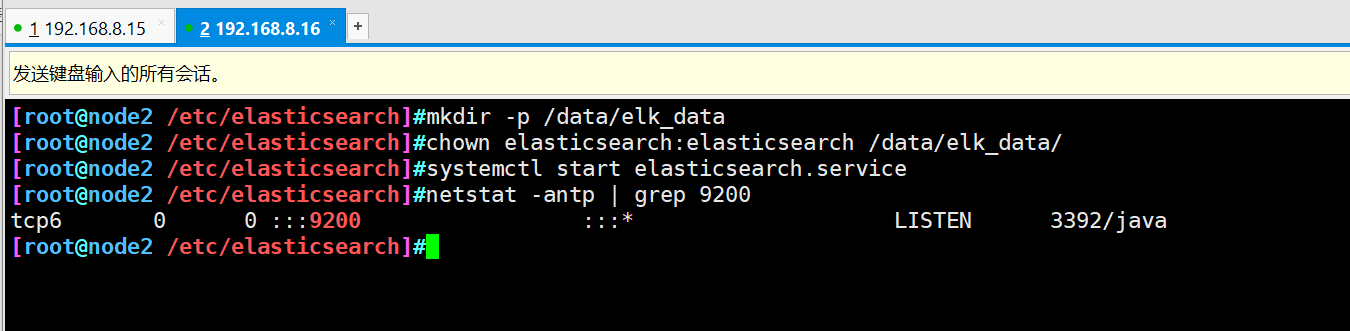
Create data storage path and authorize
mkdir -p /data/elk_data
chown elasticsearch:elasticsearch /data/elk_data/
- Open service and view
systemctl start elasticsearch.service
netstat -antp | grep 9200
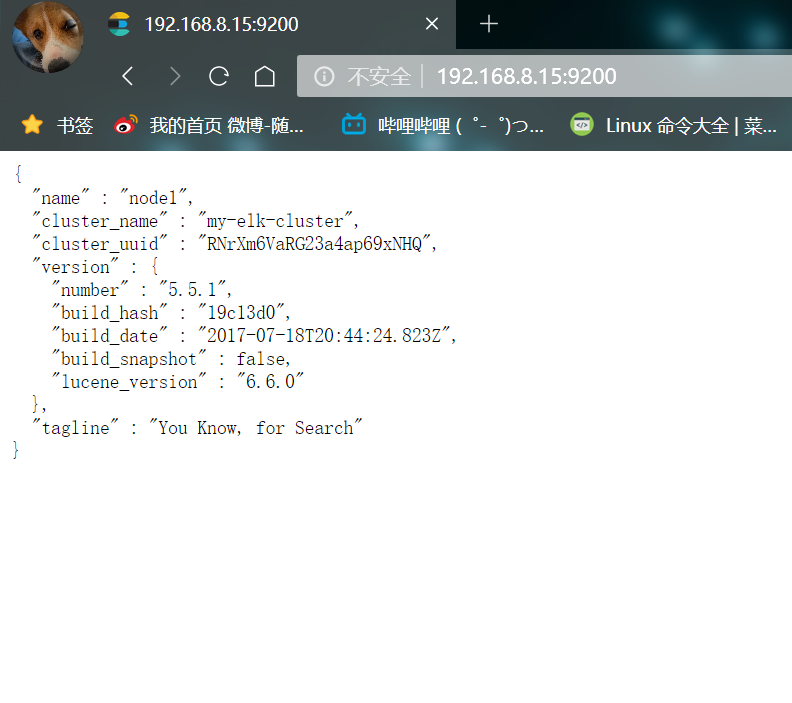
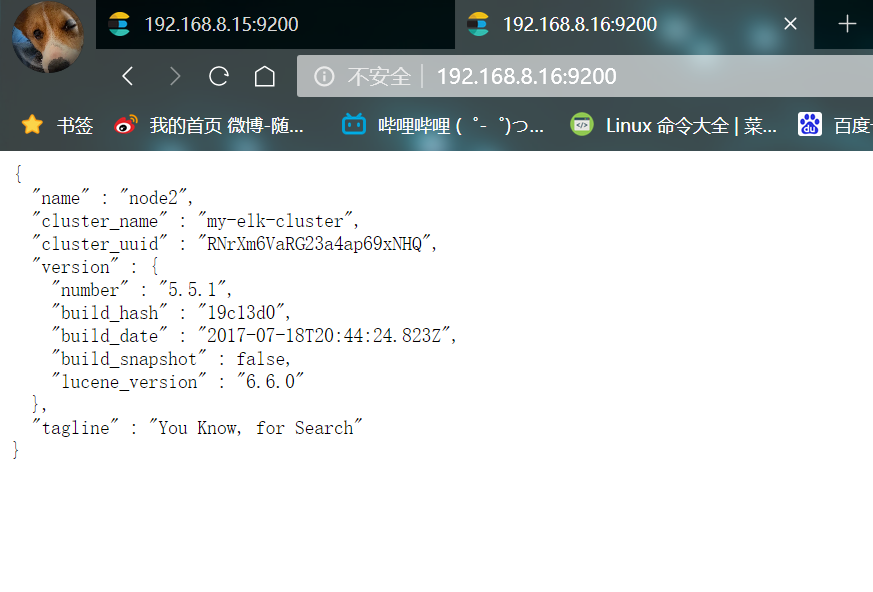
- View the node information and open it with the host browser http://192.168.8.15:9200
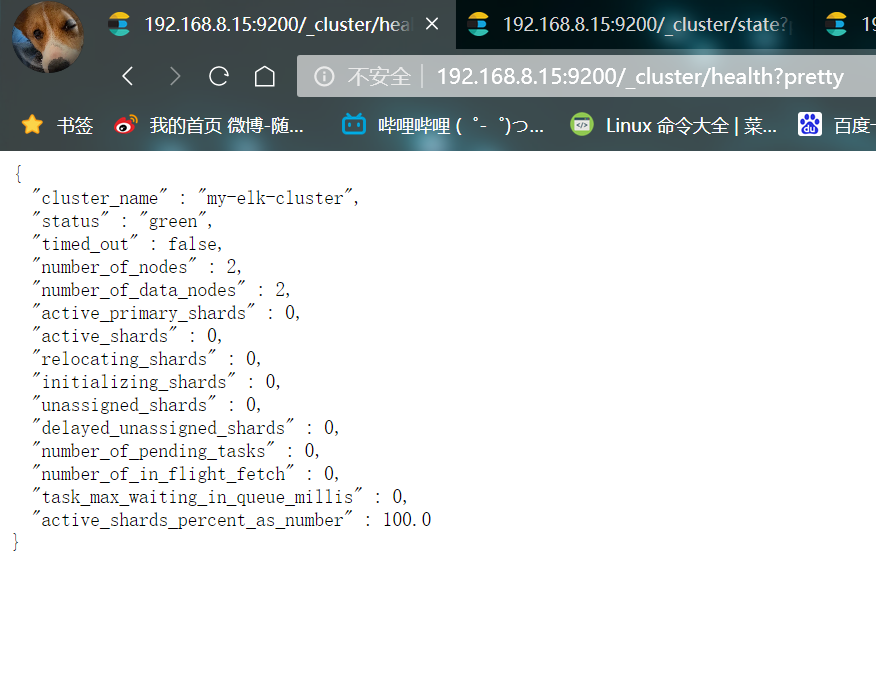
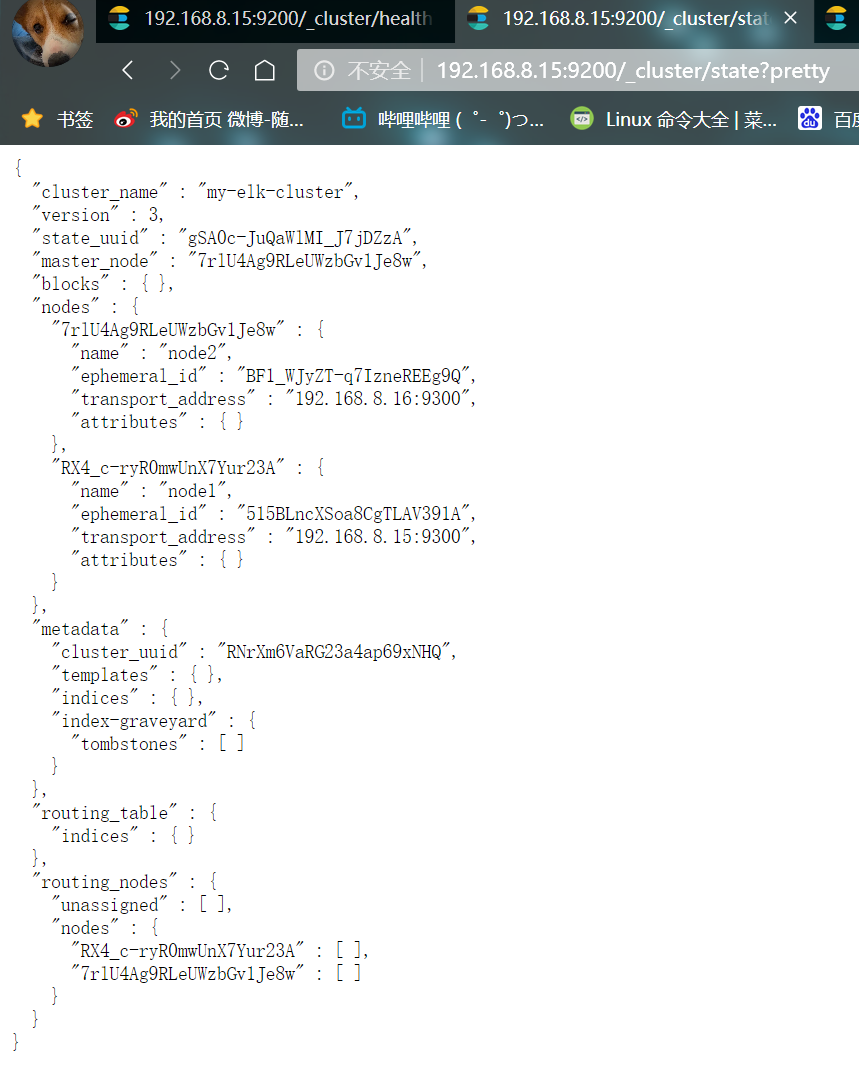
- Check the health and status of the cluster
Browser open
http://192.168.8.15:9200/_cluster/health?pretty
http://192.168.8.15:9200/_cluster/state?pretty
4. Install the elasticsearch head plug-in
The way to view clusters can be optimized by installing plug-ins
- ① Compile and install node component dependent packages
#Transfer the software package to this directory
cd /opt
yum install -y gcc gcc-c++.x86_64 ++ make

tar zxvf node-v8.2.1.tar.gz
cd node-v8.2.1/
./configure
make -j 4 && make install
- ② Installing phantomjs (front-end frame)
#The software package is transferred to the src directory
cd /usr/local/src/
tar jxvf phantomjs-2.1.1-linux-x86_64.tar.bz2
cd phantomjs-2.1.1-linux-x86_64/bin
cp phantomjs /usr/local/bin
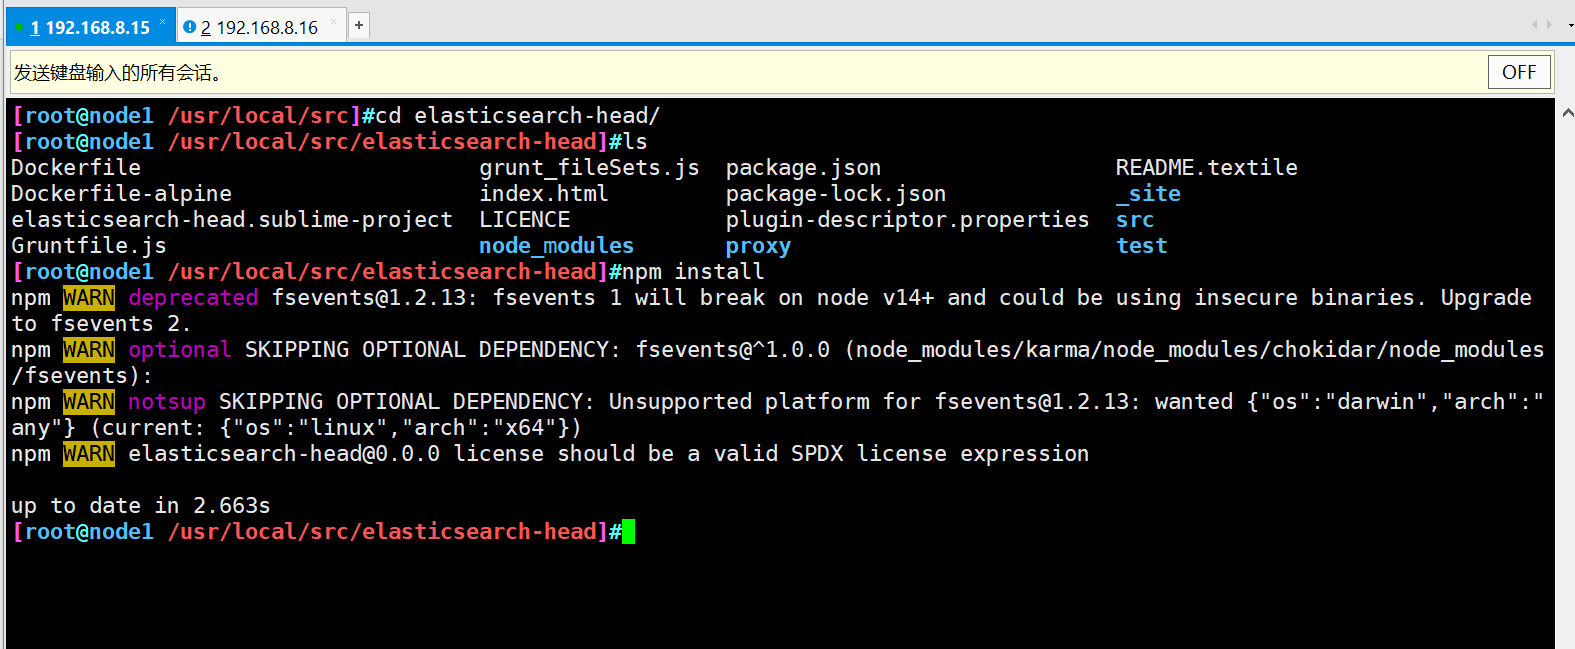
- ③ Install elasticsearch head (data visualization tool)
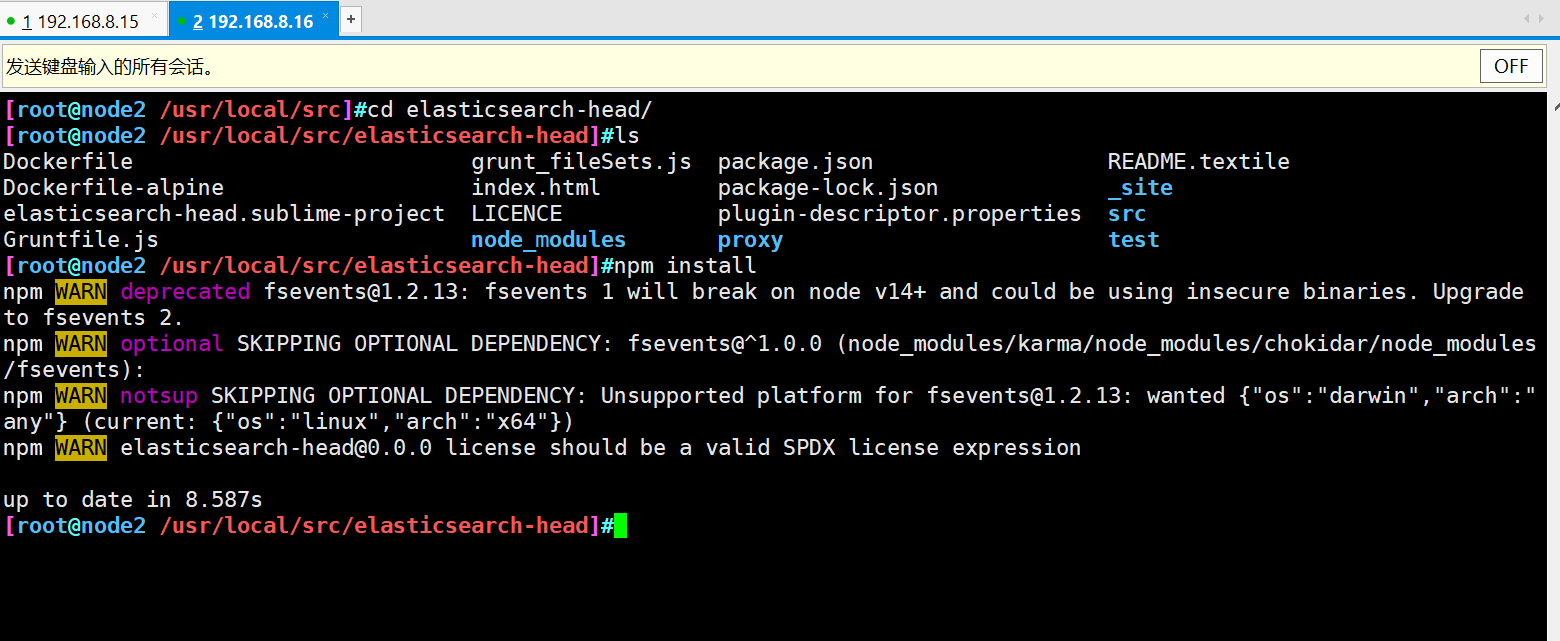
#Transfer the software package to the src directory
cd /usr/local/src/
tar zxvf elasticsearch-head.tar.gz
cd elasticsearch-head/
npm install
- ④ Modify master profile
cd

vim /etc/elasticsearch/elasticsearch.yml
#Add configuration at the end
http.cors.enabled: true						#Enable cross domain access support. The default value is false
http.cors.allow-origin: "*"					#Allowed domain names and addresses for cross domain access

systemctl restart elasticsearch.service
- ⑤ Start elasticsearch head
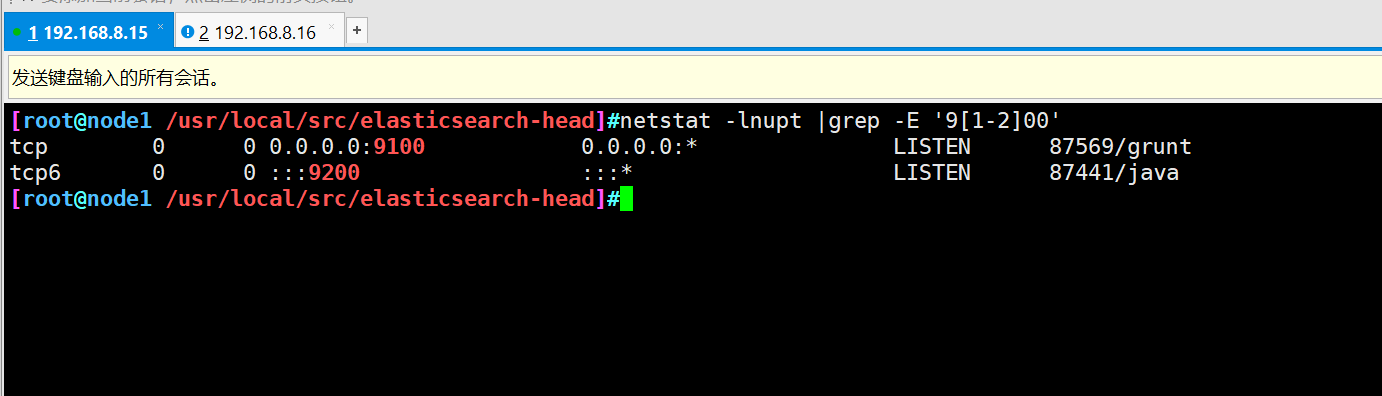
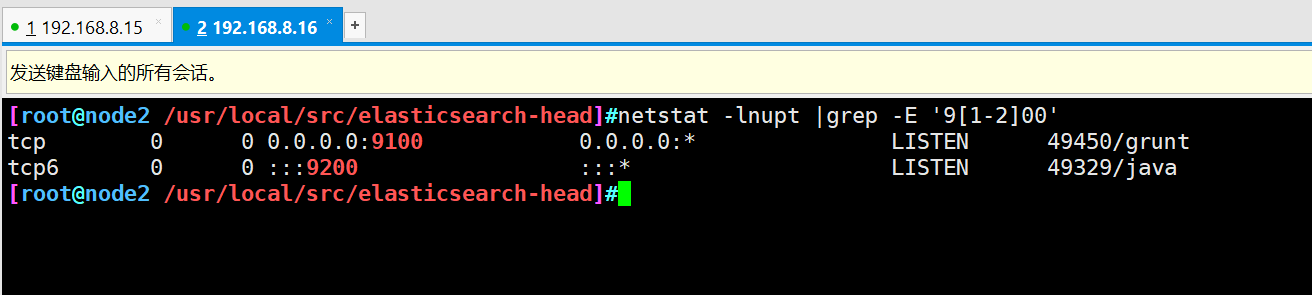
cd /usr/local/src/elasticsearch-head/
npm run start &

netstat -lnupt |grep -E '9[1-2]00'
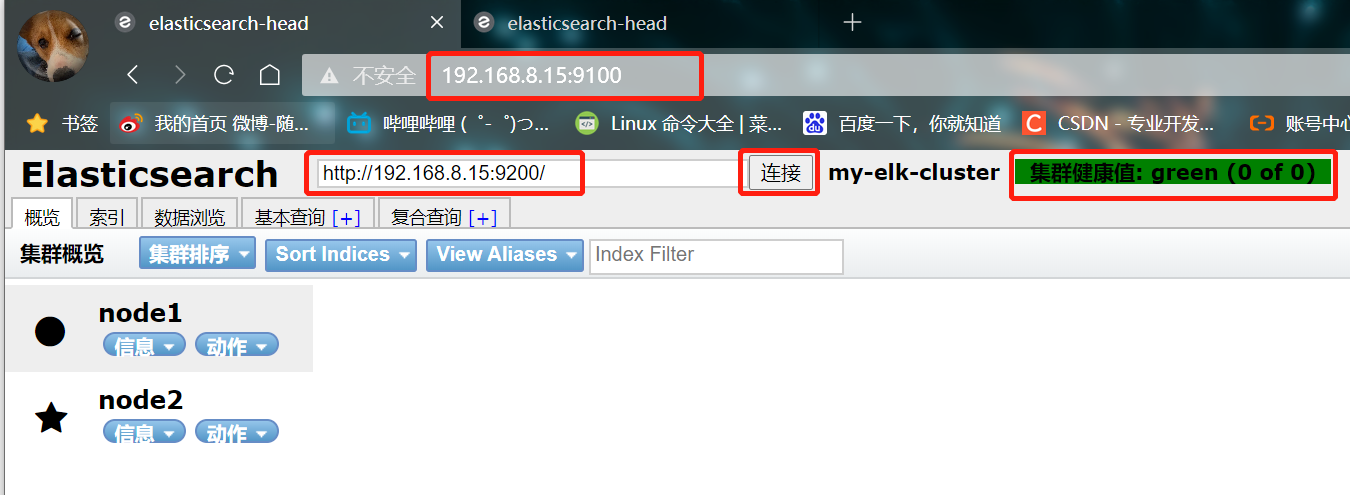
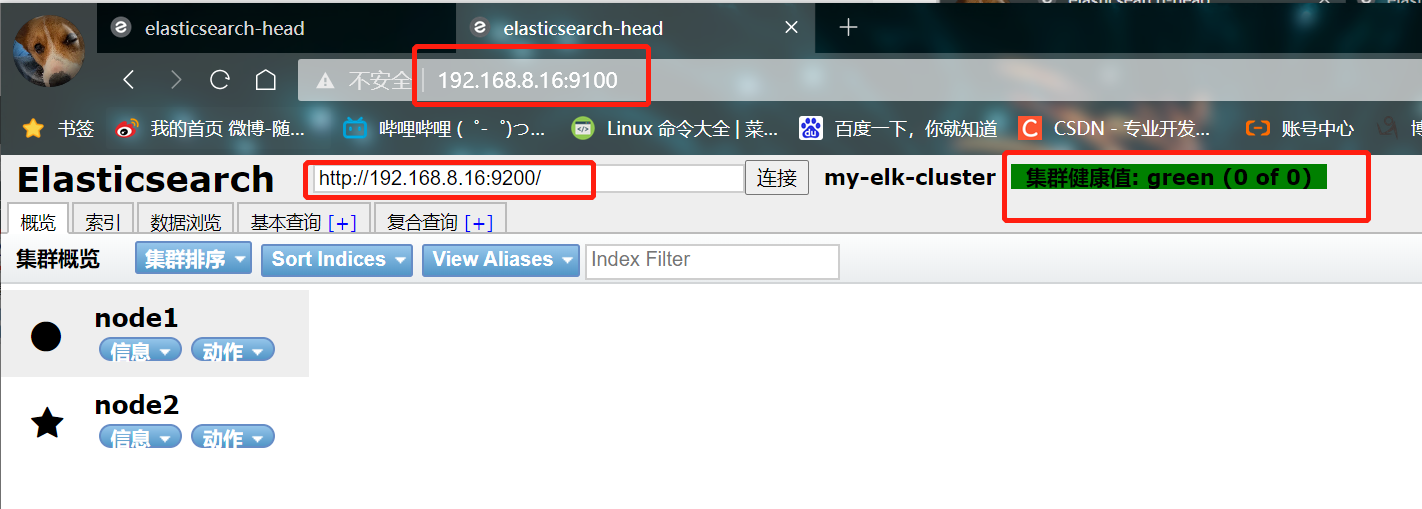
- Open test with browser
Open a browser to access http://192.168.8.15:9100/
Then enter in the column after elastic search http://192.168.8.15:9200 , click Connect
See if the cluster color is healthy green
node2 does the same
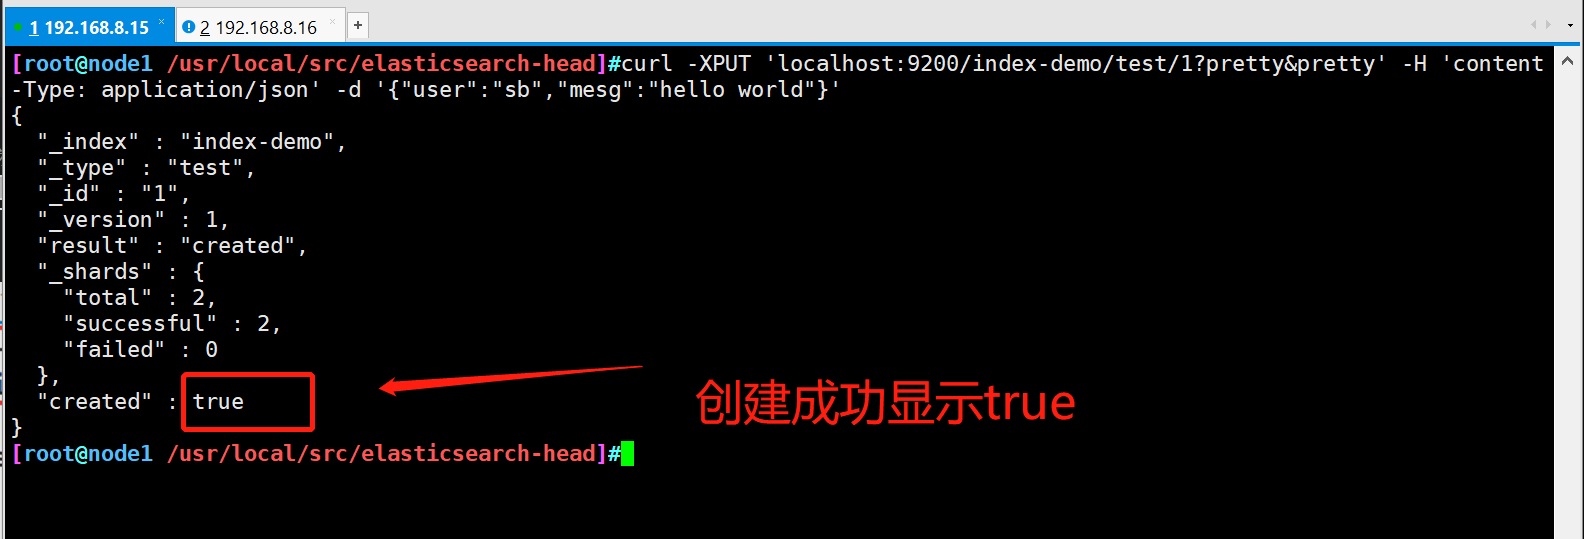
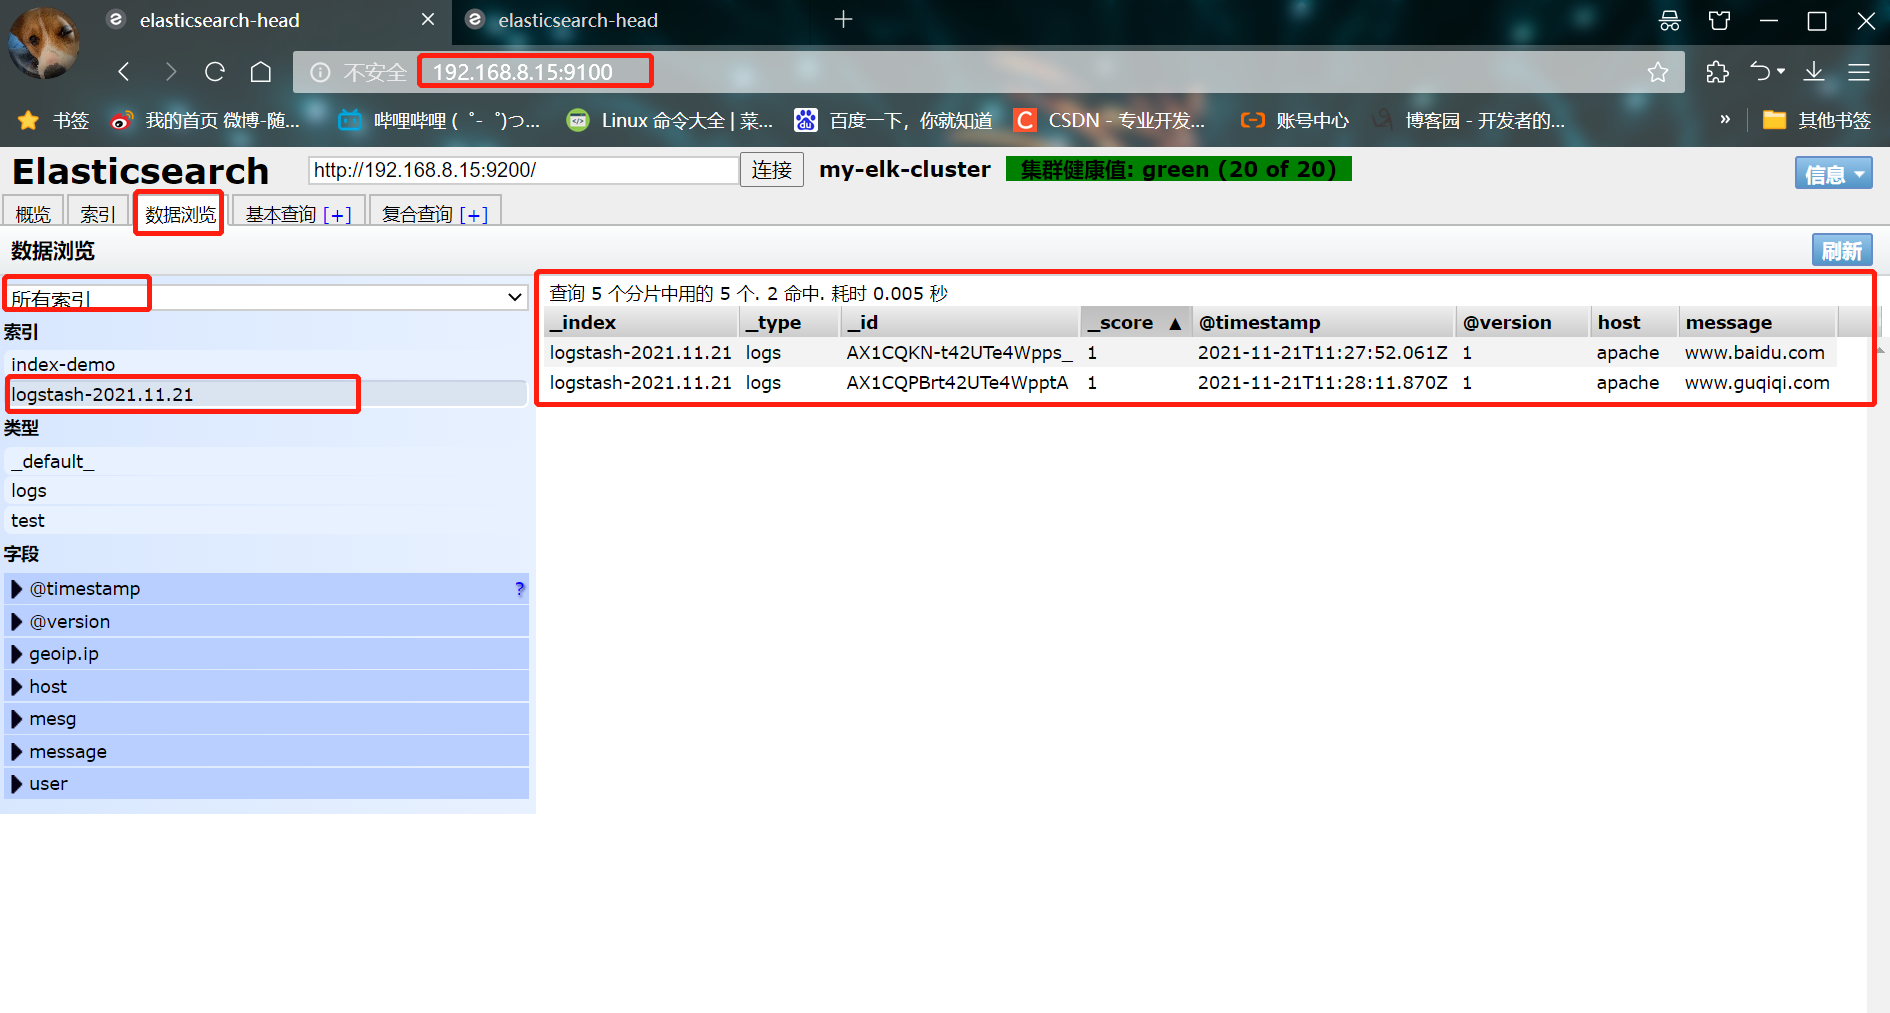
- Create an index on node1. The index name is index demo and the type is test. You can see the successful creation
curl -XPUT 'localhost:9200/index-demo/test/1?pretty&pretty' -H 'content-Type: application/json' -d '{"user":"sb","mesg":"hello world"}'
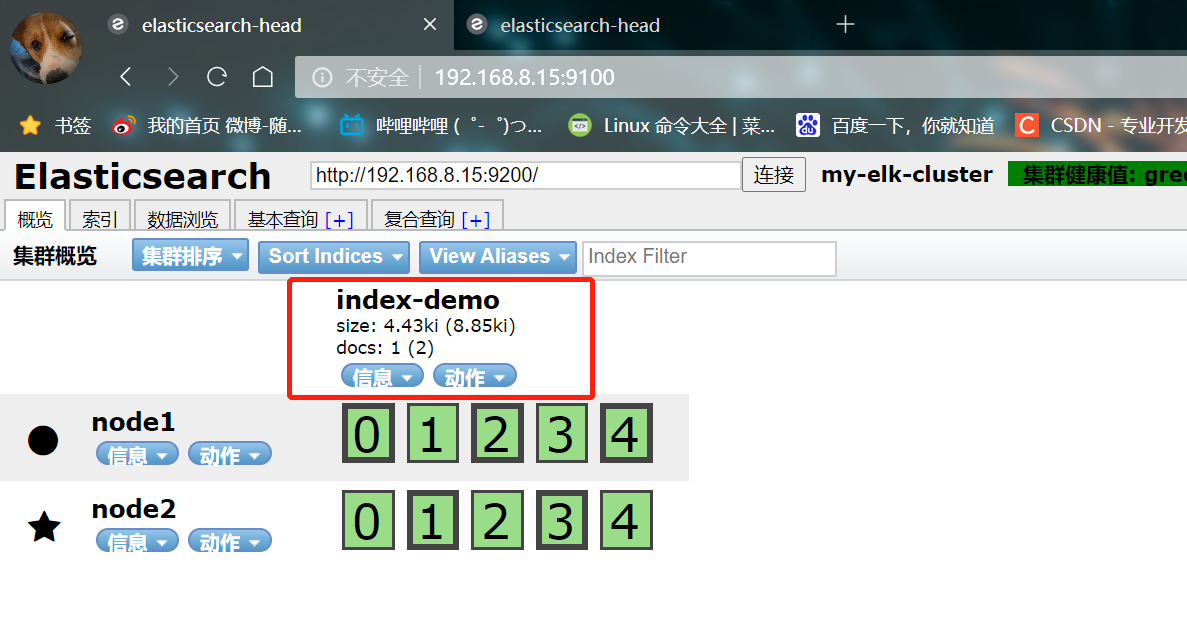
- The browser logs in to node1 to view the index information
You can see that the index is divided into 5 by default, and there is a copy
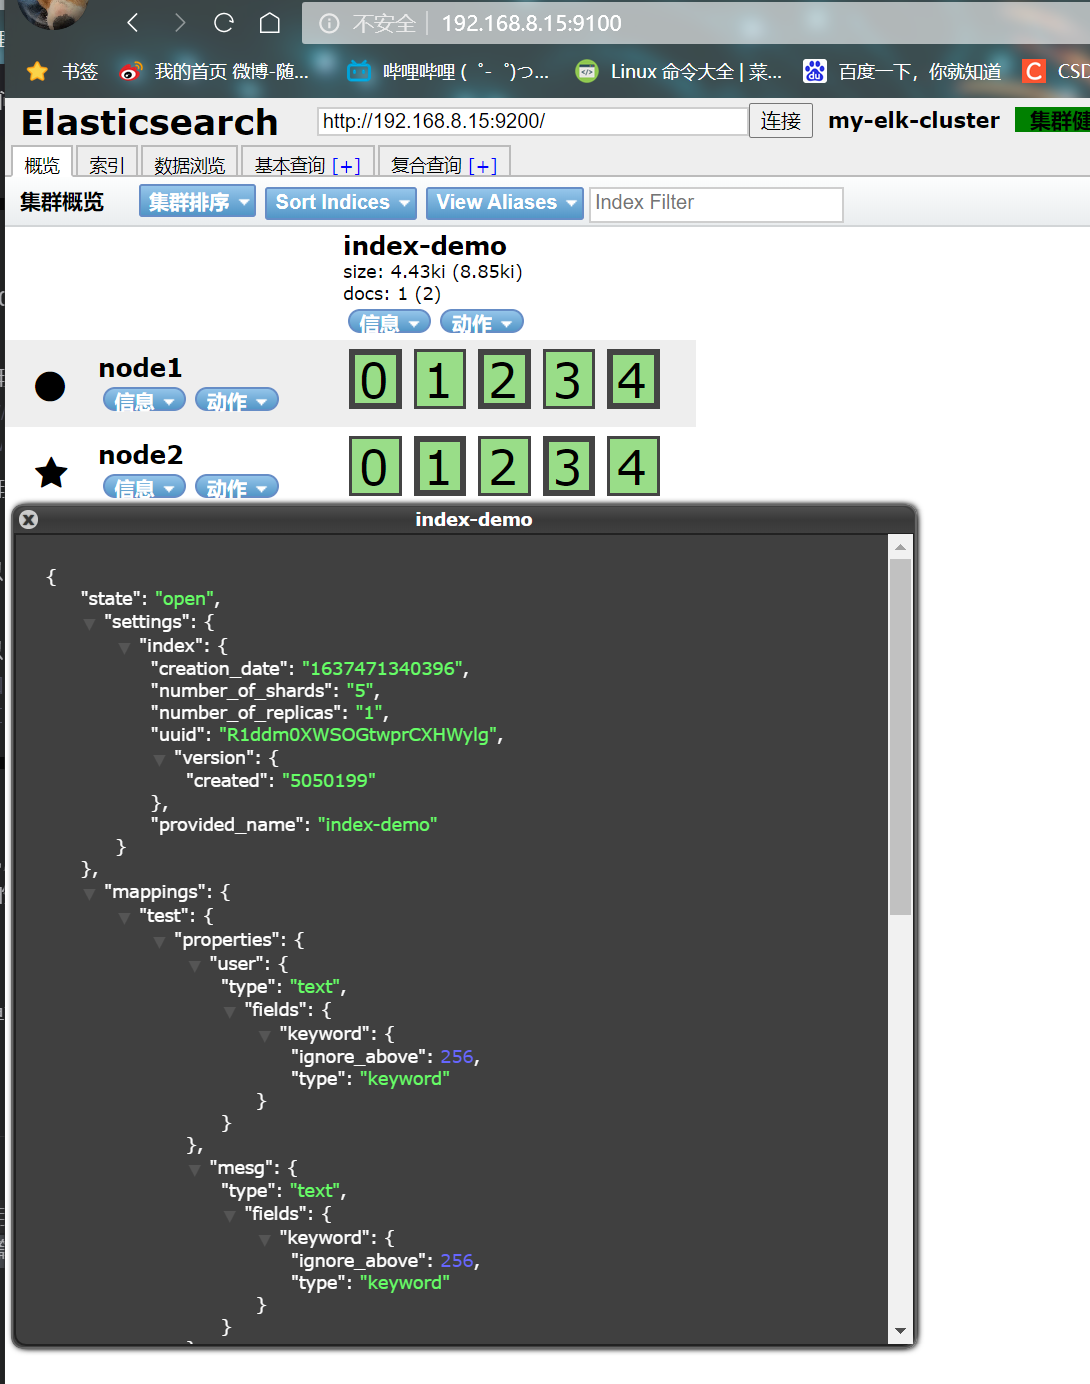
Click data browse and you will find that the index created on node1 is index demo and the type is test
5. Install logstash
- The Java environment also needs to be configured on 192.168.8.17
hostnamectl set-hostname apache
yum install -y httpd
systemctl start httpd.service
systemctl status httpd.service
- ① Install logstash
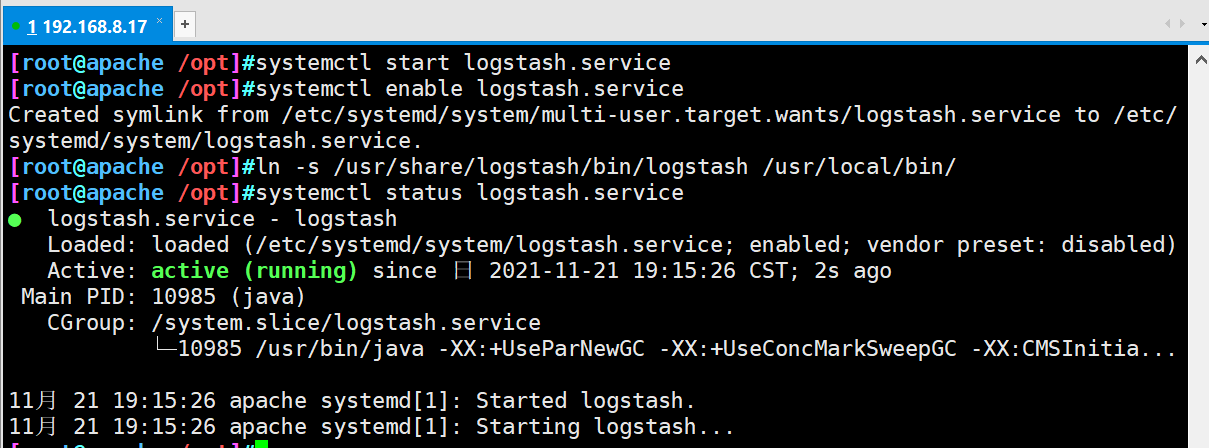
#Transfer the software package to the opt directory
cd /opt
rpm -ivh logstash-5.5.1.rpm
systemctl start logstash.service
systemctl enable logstash.service

#Establish soft connection to facilitate system identification
ln -s /usr/share/logstash/bin/logstash /usr/local/bin/
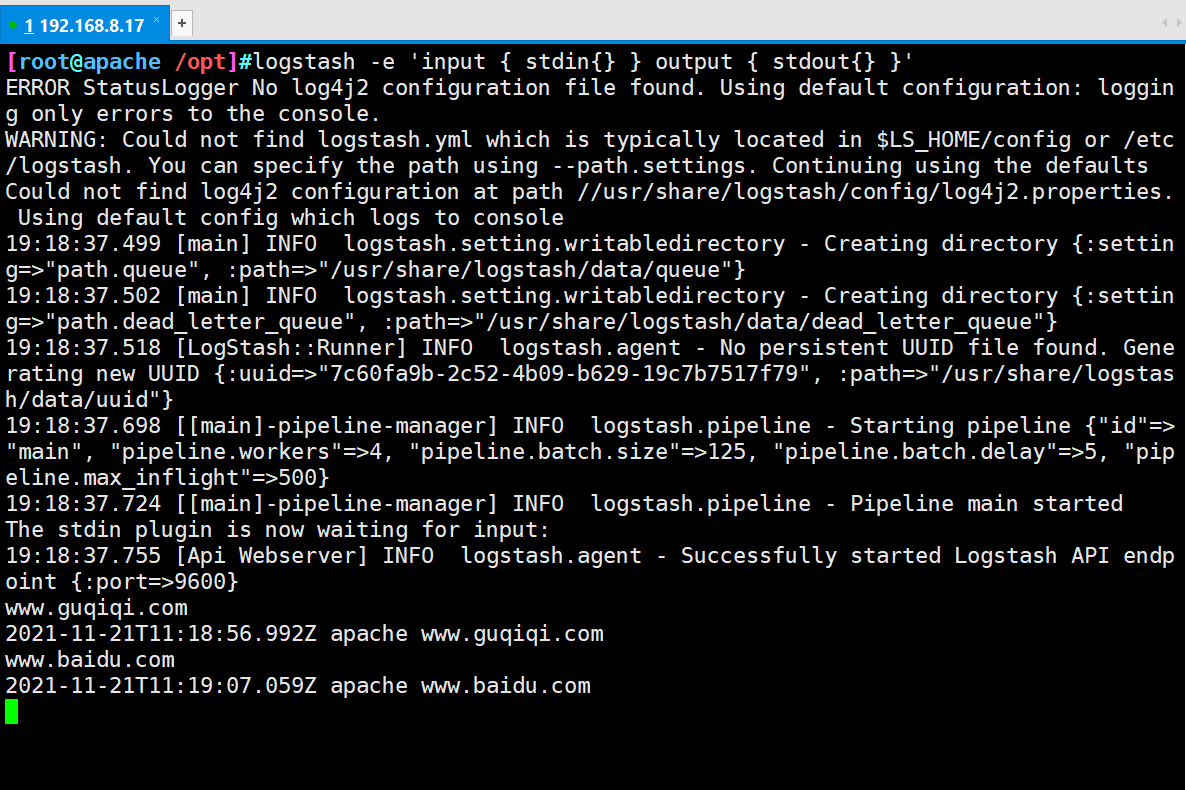
- ② Do docking test to see if logstash (Apache) and elasticsearch (node) function normally
Logstash [option] [object]
-f: This option allows you to specify logstash According to the configuration file logstash
-e: Followed by a string that can be treated as logstash Configuration of (if yes)" ",It is used by default stdin As input stdout As output)
-t: Test that the configuration file is correct and exit
logstash -e 'input { stdin{} } output { stdout{} }'

#Input content
www.baidu.com
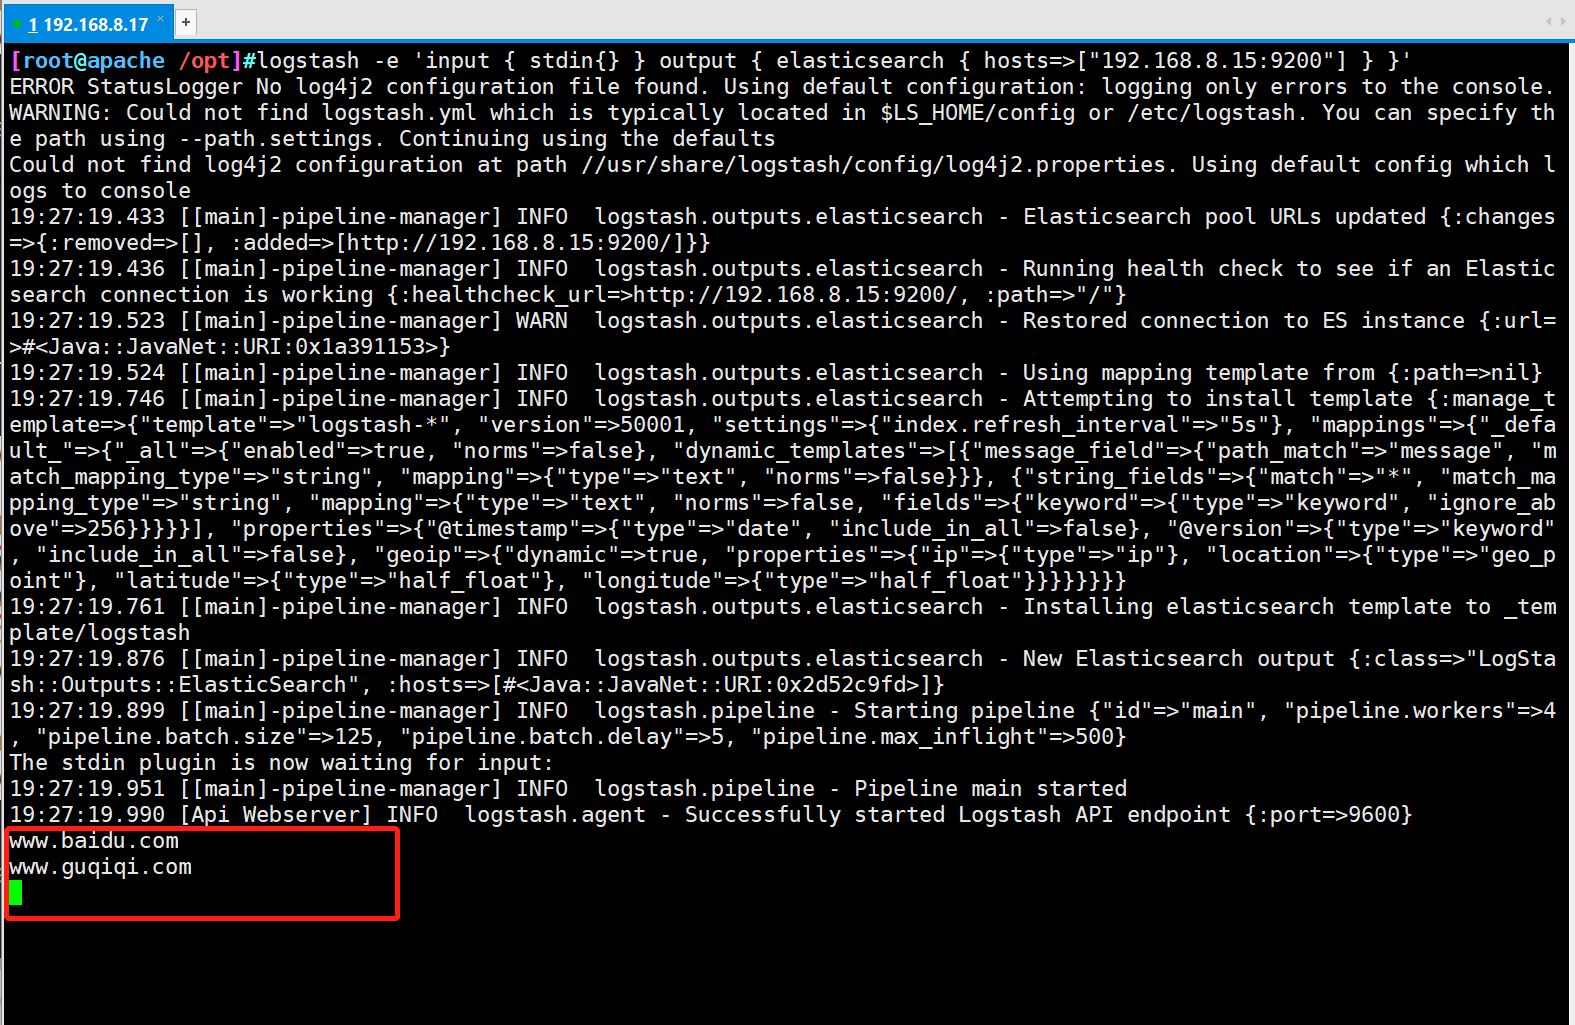
- ③ Use rubydebug to display detailed output, and codec is a codec
logstash -e 'input { stdin{} } output { elasticsearch { hosts=>["192.168.8.15:9200"] } }'
...
#Input content
www.baidu.com
...
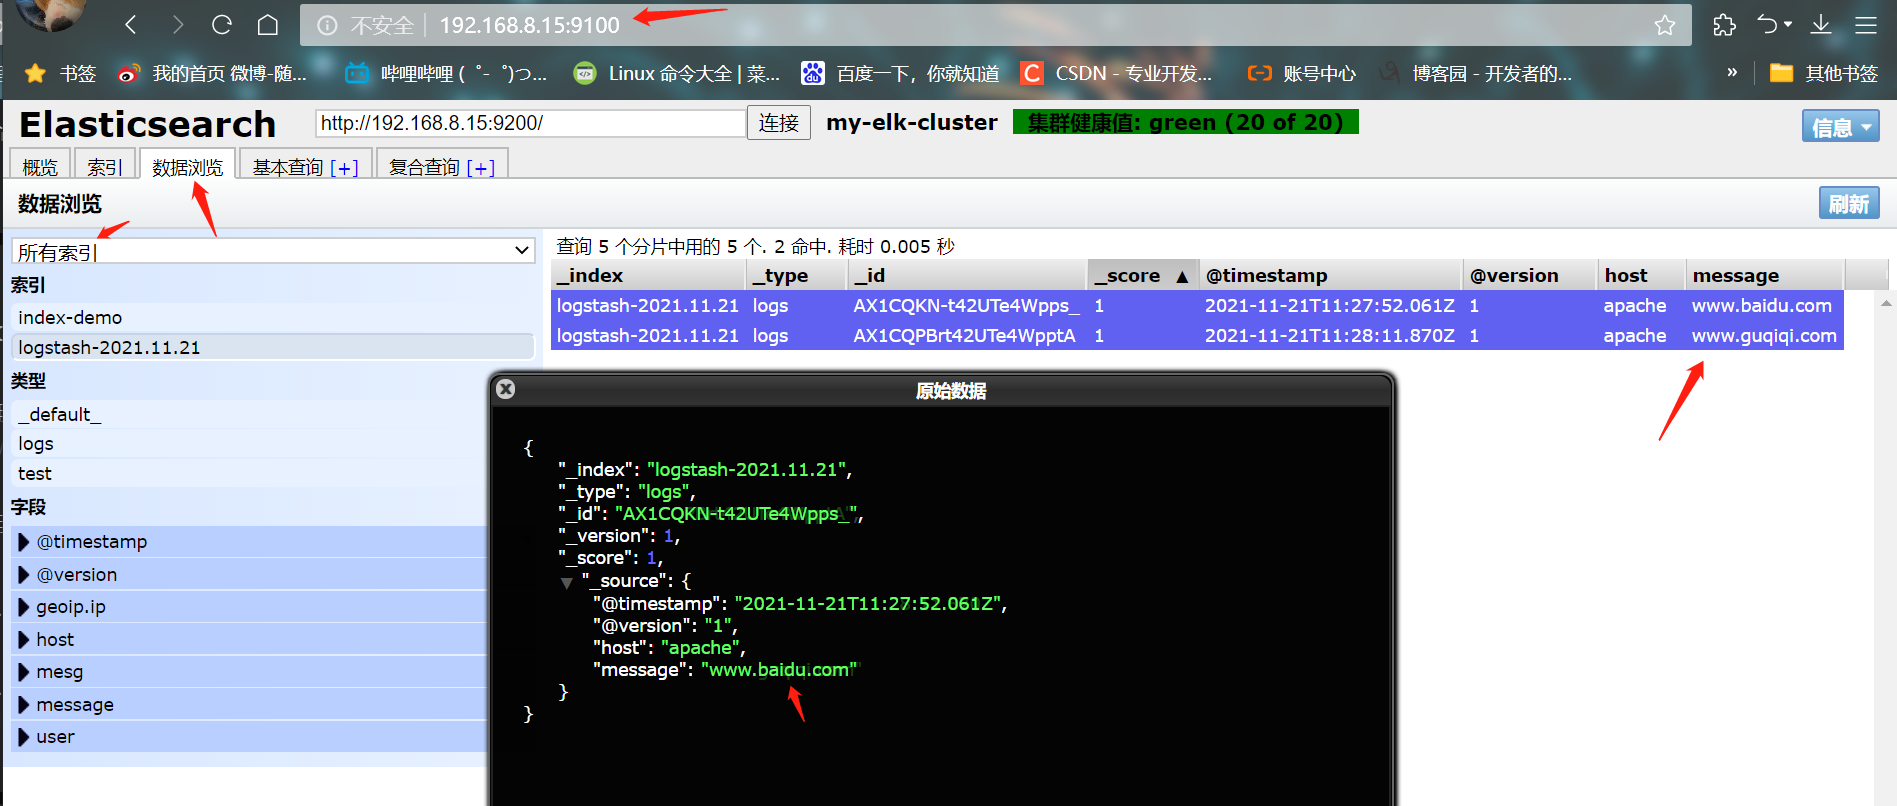
- ④ Access with browser http://192.168.8.15:9100/ , view index information
- ⑤ Log in to the Apache host for docking configuration (Kibana)
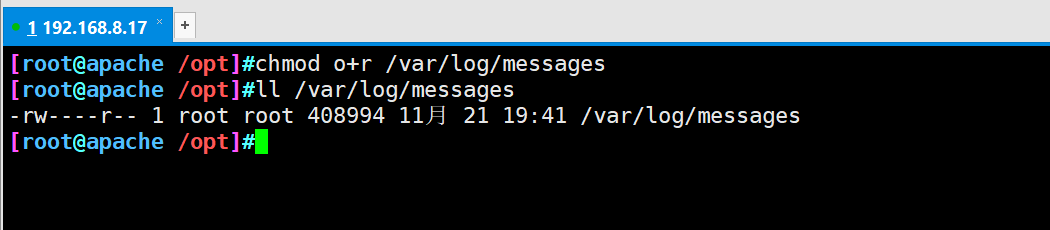
#The Logstash configuration file is mainly composed of three parts: input, output and filter (as required)

chmod o+r /var/log/messages
ll /var/log/messages
#What is defined in the configuration file is to collect system logs
vim /etc/logstash/conf.d/system.conf
input {
		file{
        path => "/var/log/messages"
        type => "system"
        start_position => "beginning"
			}
		}

output {
        elasticsearch {
          hosts => ["192.168.8.15:9200"]
          index => "system-%{+YYYY.MM.dd}"
					  }
       }

systemctl restart logstash.service
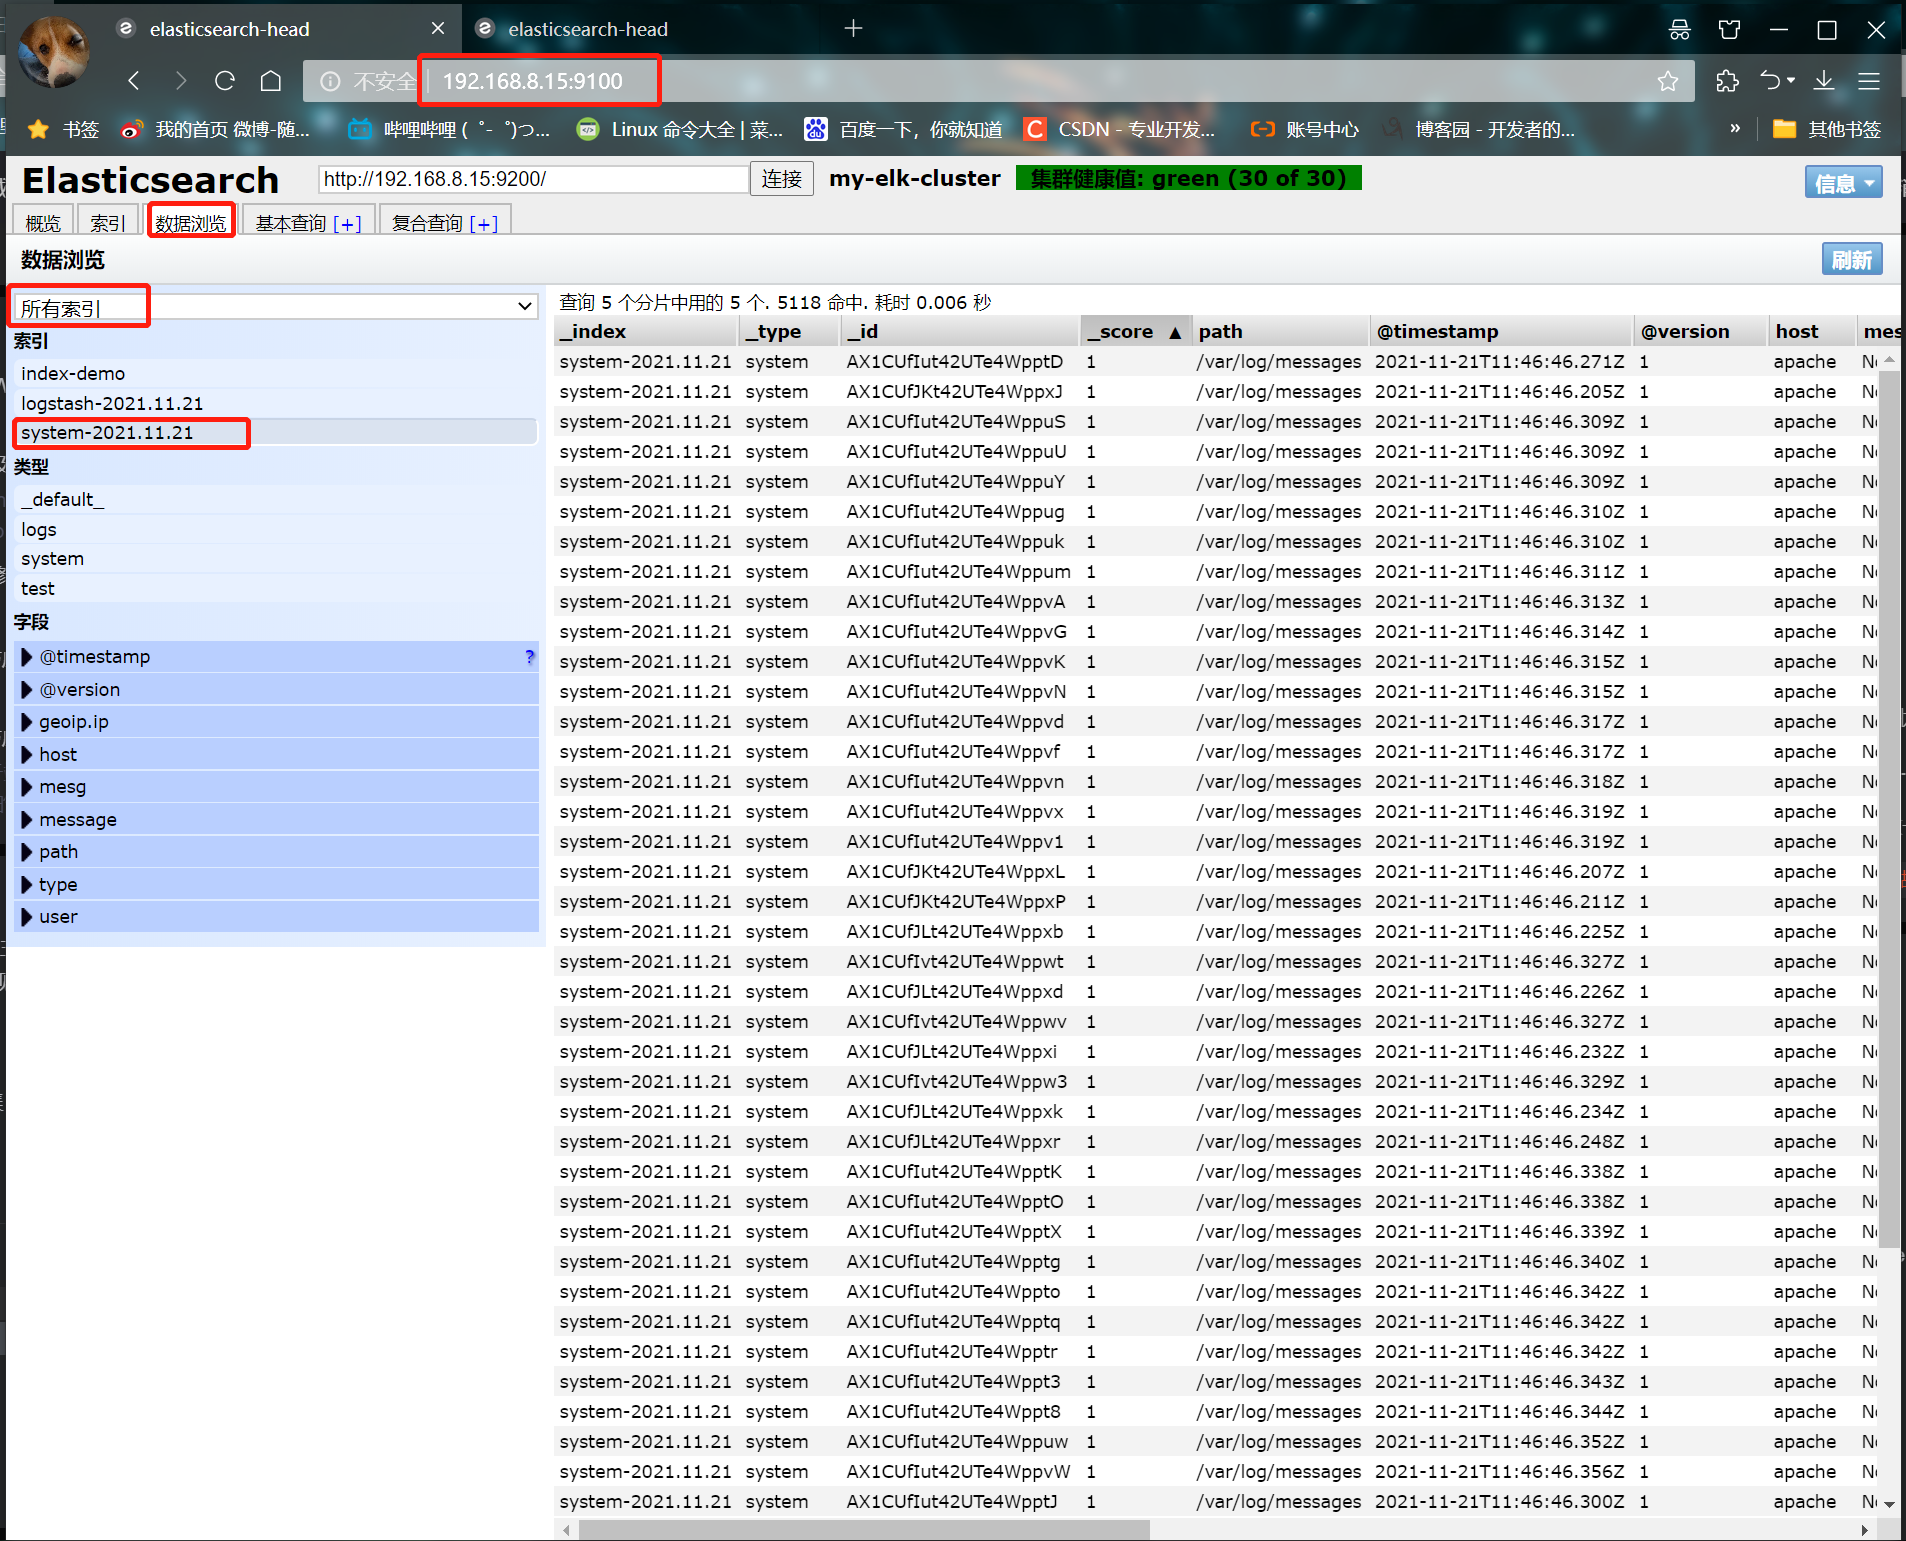
- ⑥ Browser access http://192.168.8.15:9100/ View index information
6. Install kibana (node1)
- ① Install kibana
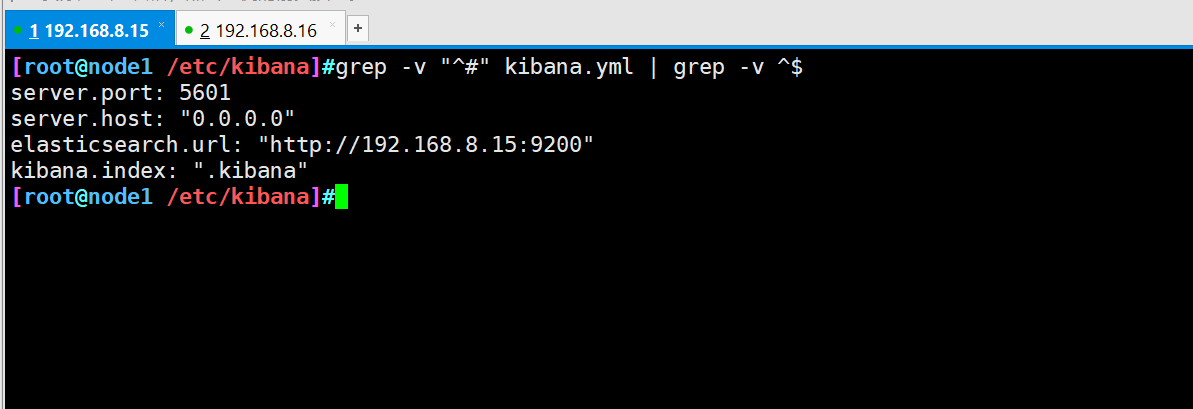
cd /usr/local/src/
#Transfer the software package to the src directory
rpm -ivh kibana-5.5.1-x86_64.rpm

cd /etc/kibana/
cp kibana.yml kibana.yml.bak

vim kibana.yml
2 that 's ok	server.port: 5601                						#kibana open port
7 that 's ok	server.host: "0.0.0.0"           						#Address where kibana listens
21 that 's ok	elasticsearch.url: "http://192.168.8.15:9200" 		# Contact elasticsearch
30 that 's ok	kibana.index: ".kibana"								#Add the. kibana index in elasticsearch


systemctl start kibana.service
systemctl enable kibana.service
7. Verification results
- ② Browser access 192.168.8.15:5601
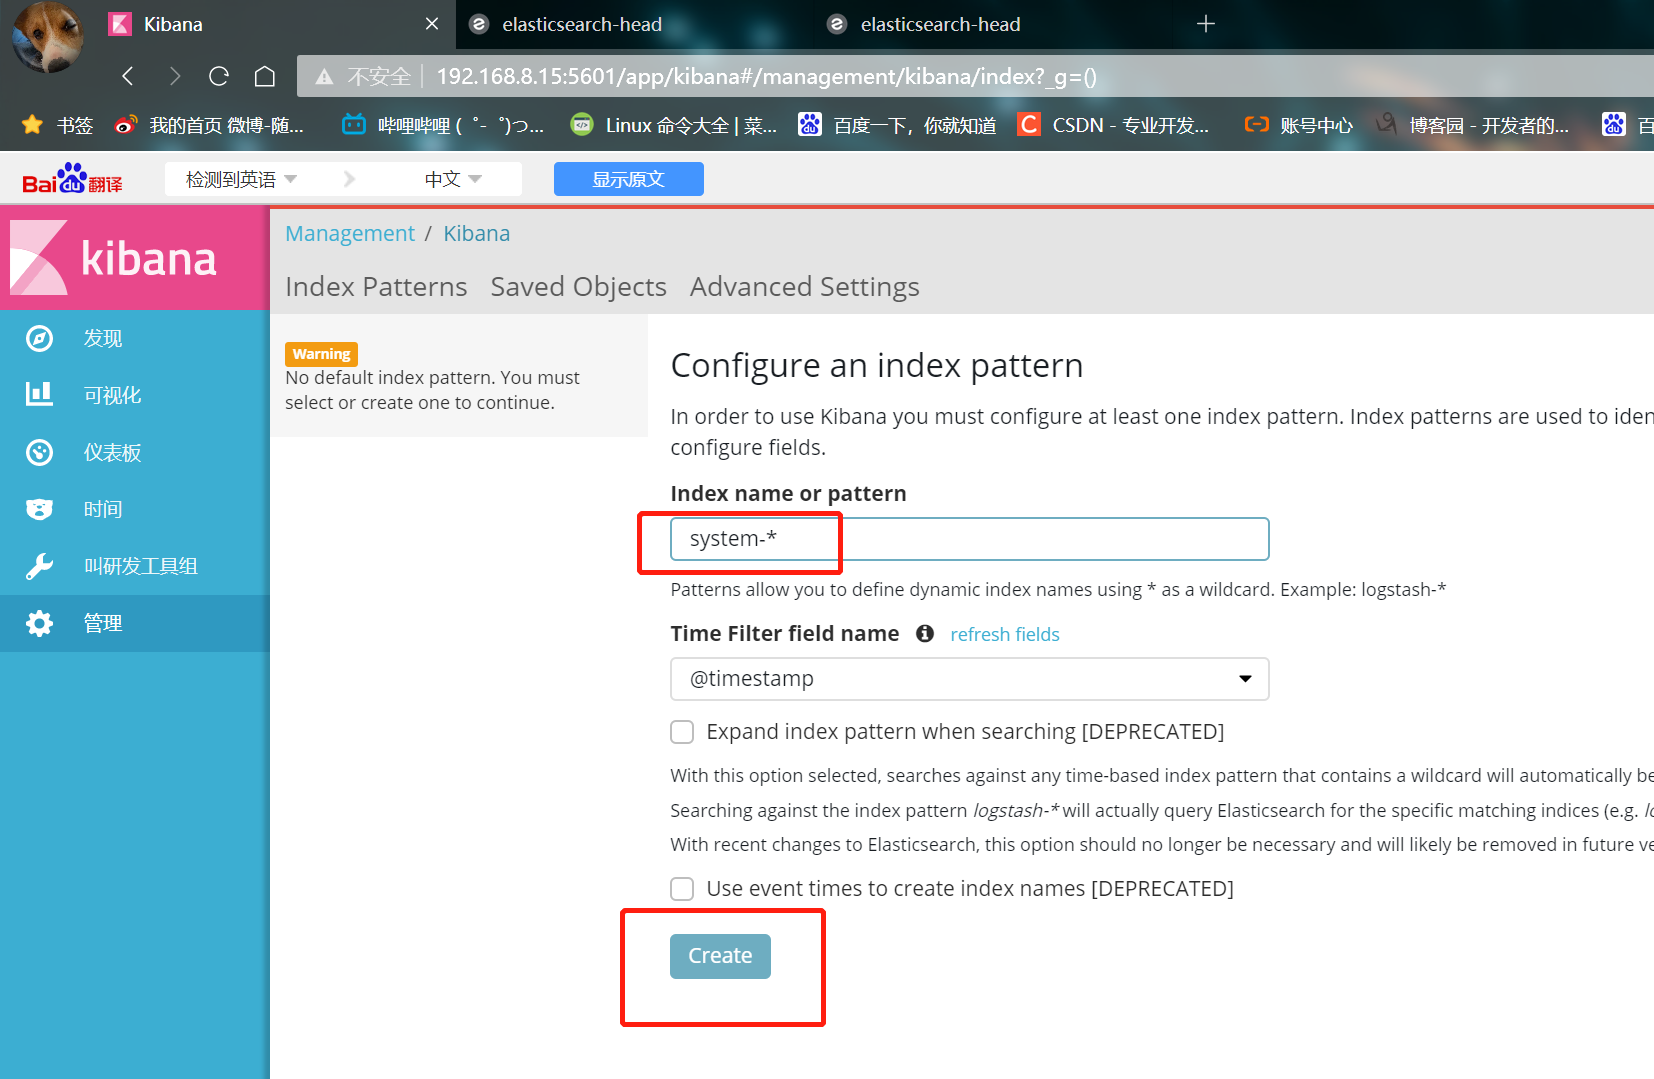
Create an index name for the first login: system-*
① Enter system below-*
② Then click the Create button below to create
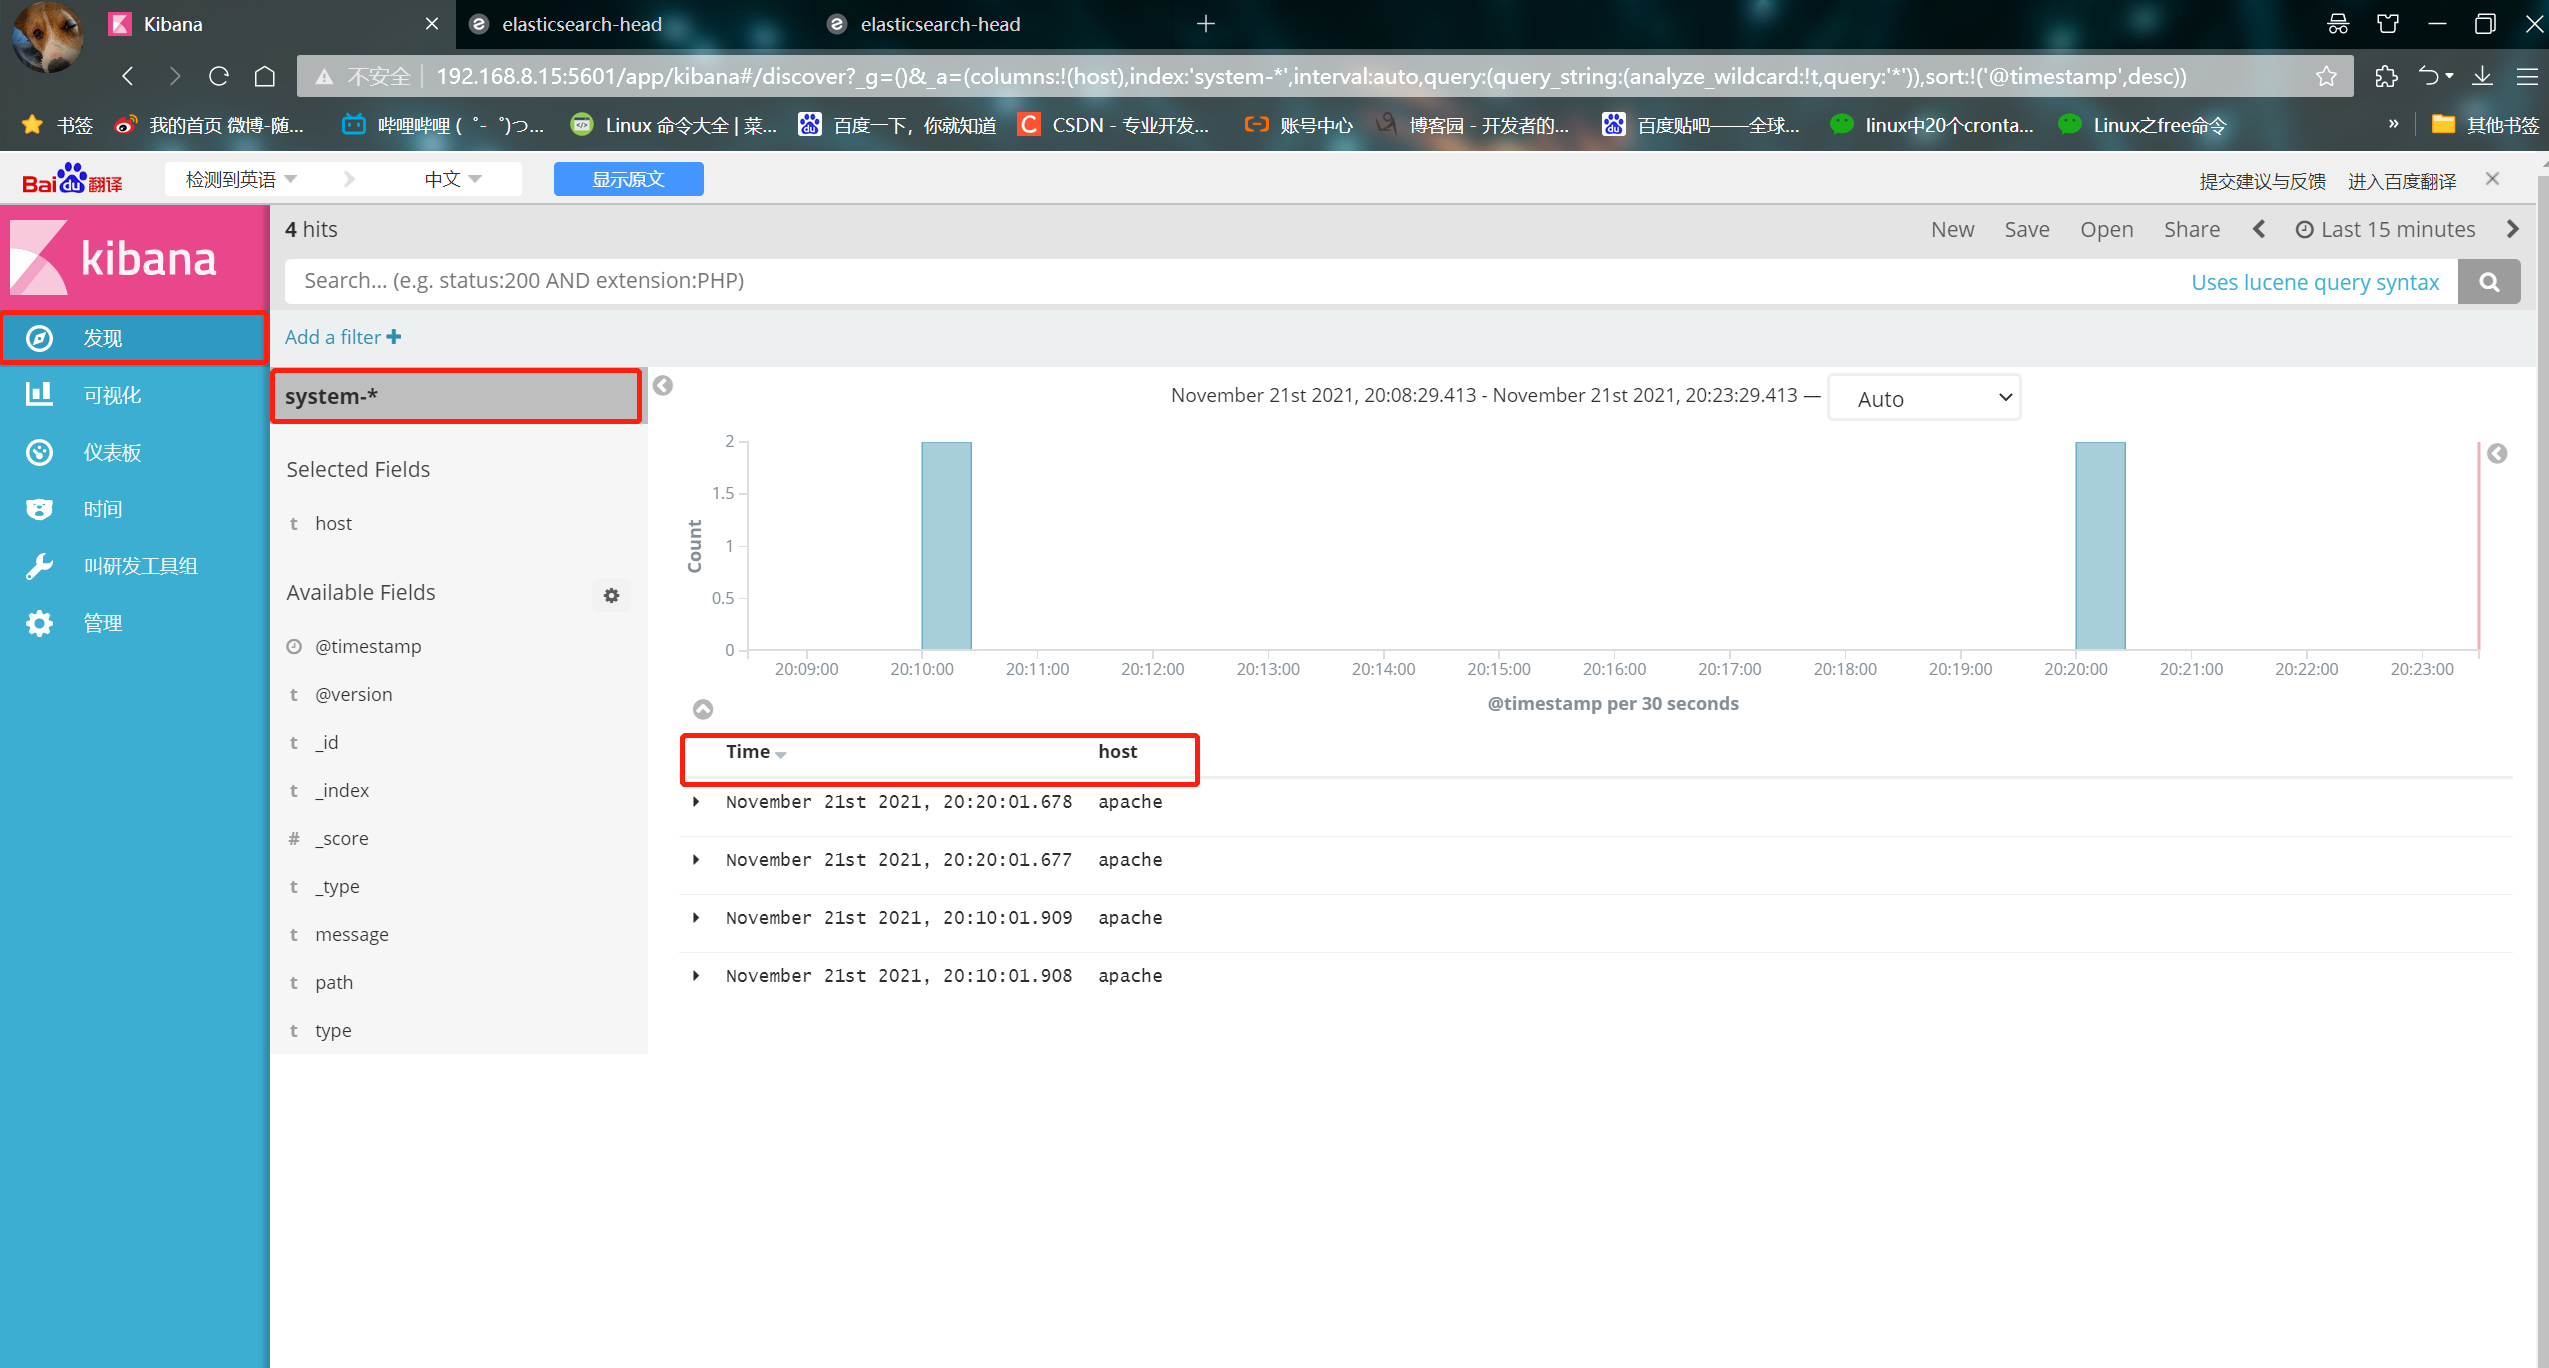
③ Click the Discover button in the upper left corner to find the system - * information
④ Click add next to the host below, and you will find that the figure on the right has only the Time and host options
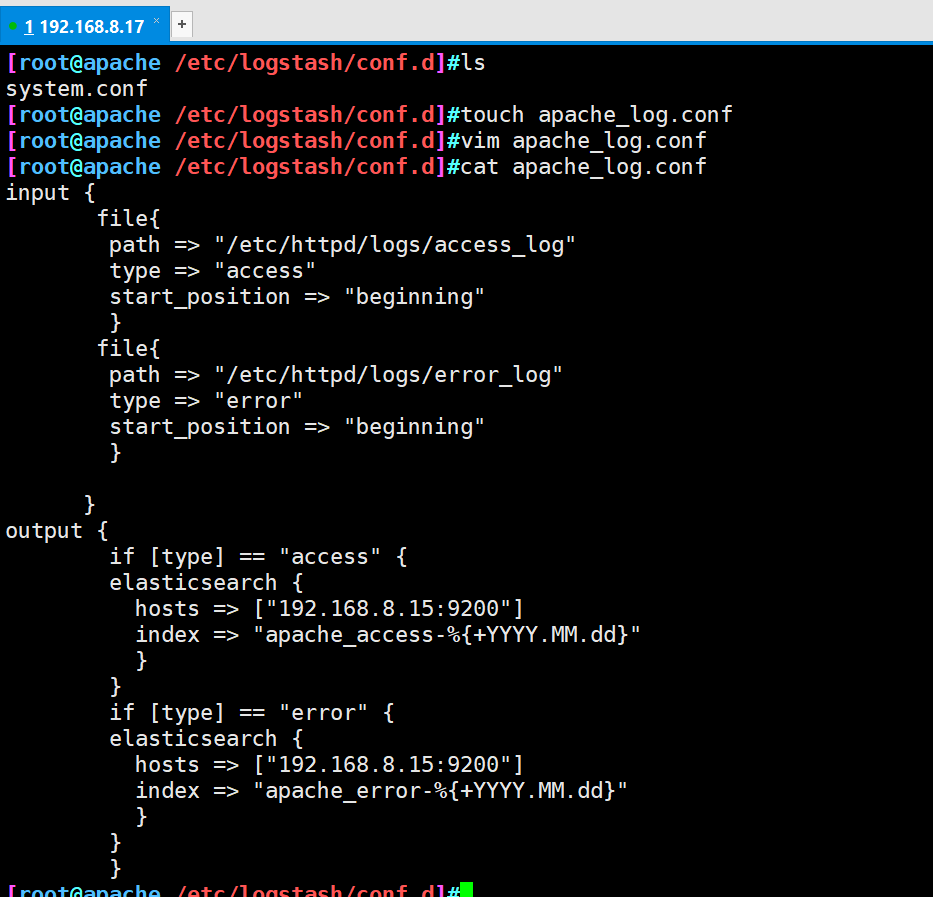
- ③ Apache log file for docking with Apache host
Apache: 192.168.8.17
cd /etc/logstash/conf.d/
touch apache_log.conf
vim apache_log.conf
input {
file{
path => "/etc/httpd/logs/access_log"
type => "access"
start_position => "beginning"
}
file{
path => "/etc/httpd/logs/error_log"
type => "error"
start_position => "beginning"
}
}
output {
if [type] == "access" {
elasticsearch {
hosts => ["192.168.8.15:9200"]
index => "apache_access-%{+YYYY.MM.dd}"
}
}
if [type] == "error" {
elasticsearch {
hosts => ["192.168.8.15:9200"]
index => "apache_error-%{+YYYY.MM.dd}"
}
}
}
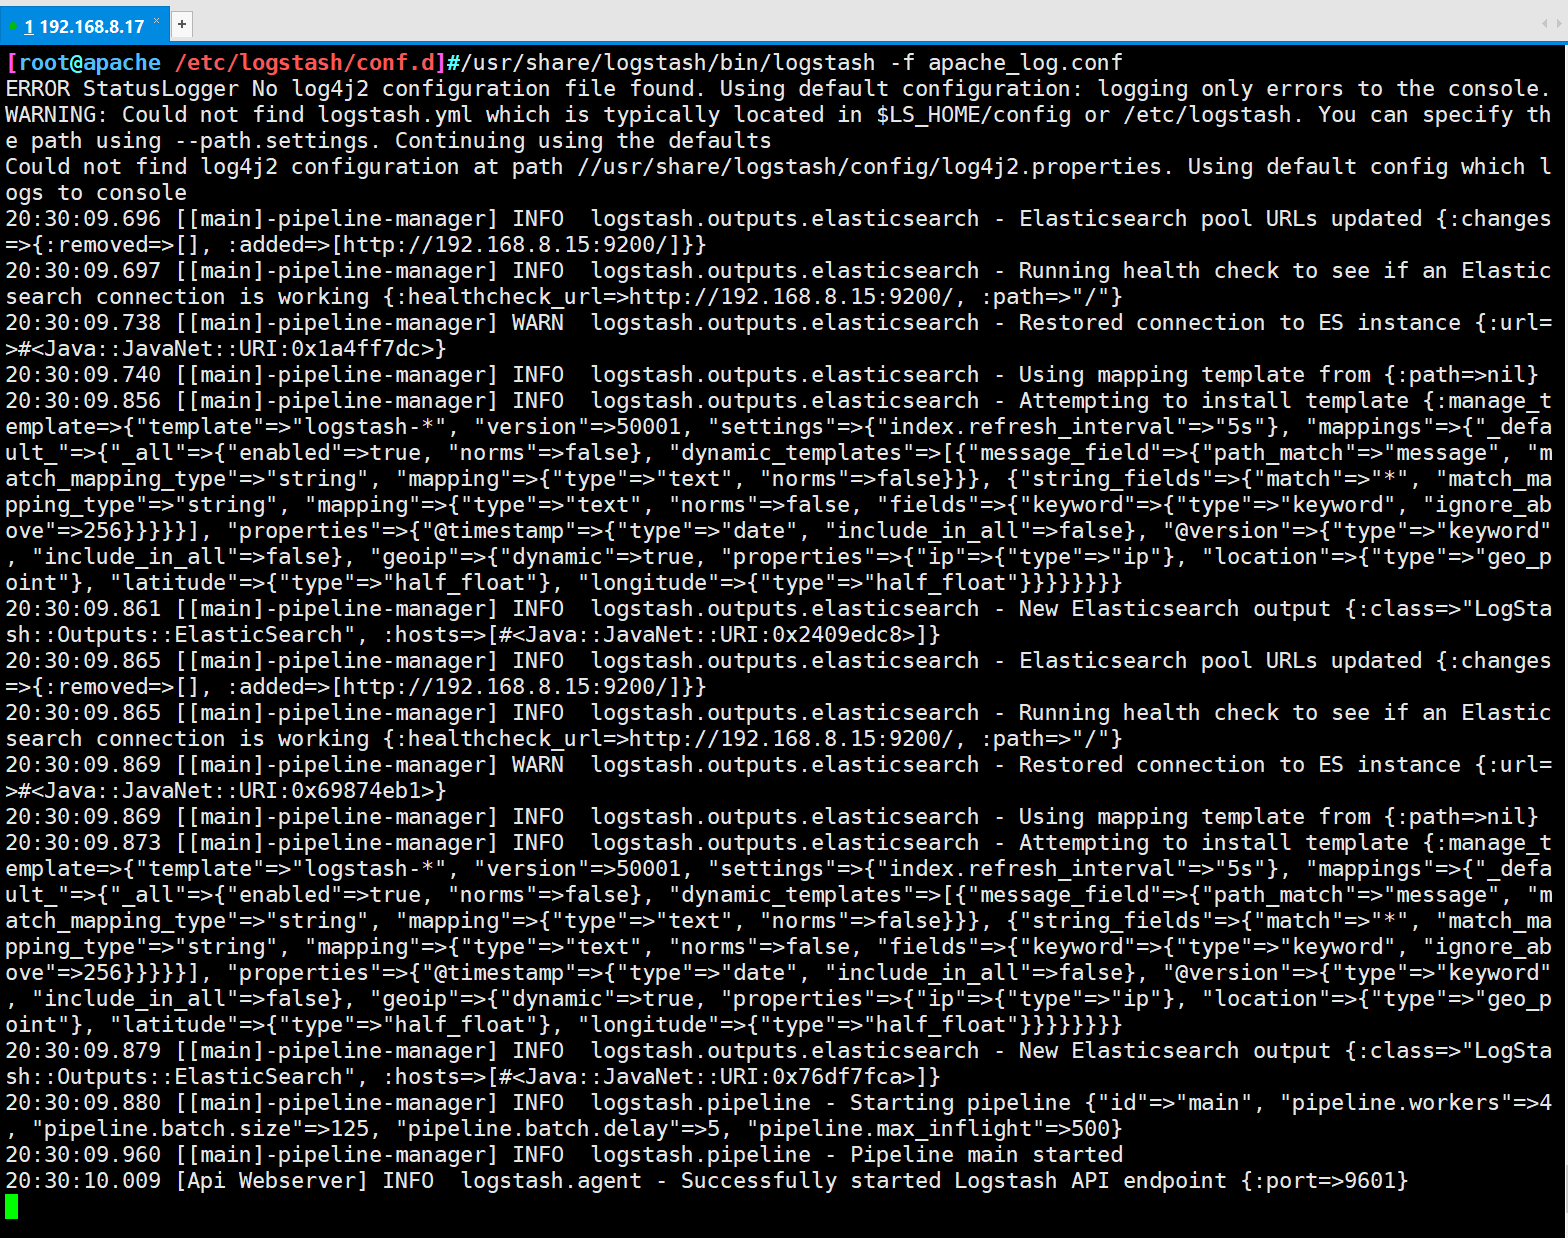
/usr/share/logstash/bin/logstash -f apache_log.conf
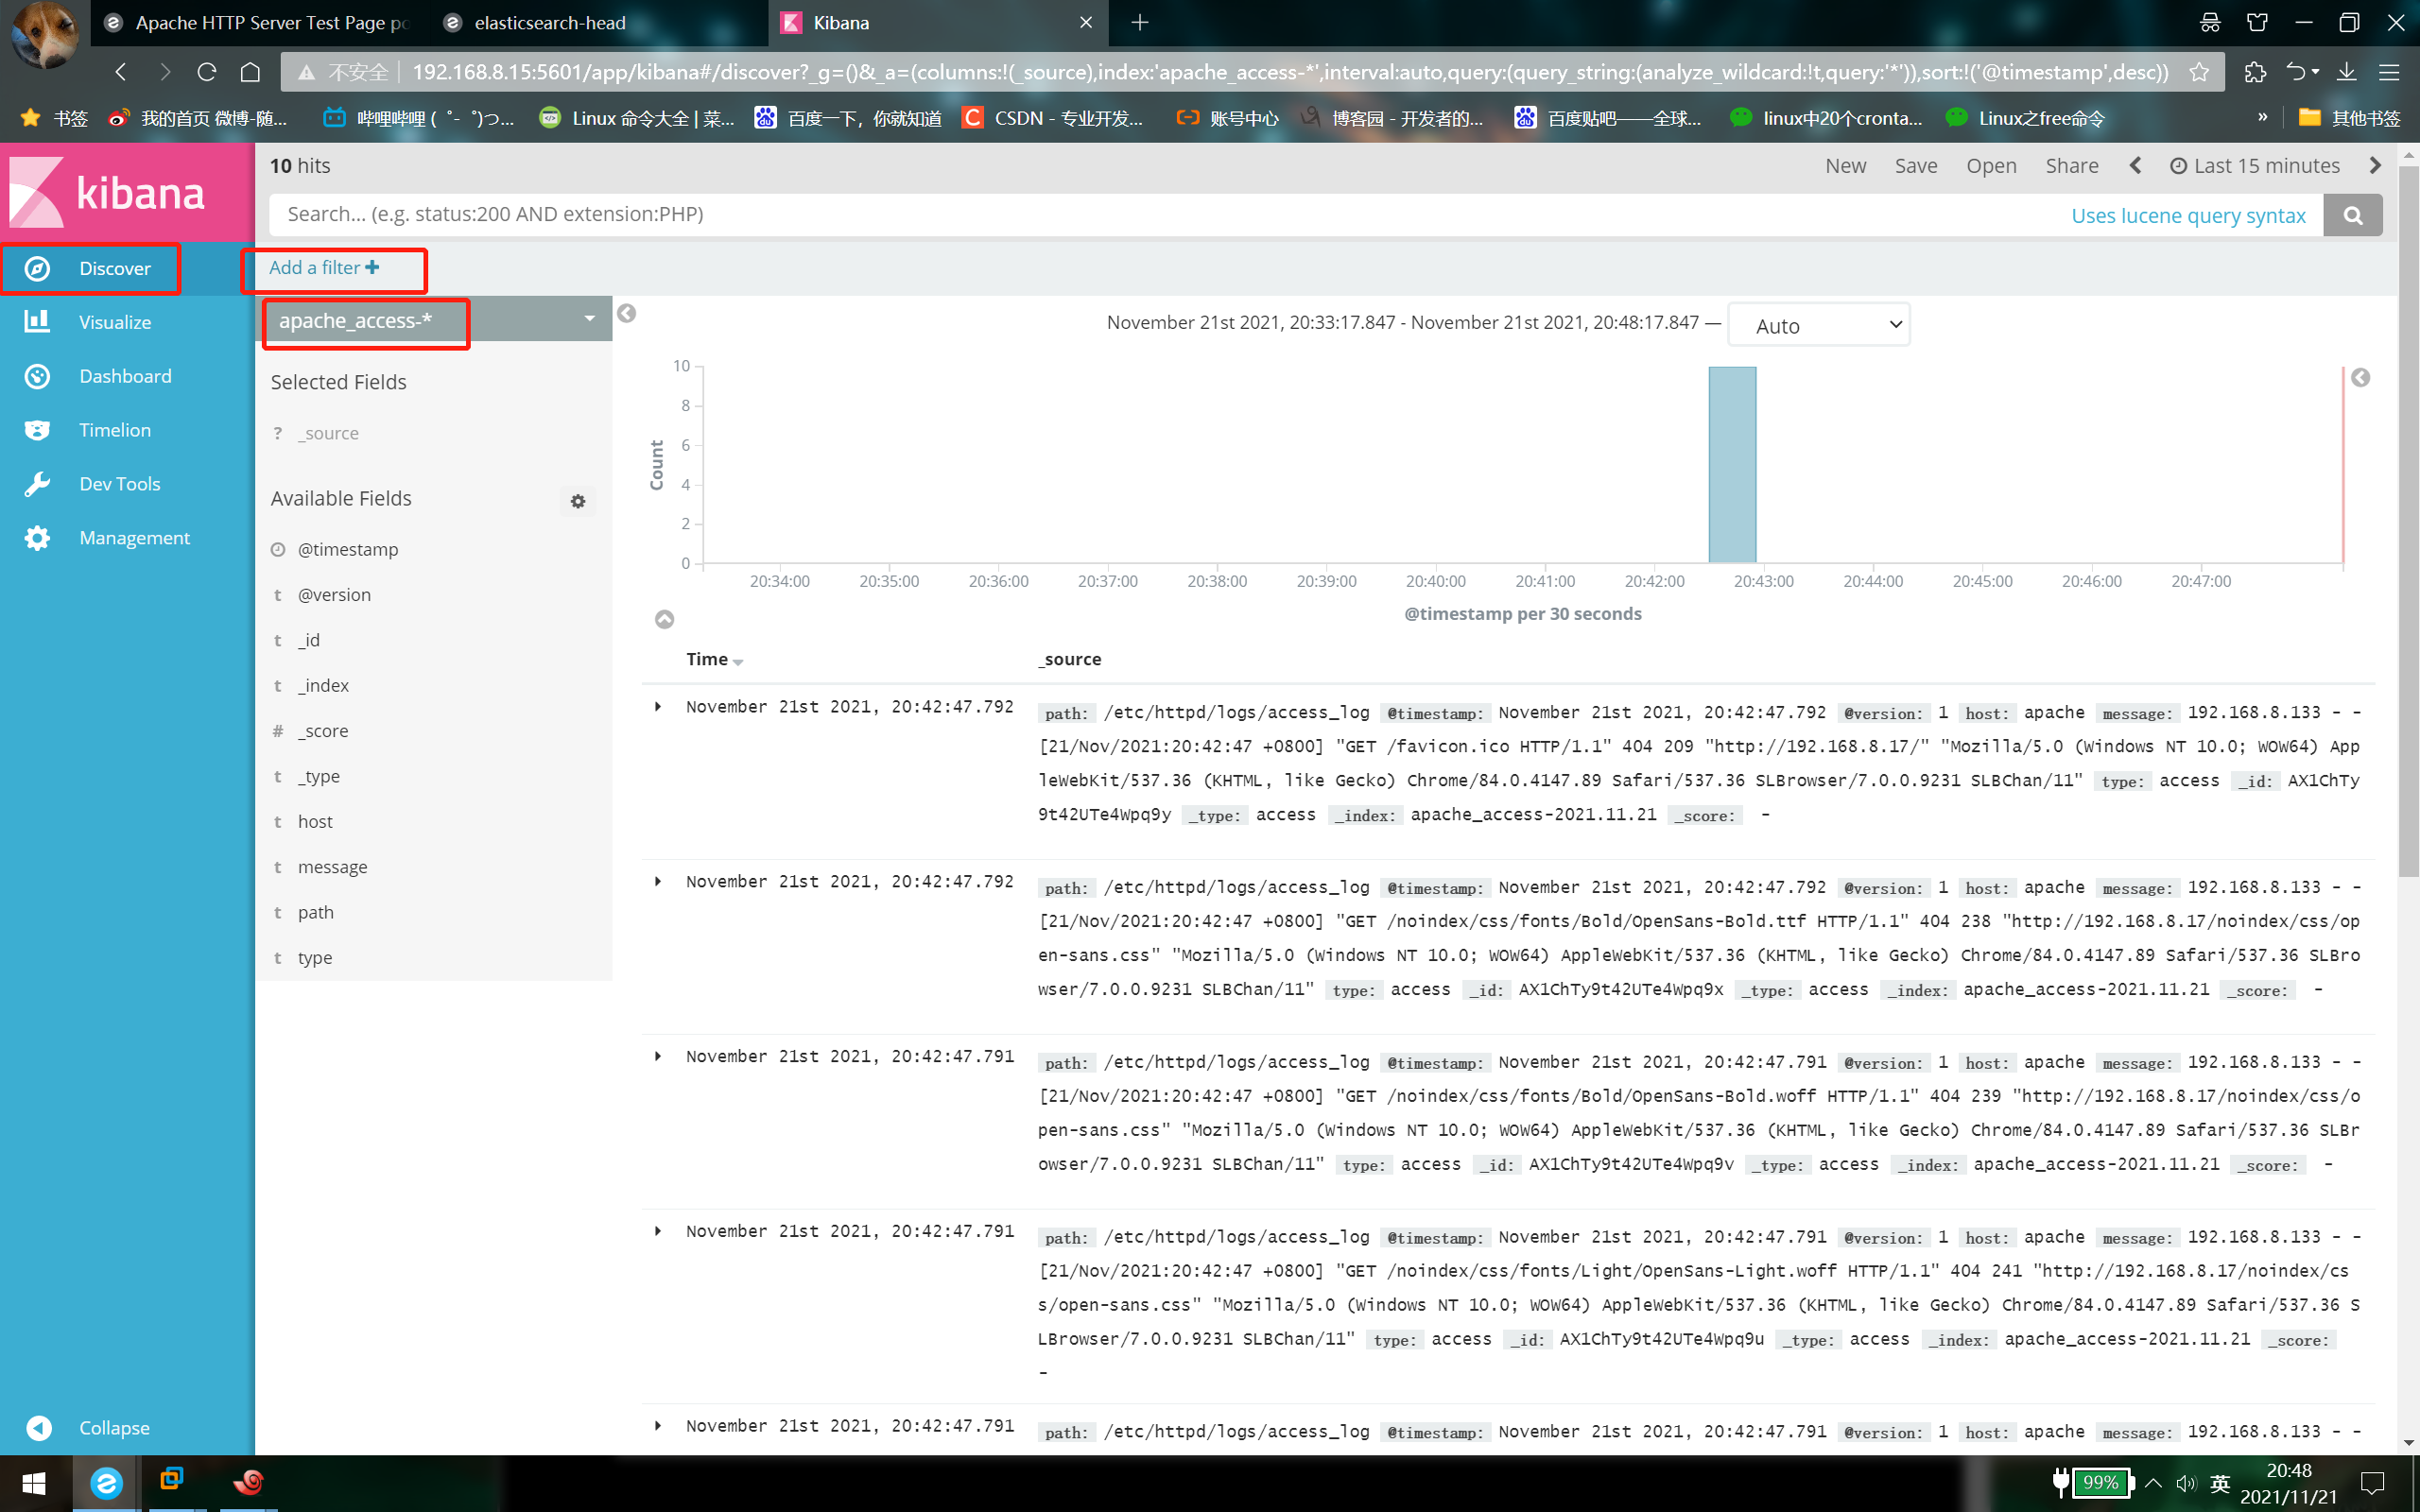
- Verification results
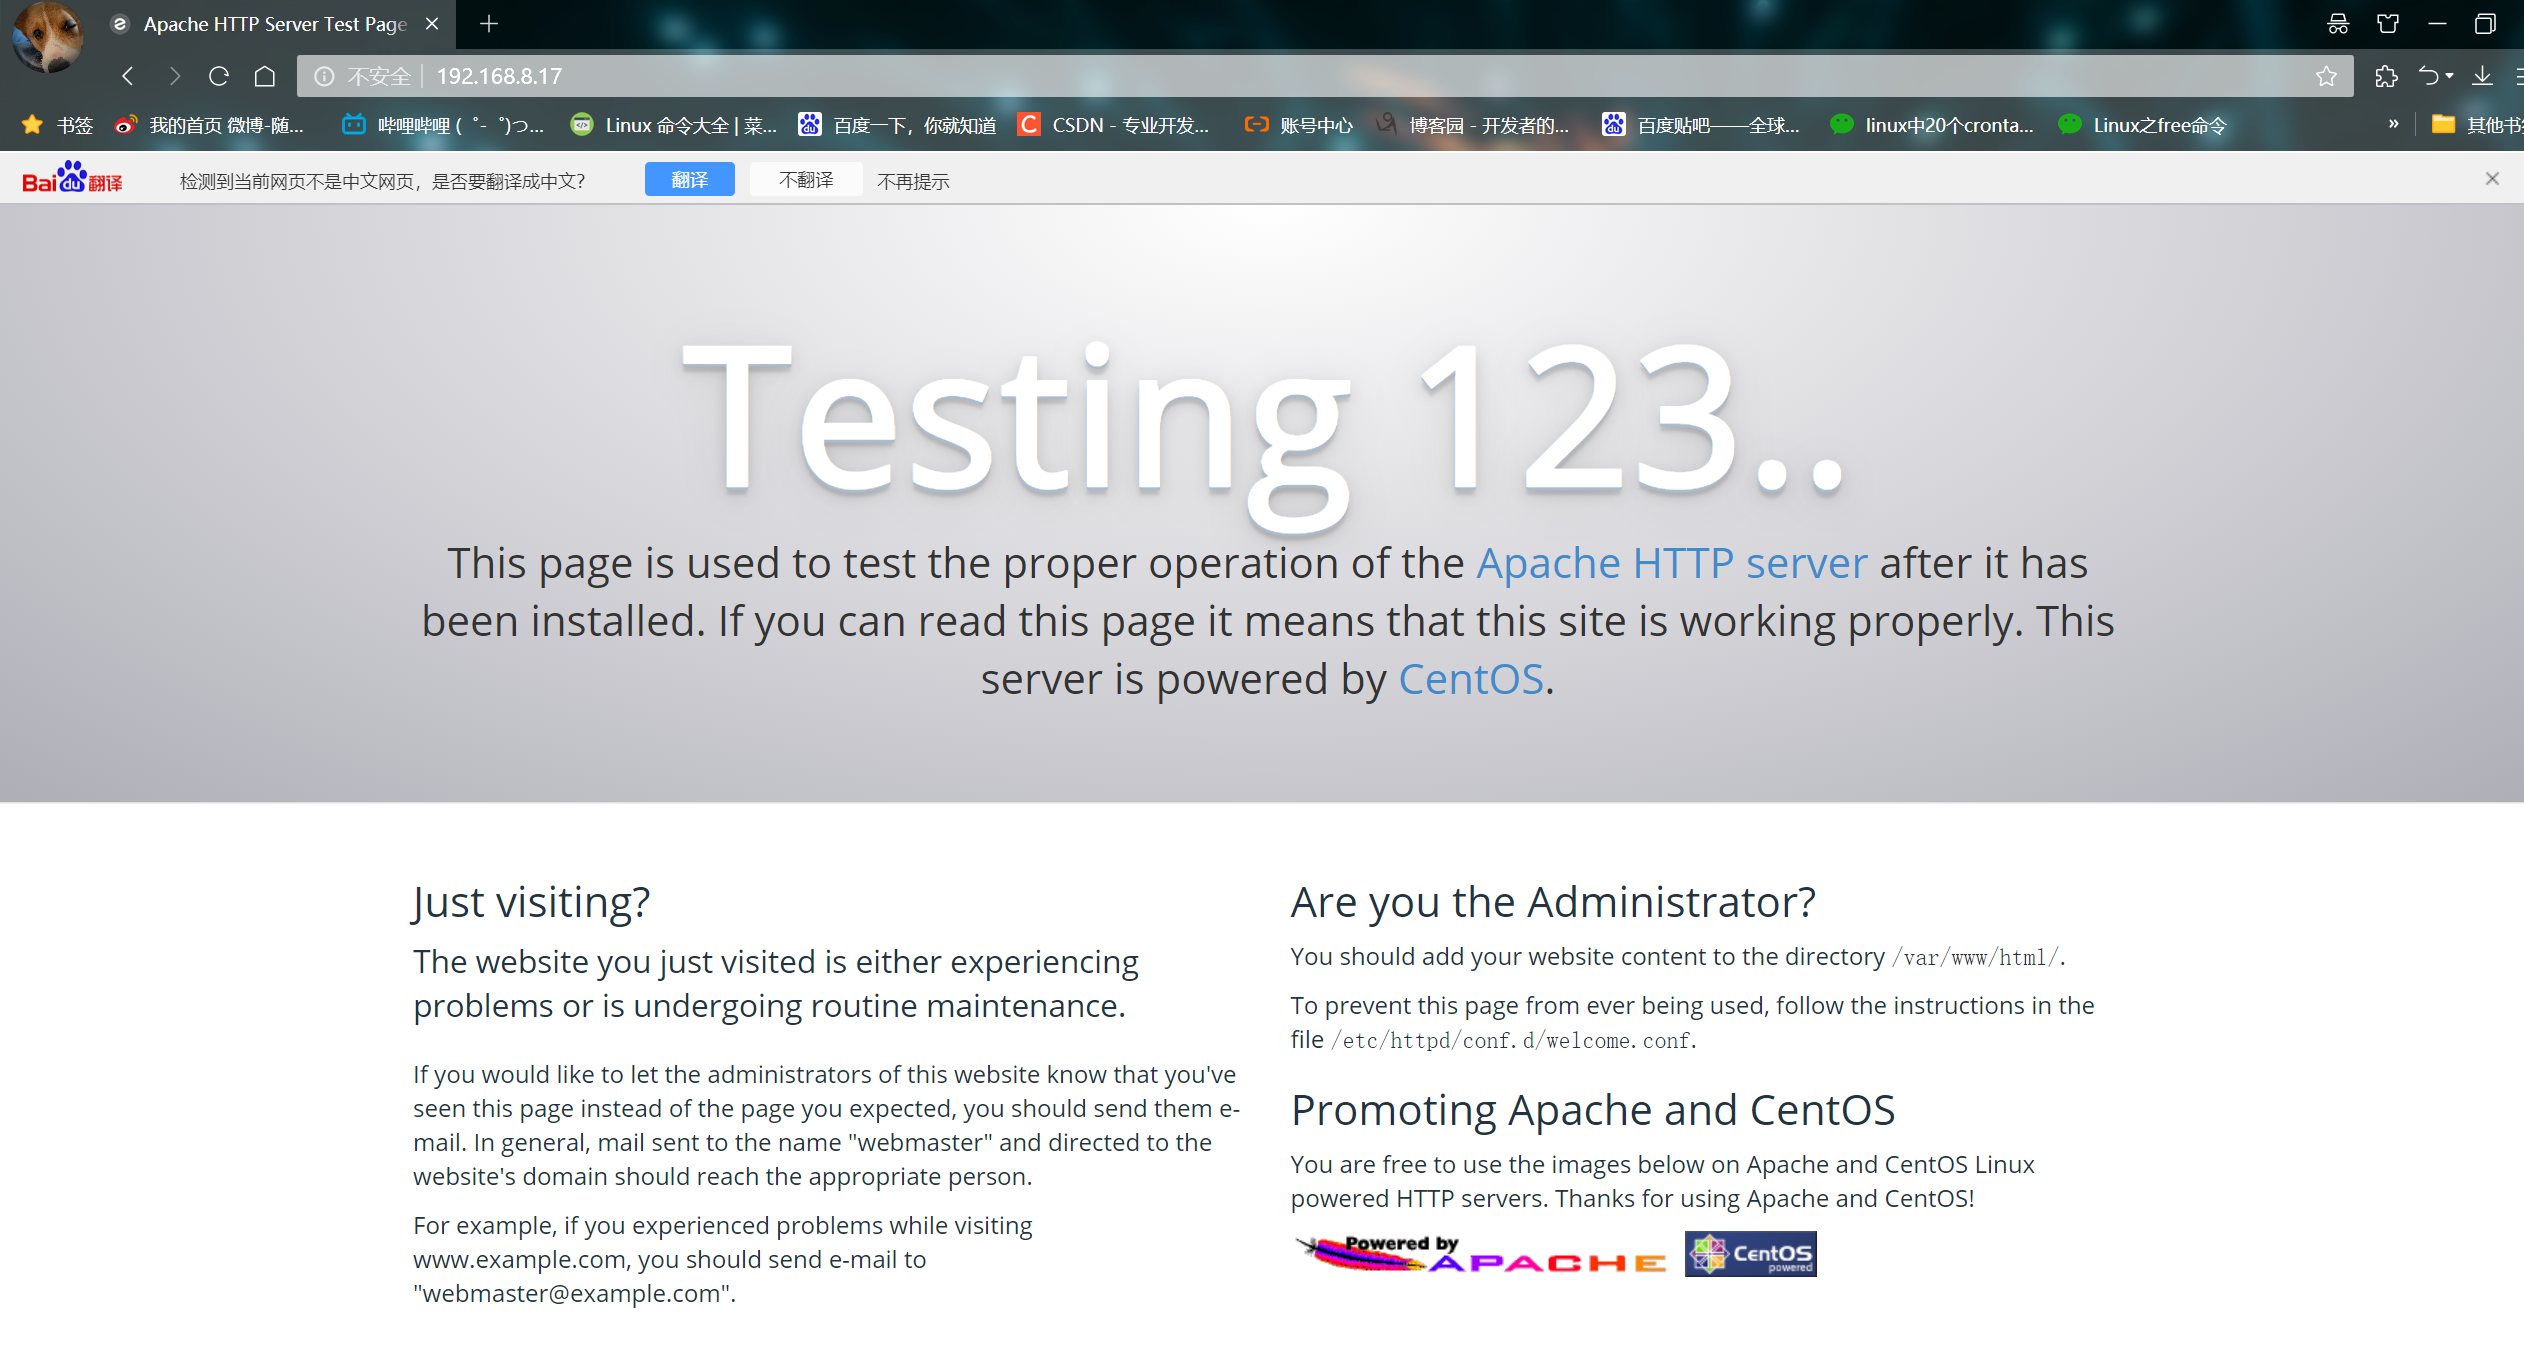
① Browser access http://192.168.8.17 , access apache
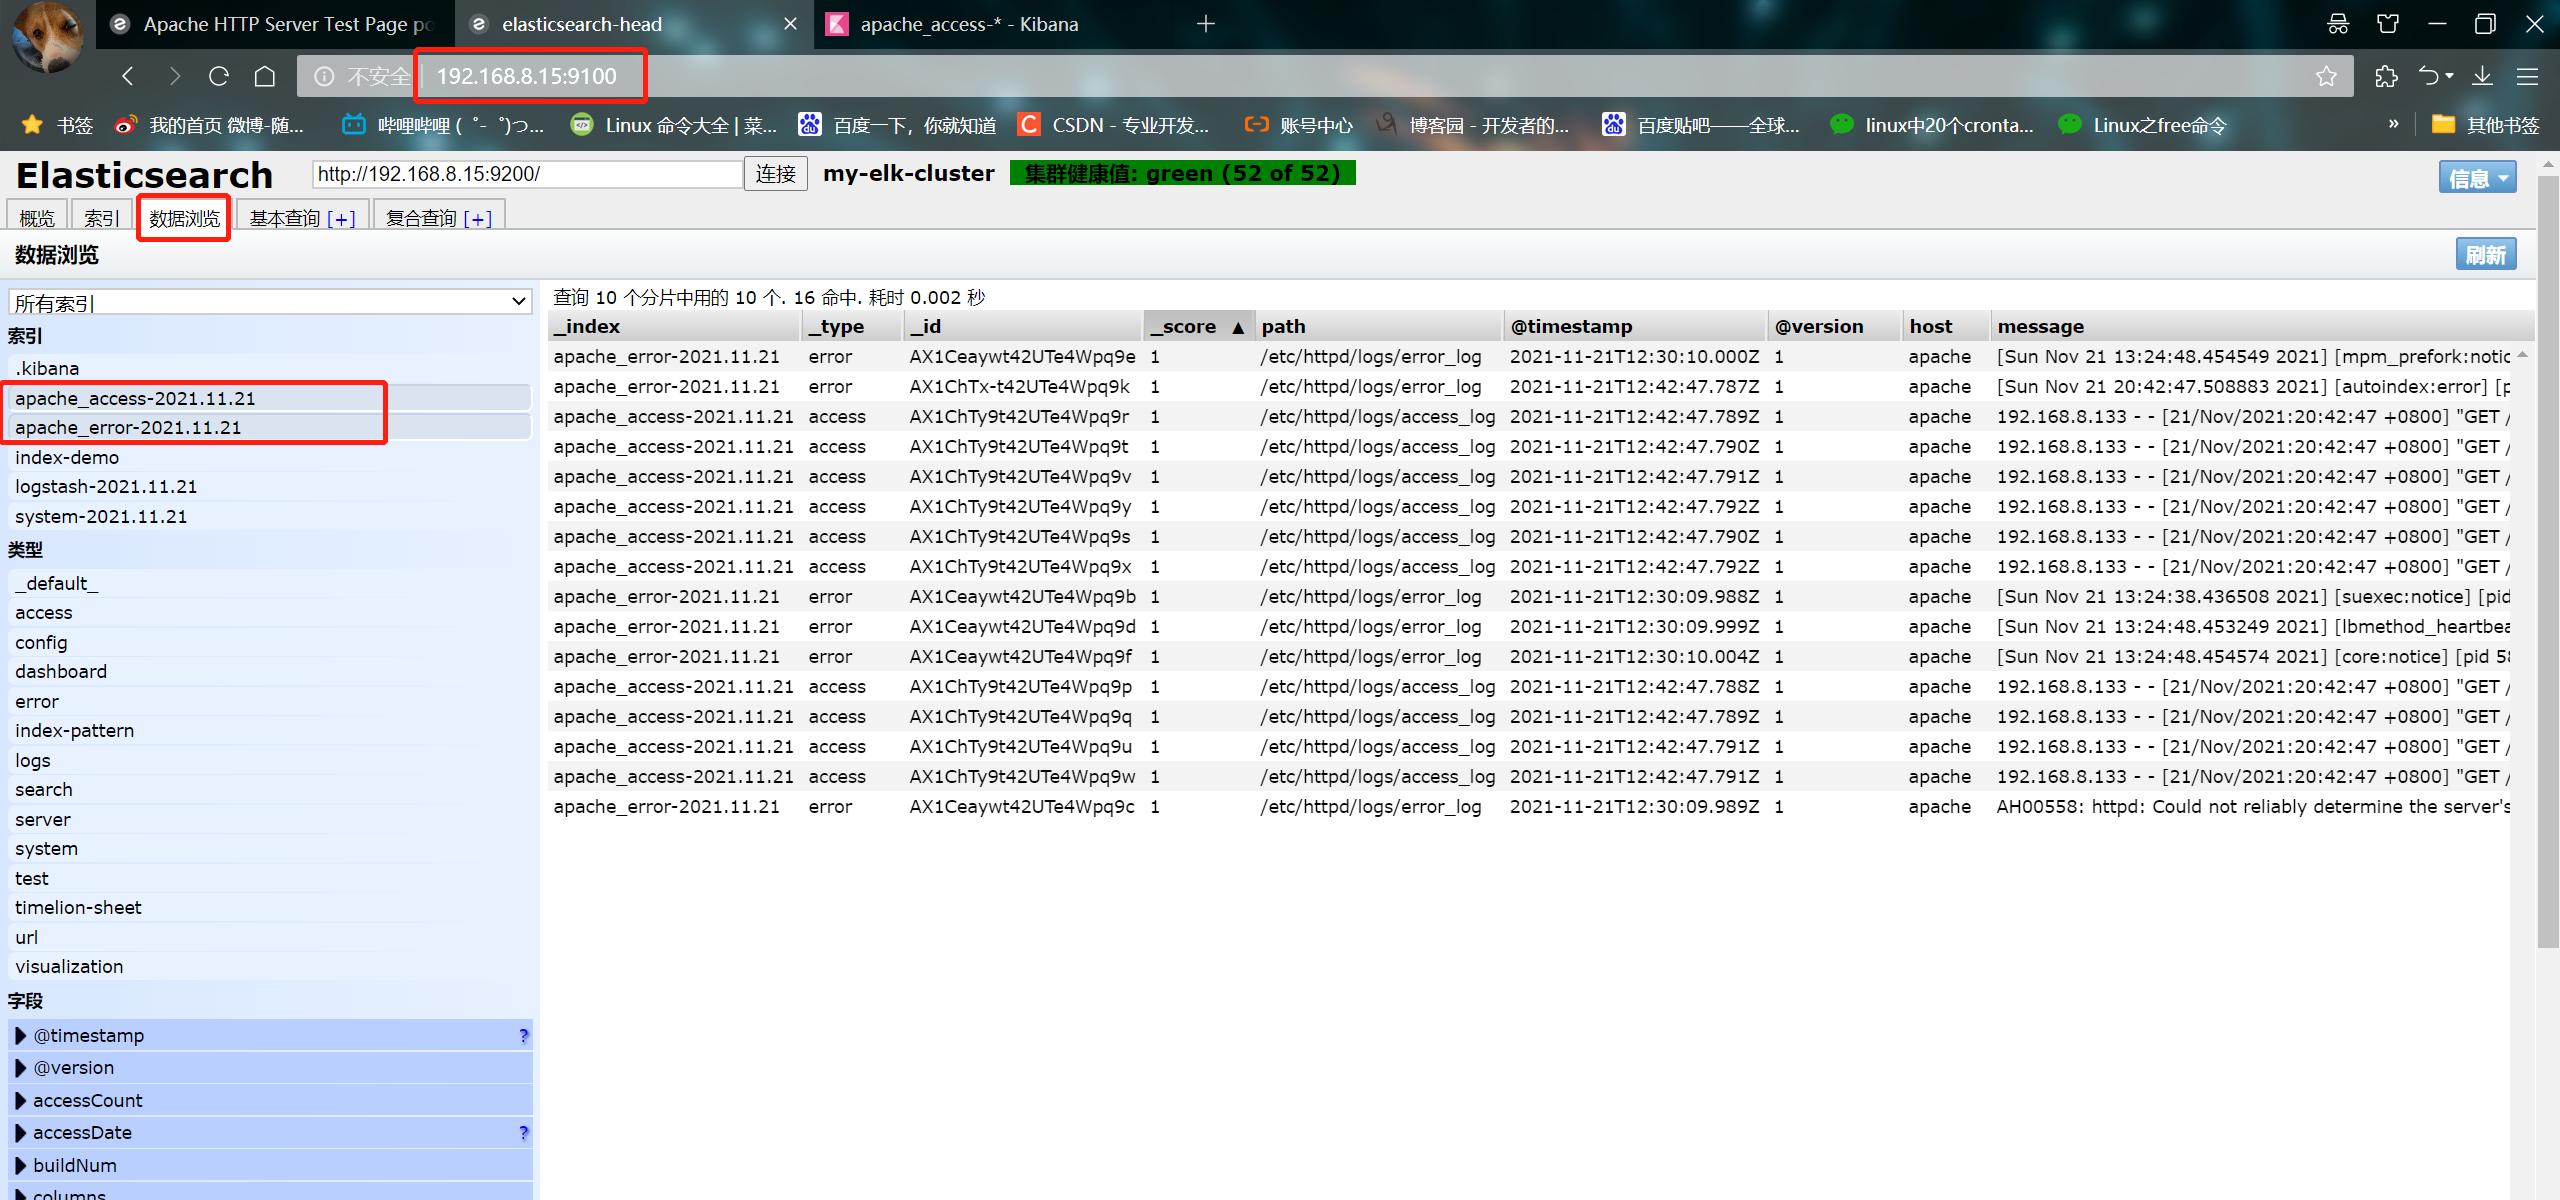
② Visit http://192.168.8.15:9100/ , view index information
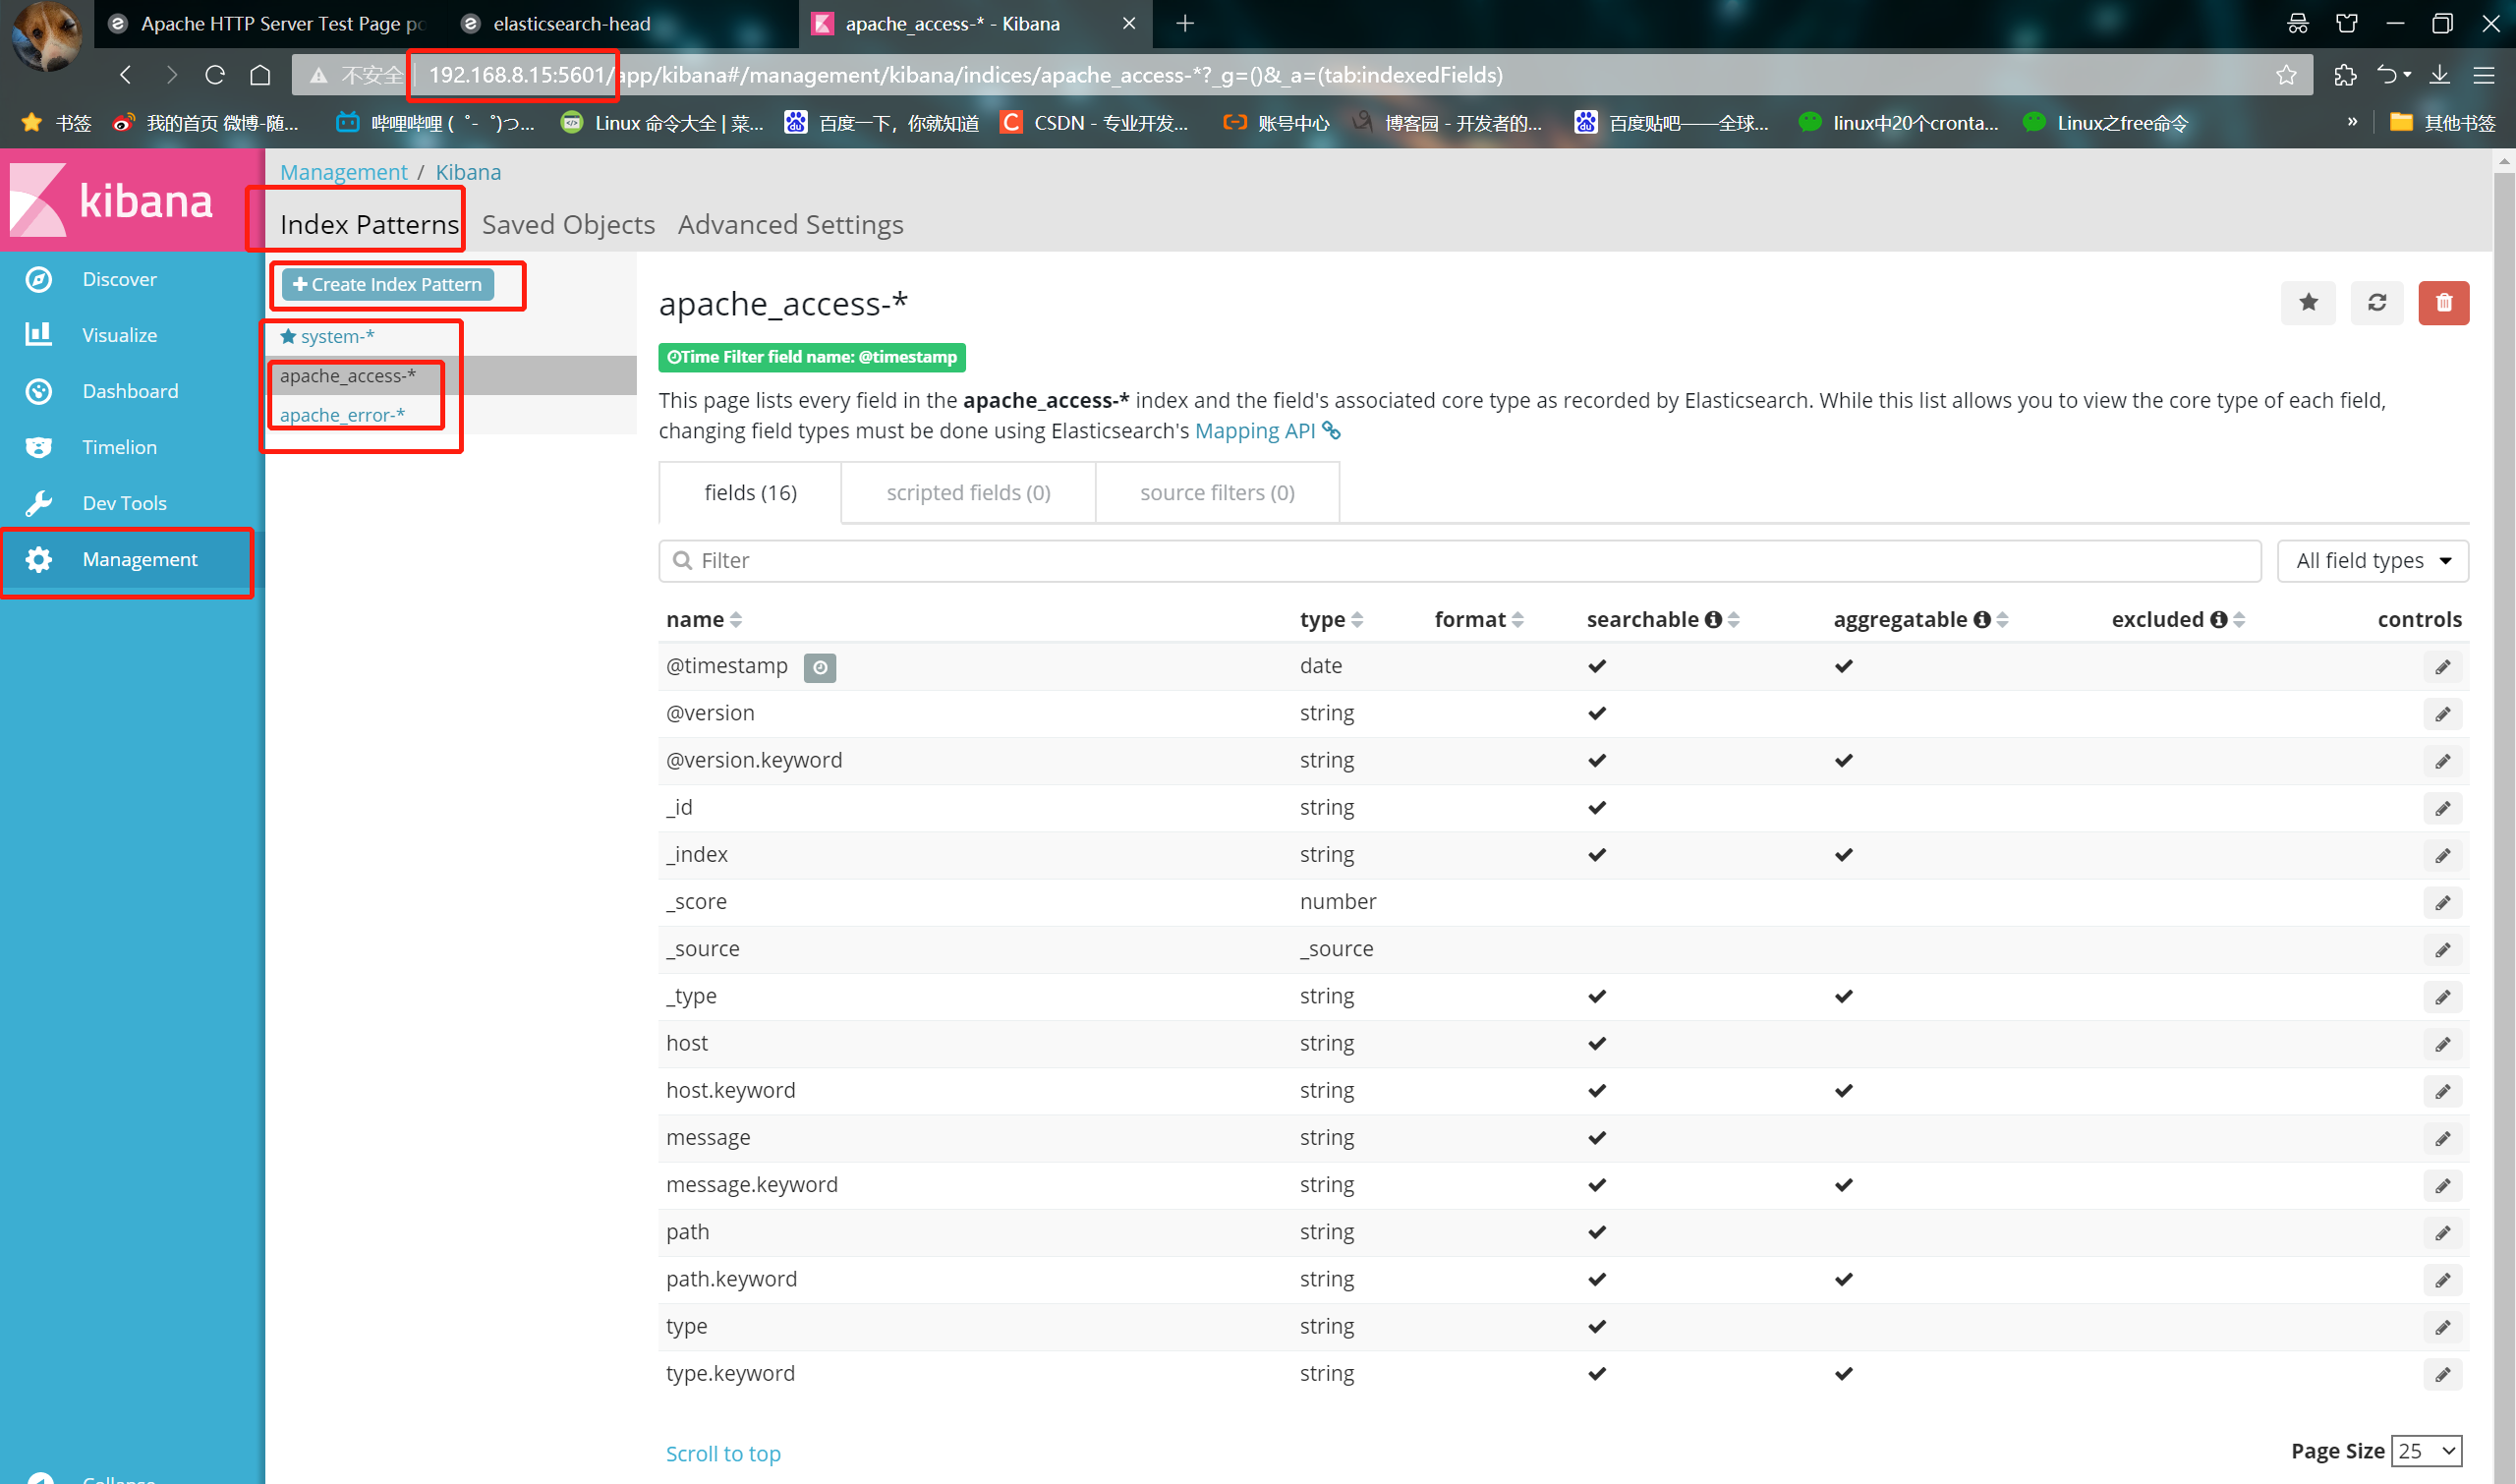
③ Visit http://192.168.8.15:5601 Click the management option index patterns create index pattern in the lower left corner to create "Apache" respectively_ Error - "and" Apache "_ Access - index of ''
2, Configure EFK log analysis system
1. Introduction to efk
-
EFK is the abbreviation of three open source software, ELasticsearch, FileBeat and Kibana. ELasticsearch is responsible for log analysis and storage, FileBeat is responsible for log collection and Kibana is responsible for interface display. They are used together, perfectly connected and efficiently meet the applications in many occasions. It is a mainstream log analysis system solution at present.
-
Differences between EFK and ELK:
The log collection component is replaced by Filebeat from Logstash, because Filebeat has two advantages over Logstash:
① Low intrusion, no need to modify the configuration of elasticsearch and kibana;
② High performance, IO occupancy is much smaller than logstash;
2. Environmental deployment
- Topological graph
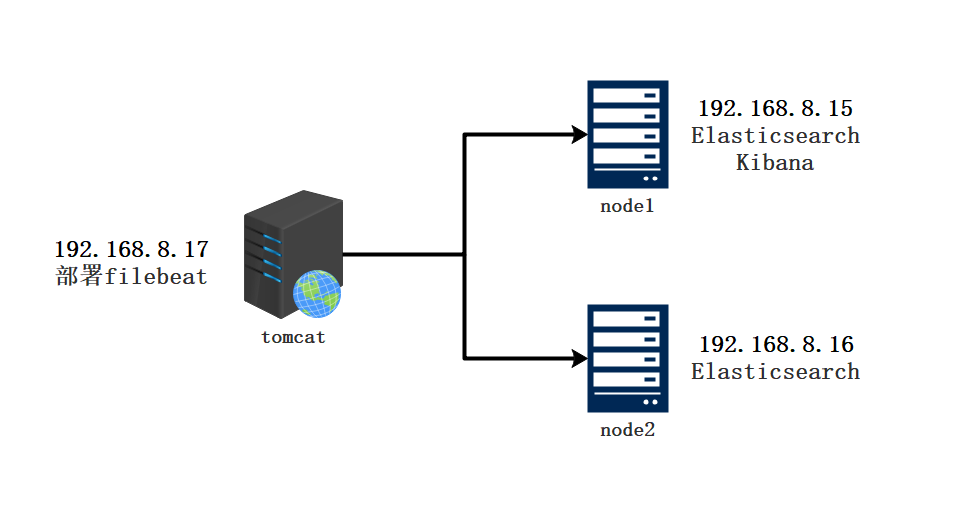
| host | operating system | IP address | Main software |
|---|---|---|---|
| Node1 | Centos7.4 | 192. 168.8.15 | Elasticsearch,Kibana |
| Node2 | Centos7.4 | 192.168.8.16 | Elasticsearch |
| tomcat | Centos7.4 | 192.168.8.17 | filebeat,tomcat |
systemctl stop firewalld
systemctl disable firewalld
setenforce 0
hostnamectl set-hostname node1
hostnamectl set-hostname node2
hostnamectl set-hostname tomcat
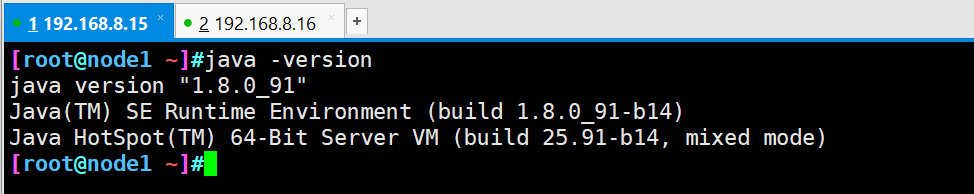
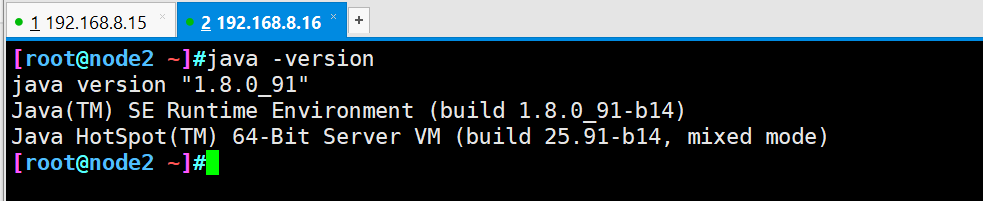
3. Install Elasticsearch (node1 and node2)
- node1 and node2 nodes operate the same
vim /etc/hosts
192.168.8.15 node1
192.168.8.16 node2
 upload jdk Compressed package to opt Directory
tar xzvf jdk-8u91-linux-x64.tar.gz -C /usr/local/
cd /usr/local/
mv jdk1.8.0_91 jdk
vim /etc/profile
#Add the following at the end of the line
export JAVA_HOME=/usr/local/jdk
export JRE_HOME=${JAVA_HOME}/jre
export CLASSPATH=.:${JAVA_HOME}/lib:${JRE_HOME}/lib
export PATH=${JAVA_HOME}/bin:$PATH

source /etc/profile
java -version
#Put the installation package in the opt directory and unpack it
cd /opt/
rpm -ivh elasticsearch-5.5.1\(1\).rpm
#Load system services
systemctl daemon-reload
systemctl enable elasticsearch.service
#Backup profile
cd /etc/elasticsearch/
cp elasticsearch.yml elasticsearch.yml.bak
#Modify master profile
vim elasticsearch.yml
17 that 's ok	cluster.name: my-elk-cluster							#Cluster name
23 that 's ok	node.name: node1										#Node name
33 that 's ok	path.data: /data/elk_data								#Data storage path
37 that 's ok	path.logs: /var/log/elasticsearch/						#Log storage path
43 that 's ok	bootstrap.memory_lock: false							#Do not lock the memory at startup (front-end cache, related to IOPS performance test method and read / write times per second)
55 that 's ok	network.host: 0.0.0.0									#Provides the IP address of the service binding. 0.0.0.0 represents all addresses
59 that 's ok	http.port: 9200											#The listening port is 9200
68 that 's ok	discovery.zen.ping.unicast.hosts: ["node1", "node2"]	#Cluster discovery is implemented by unicast

#Check configuration
grep -v "^#" /etc/elasticsearch/elasticsearch.yml
-
The node2 node master configuration file needs to change the node name to node2
-
Create data storage path and authorize
mkdir -p /data/elk_data
chown elasticsearch:elasticsearch /data/elk_data/
- Open service and view
systemctl start elasticsearch.service
netstat -antp | grep 9200
- View the node information and open it with the host browser http://192.168.8.15:9200
- Check the health and status of the cluster
Browser open
http://192.168.8.15:9200/_cluster/health?pretty
http://192.168.8.15:9200/_cluster/state?pretty
4. Install the elasticsearch head plug-in
The way to view clusters can be optimized by installing plug-ins
- ① Compile and install node component dependent packages
#Transfer the software package to this directory
cd /opt
yum install -y gcc gcc-c++.x86_64 ++ make

tar zxvf node-v8.2.1.tar.gz
cd node-v8.2.1/
./configure
make -j 4 && make install
- ② Installing phantomjs (front-end frame)
#The software package is transferred to the src directory
cd /usr/local/src/
tar jxvf phantomjs-2.1.1-linux-x86_64.tar.bz2
cd phantomjs-2.1.1-linux-x86_64/bin
cp phantomjs /usr/local/bin
- ③ Install elasticsearch head (data visualization tool)
#Transfer the software package to the src directory
cd /usr/local/src/
tar zxvf elasticsearch-head.tar.gz
cd elasticsearch-head/
npm install
- ④ Modify master profile
cd

vim /etc/elasticsearch/elasticsearch.yml
#Add configuration at the end
http.cors.enabled: true						#Enable cross domain access support. The default value is false
http.cors.allow-origin: "*"					#Allowed domain names and addresses for cross domain access

systemctl restart elasticsearch.service
- ⑤ Start elasticsearch head
cd /usr/local/src/elasticsearch-head/
npm run start &

netstat -lnupt |grep -E '9[1-2]00'
- Open test with browser
Open a browser to access http://192.168.8.15:9100/
Then enter in the column after elastic search http://192.168.8.15:9200 , click Connect
See if the cluster color is healthy green
node2 does the same
- Create an index on node1. The index name is index demo and the type is test. You can see the successful creation
curl -XPUT 'localhost:9200/index-demo/test/1?pretty&pretty' -H 'content-Type: application/json' -d '{"user":"sb","mesg":"hello world"}'
- The browser logs in to node1 to view the index information
You can see that the index is divided into 5 by default, and there is a copy
Click data browse and you will find that the index created on node1 is index demo and the type is test
5. Install and configure Tomcat
192.168.8.17 installing tomcat on
Before installing Tomcat, you must first install JDK, because JDK is a software package development tool of java language, which includes JVM (java virtual machine). The compiled java source program can form java bytecode after compilation. As long as JDK is installed, these bytecode files can be interpreted by JVM, so as to ensure the cross platform of java.
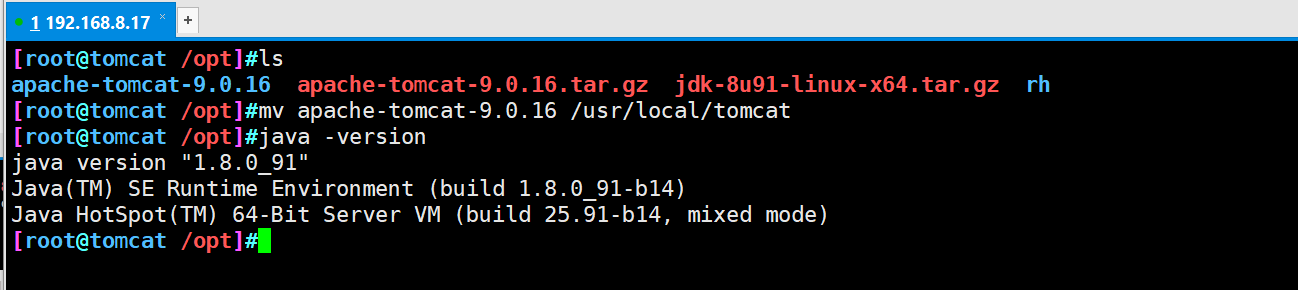
#The jdk and tomcat installation packages are placed in the opt directory
rpm -ivh jdk-8u201-linux-x64.rpm

vim /etc/profile.d/java.sh
export JAVA_HOME=/usr/java/jdk1.8.0_201-amd64
export CLASSPATH=.:$JAVA_HOME/lib/tools.jar:$JAVA_HOME/lib/dt.jar		#Location of executable
export PATH=$JAVA_HOME/bin:$PATH

source /etc/profile.d/java.sh
java -version
tar zxvf apache-tomcat-9.0.16.tar.gz					  	#Unpack
mv apache-tomcat-9.0.16 /usr/local/tomcat     		  		#Transfer package location and rename
- Create a soft connection and optimize the opening command for easy management
ln -s /usr/local/tomcat/bin/startup.sh /usr/local/bin/
ln -s /usr/local/tomcat/bin/shutdown.sh /usr/local/bin/
#Start tomcat service
startup.sh
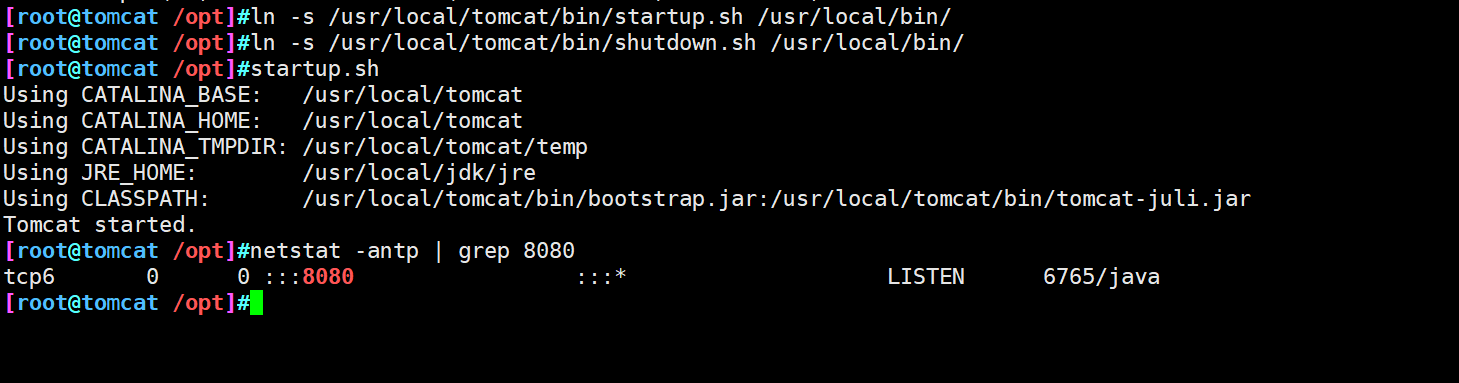
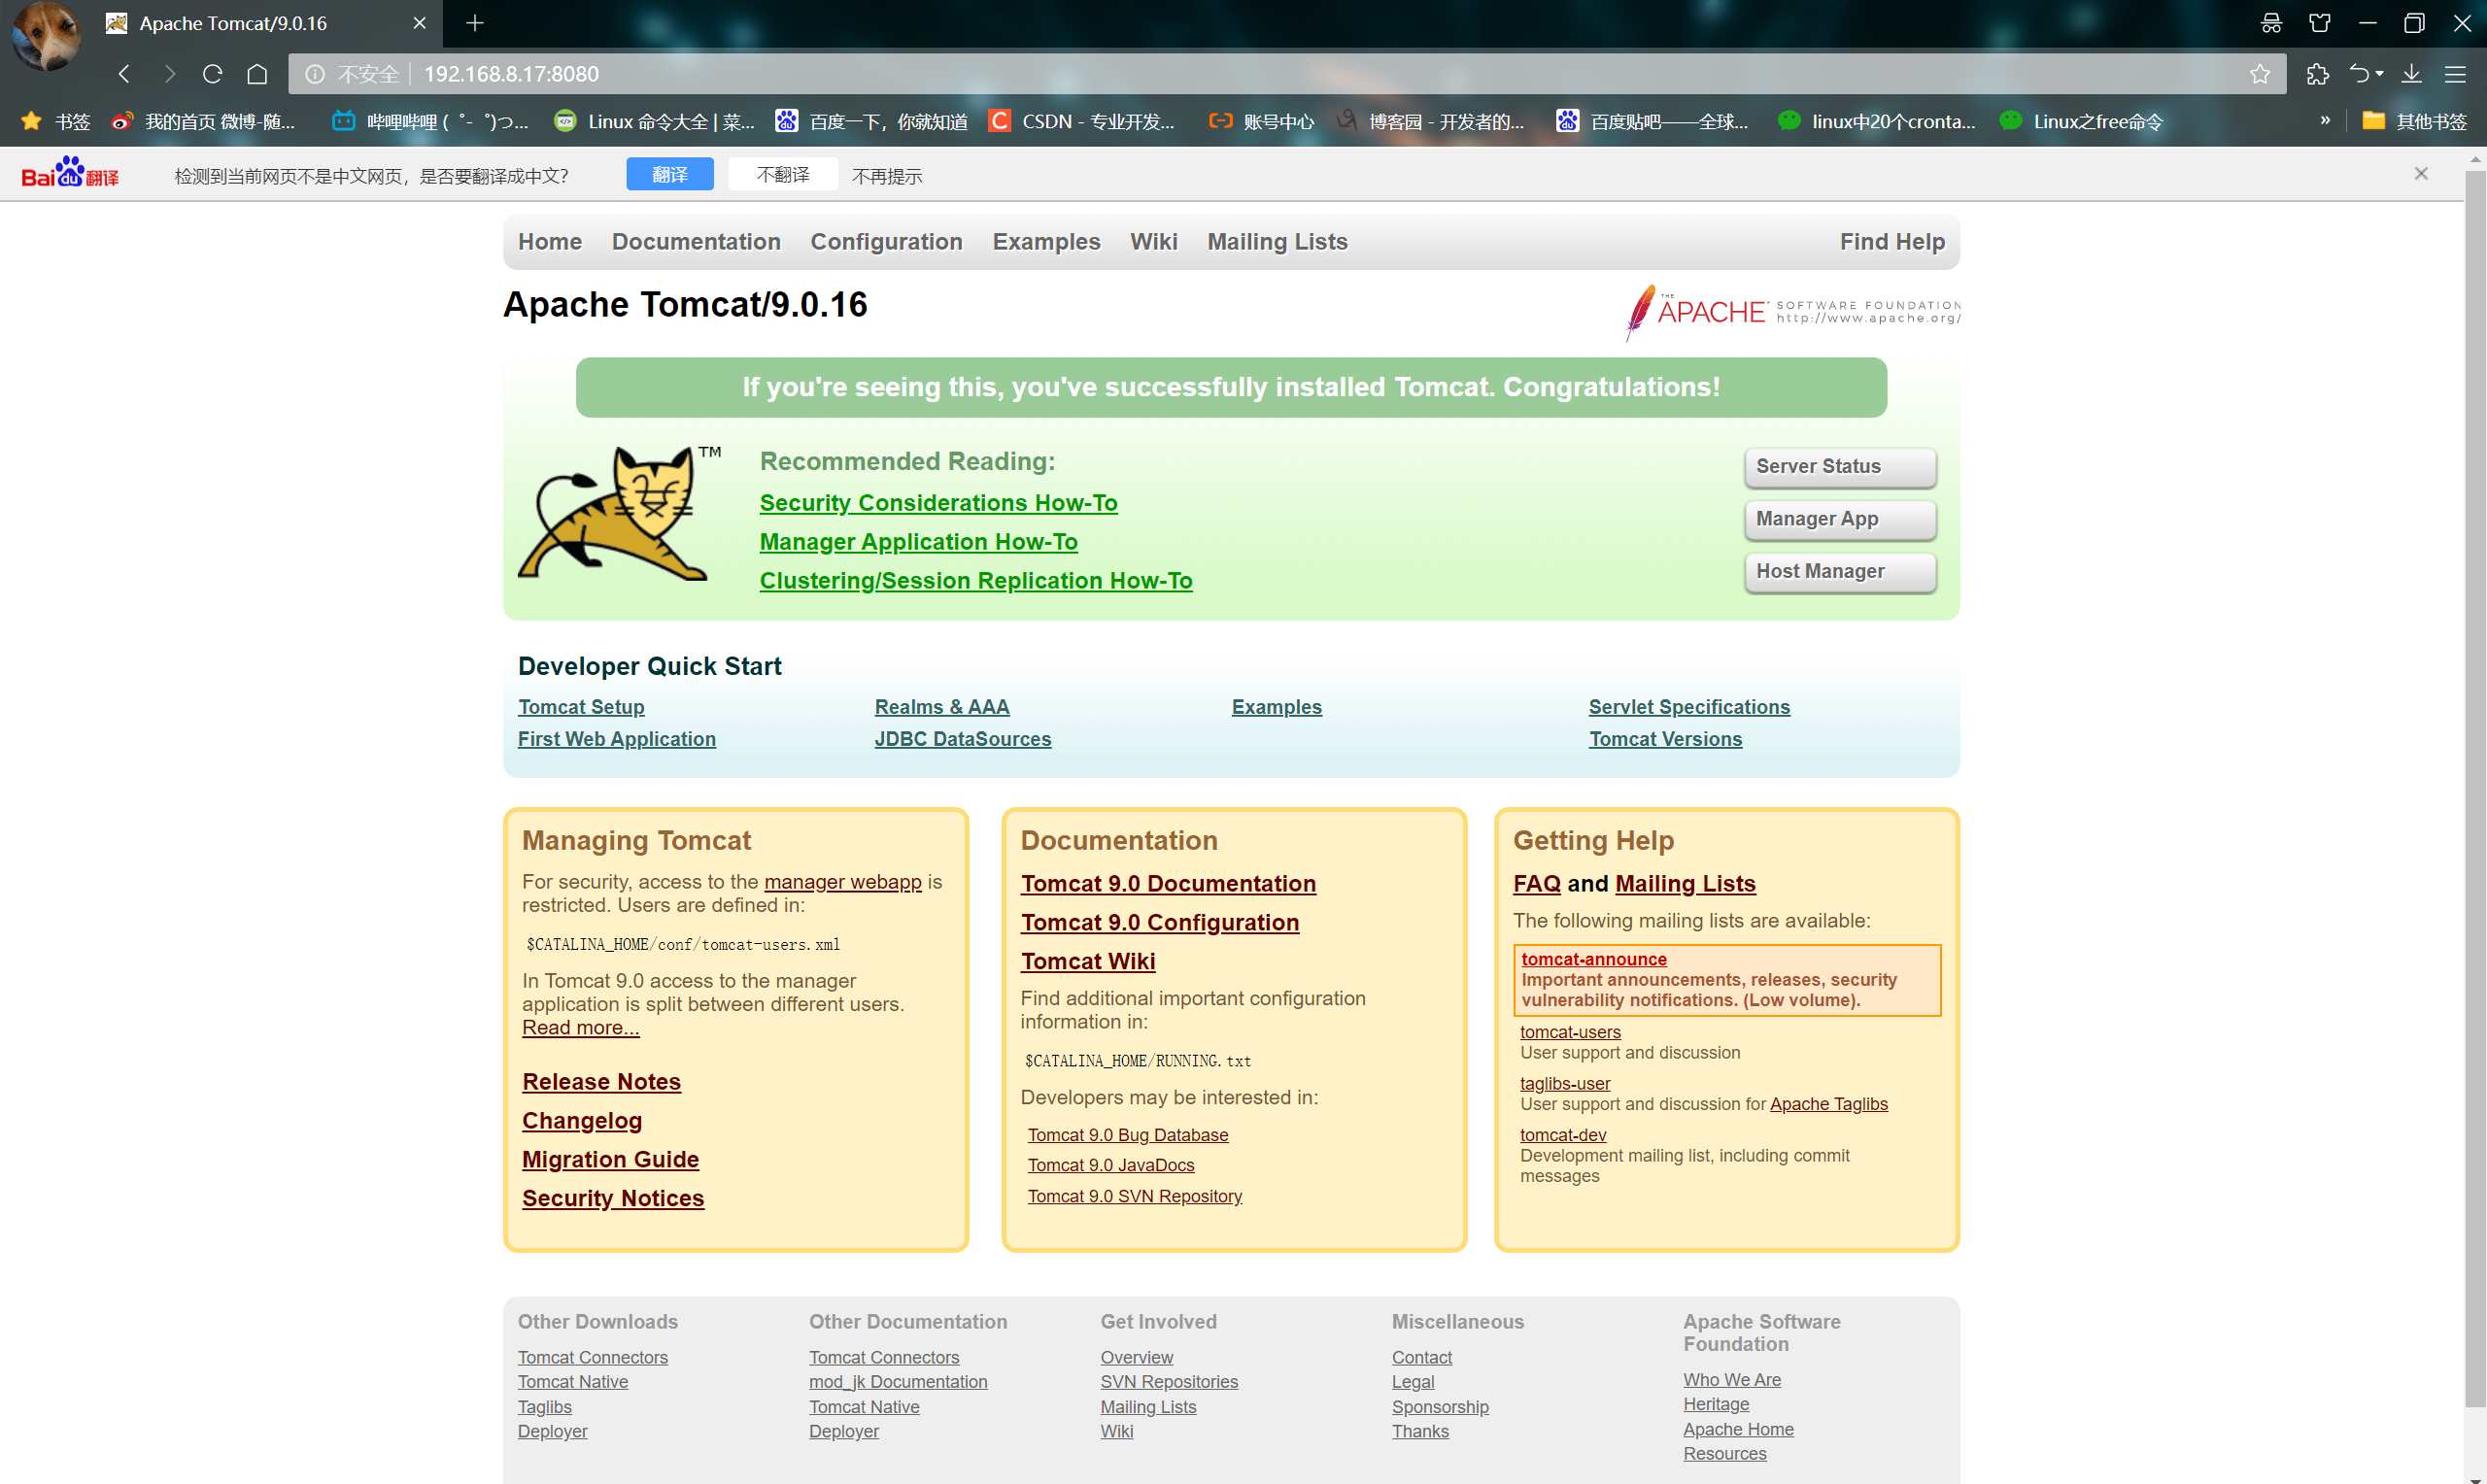
- Use the browser to access and check whether the service is started successfully
6. Install filebeat
#The installation package is placed in the opt directory
cd /opt
rpm -ivh filebeat-5.5.1-x86_64.rpm

cd /etc/filebeat/
cp filebeat.yml filebeat.yml.bak					#Backup configuration files
vim /etc/filebeat/filebeat.yml						#Edit profile
12 filebeat.prospectors:
18 - input_type: log
21   paths:
22     - /usr/local/tomcat/logs/*.log
81 output.elasticsearch:
83 hosts: ["192.168.8.15:9200"]
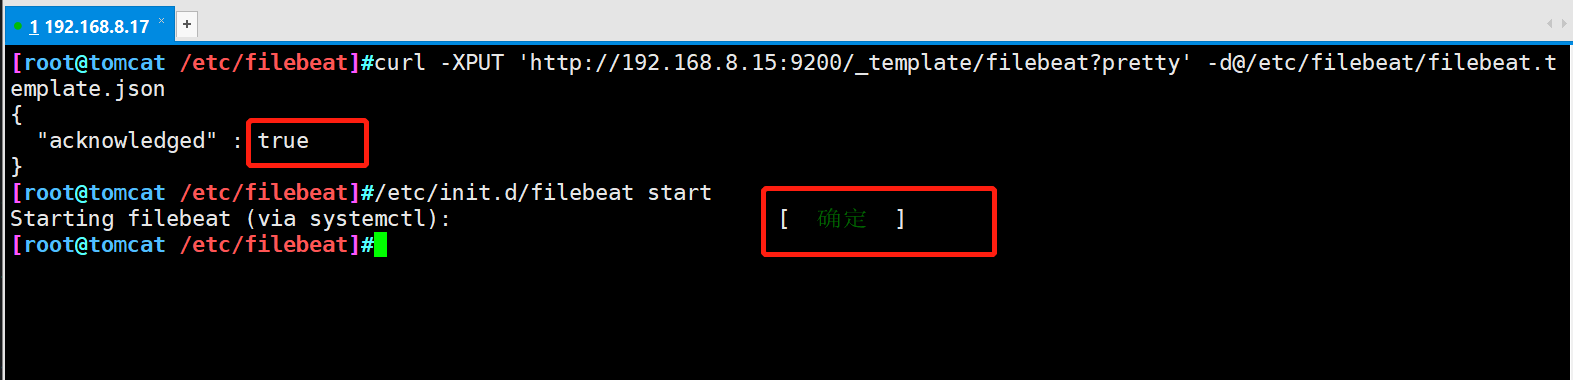
#Manually load the ES index template, and true will be returned if successful
curl -XPUT 'http://192.168.8.15:9200/_template/filebeat?pretty' -d@/etc/filebeat/file
beat.template.json

#Start filebeat
/etc/init.d/filebeat start
- Access with browser http://192.168.8.15:9100/ View index information
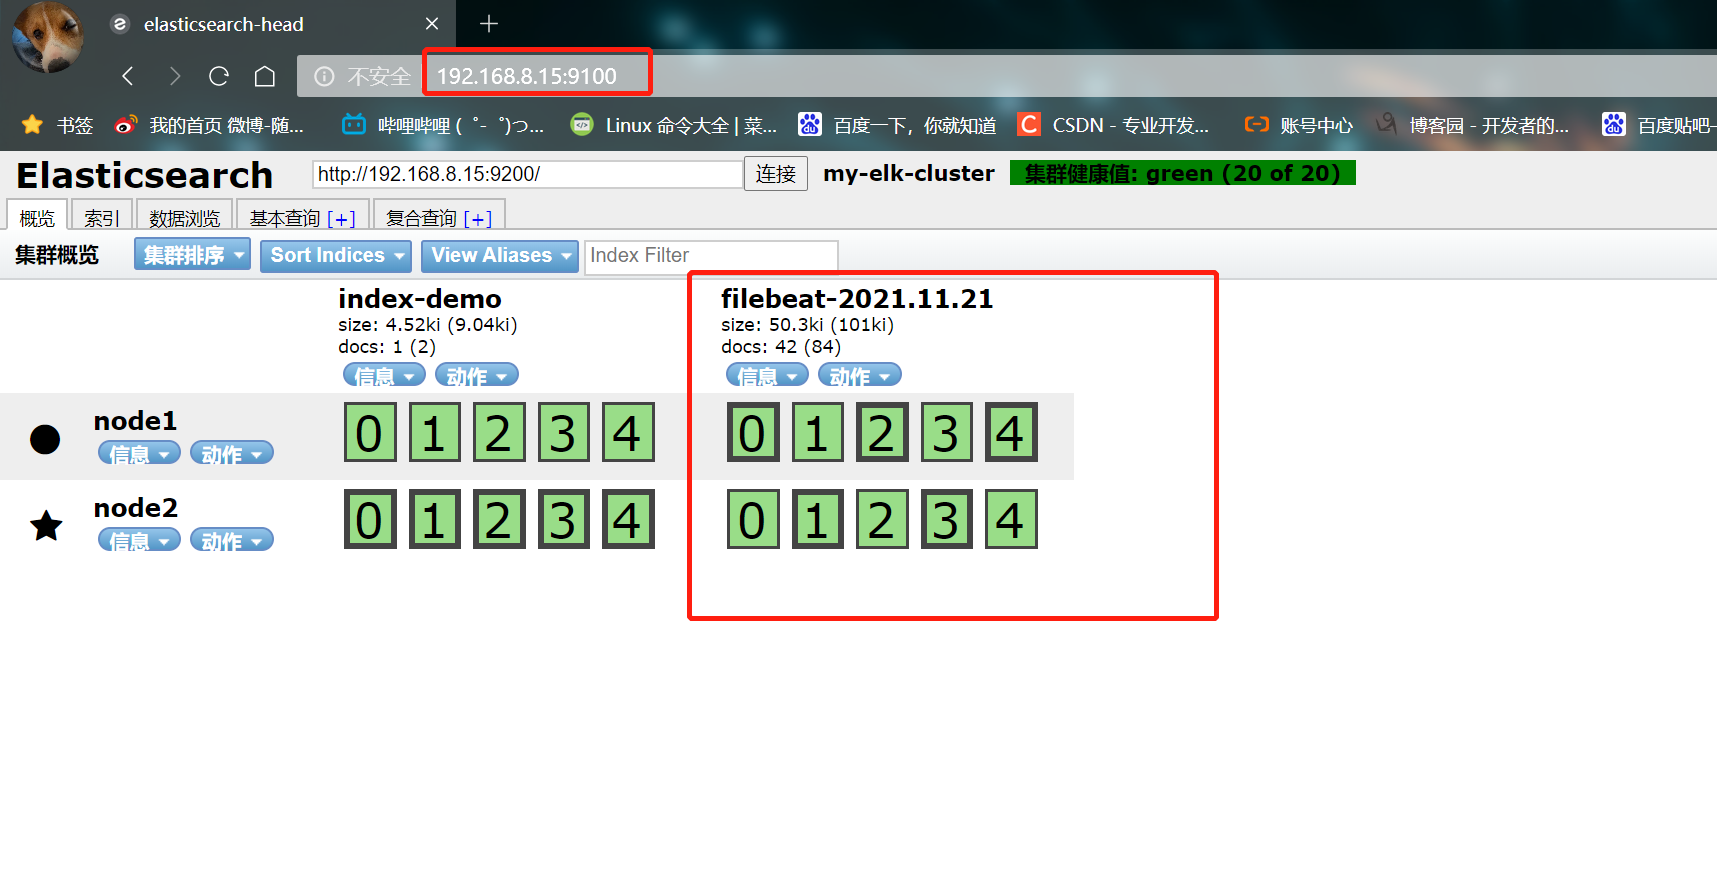
7. Install kibana (node1)
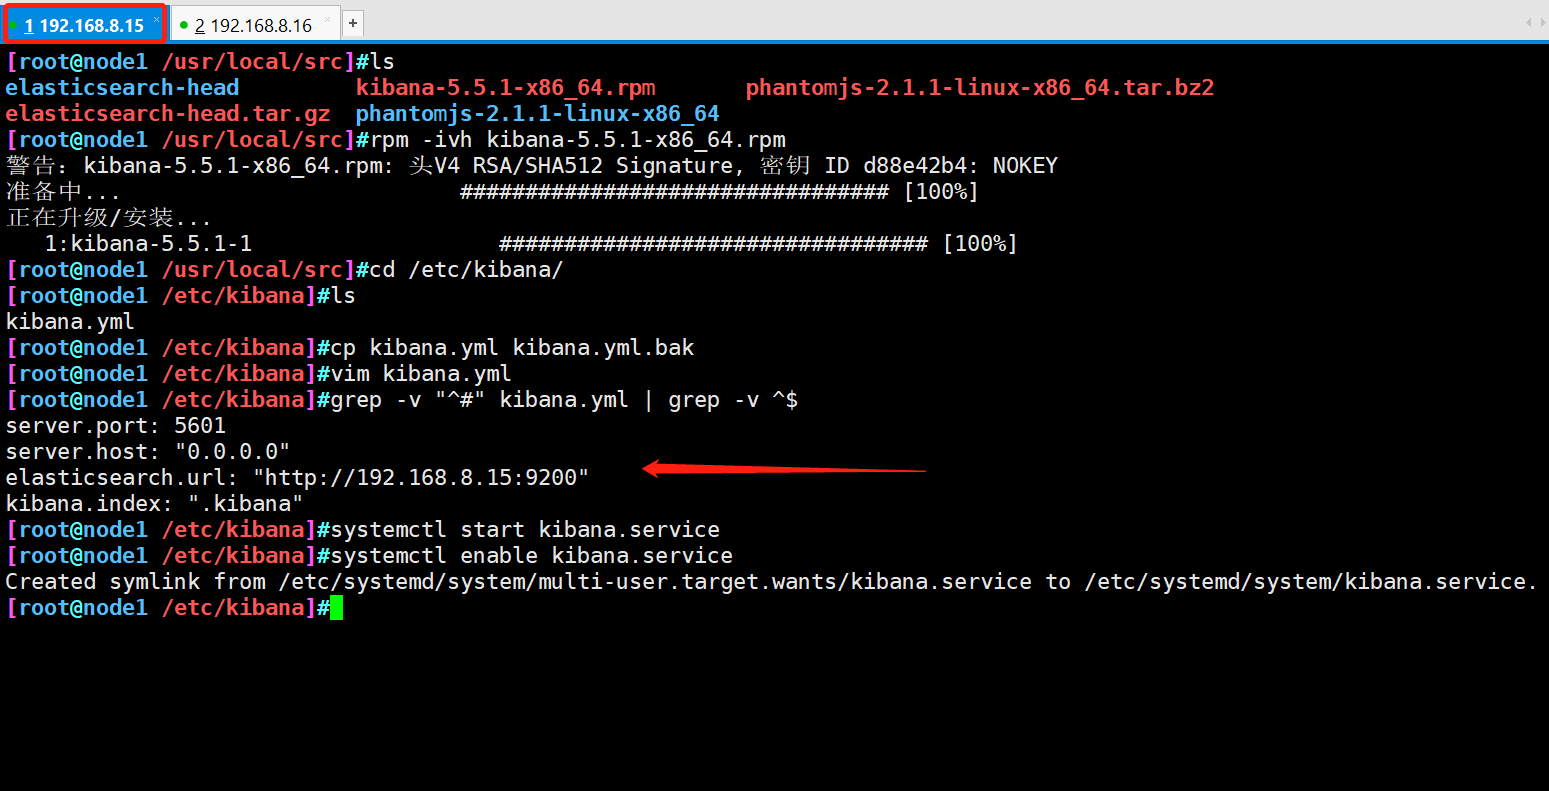
#The software package is placed in the src directory
cd /usr/local/src/
rpm -ivh kibana-5.5.1-x86_64.rpm

cd /etc/kibana/
cp kibana.yml kibana.yml.bak

vim kibana.yml
2 that 's ok	server.port: 5601                						#kibana open port
7 that 's ok	server.host: "0.0.0.0"           						#Address where kibana listens
21 that 's ok	elasticsearch.url: "http://192.168.3.12:9200" 		# Contact elasticsearch
30 that 's ok	kibana.index: ".kibana"								#Add the. kibana index in elasticsearch


systemctl start kibana.service
systemctl enable kibana.service
8. Verification results
- Use the browser to access 192.168.8.15:5601
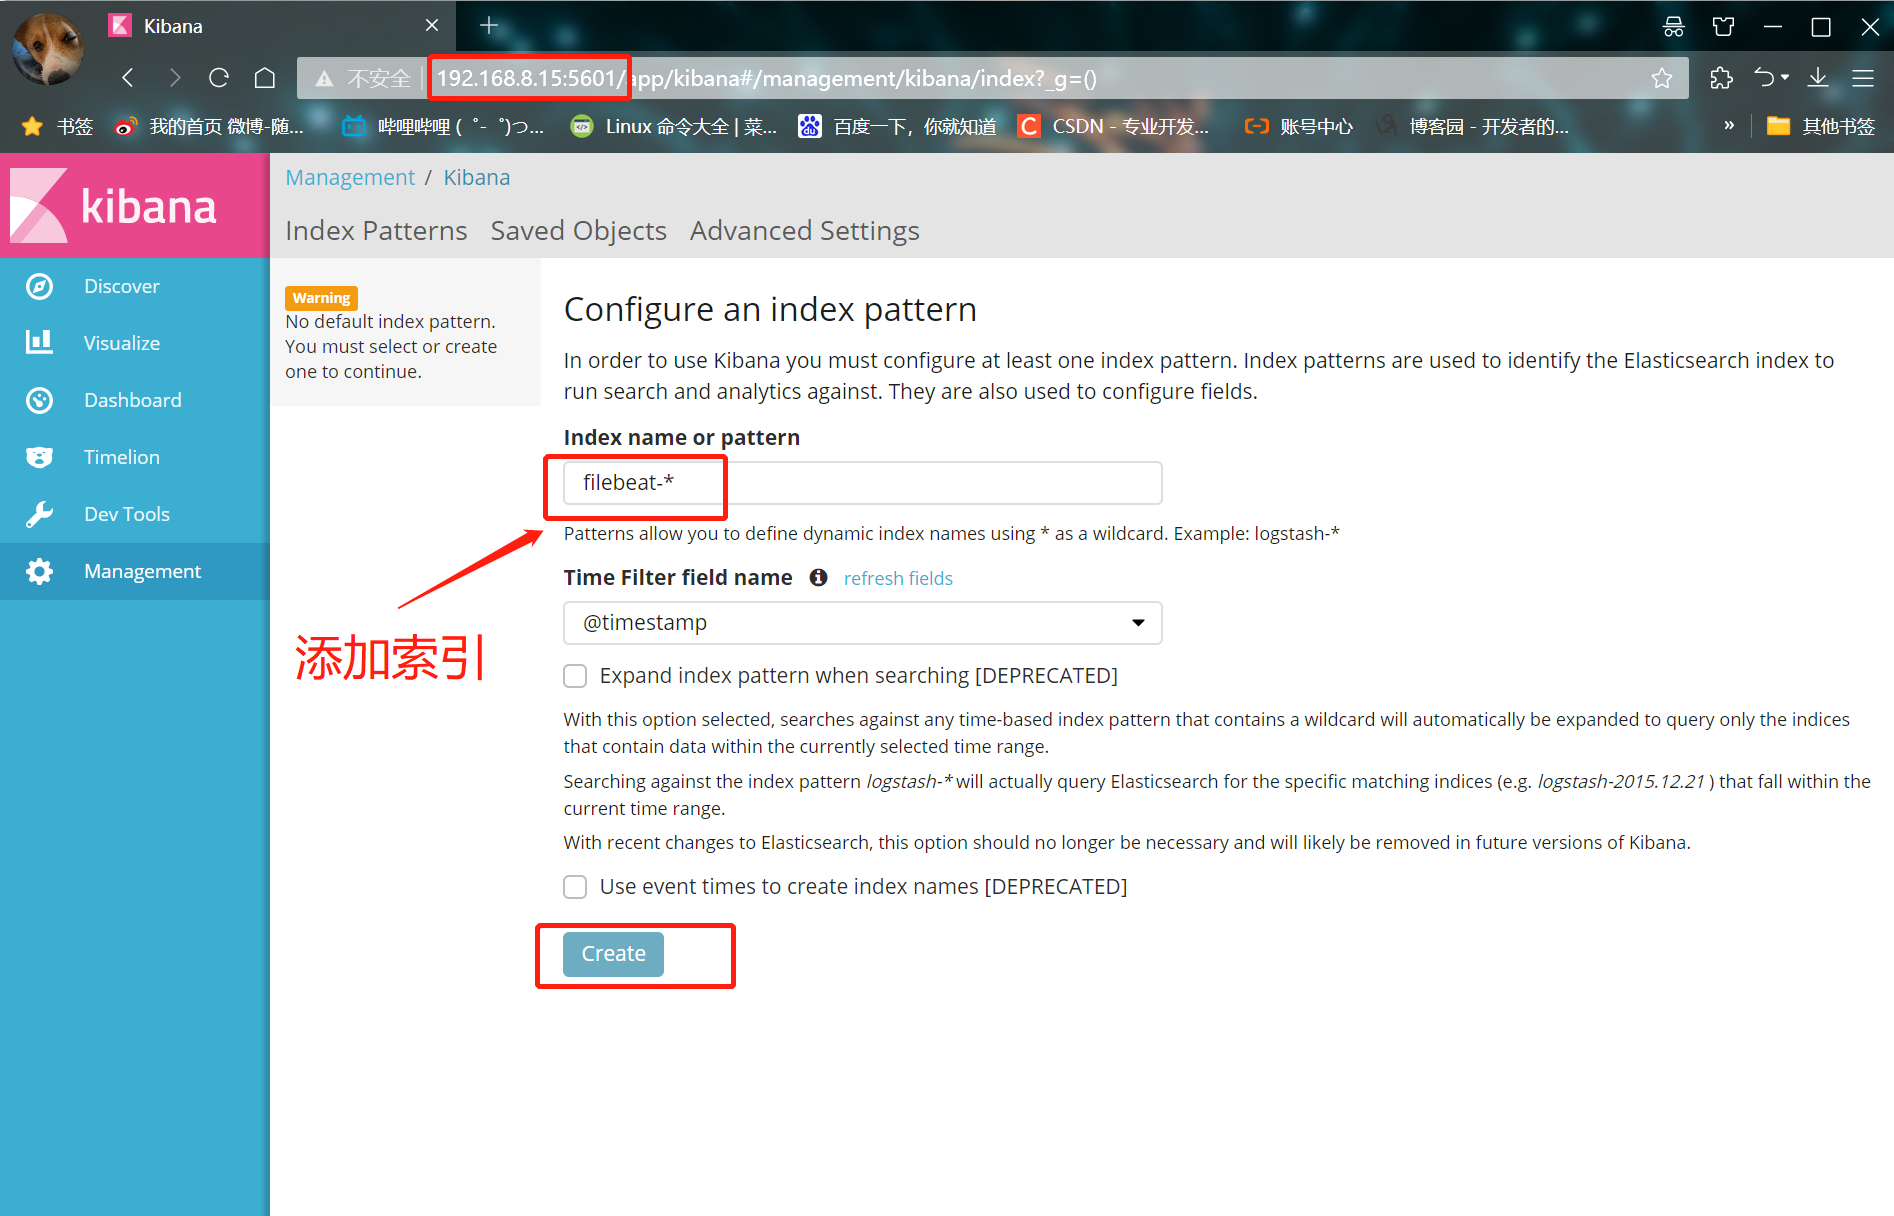
① After logging in, create an index name: filebeat-*
② Enter s ystem below-*
③ Then click the Create button at the bottom to create
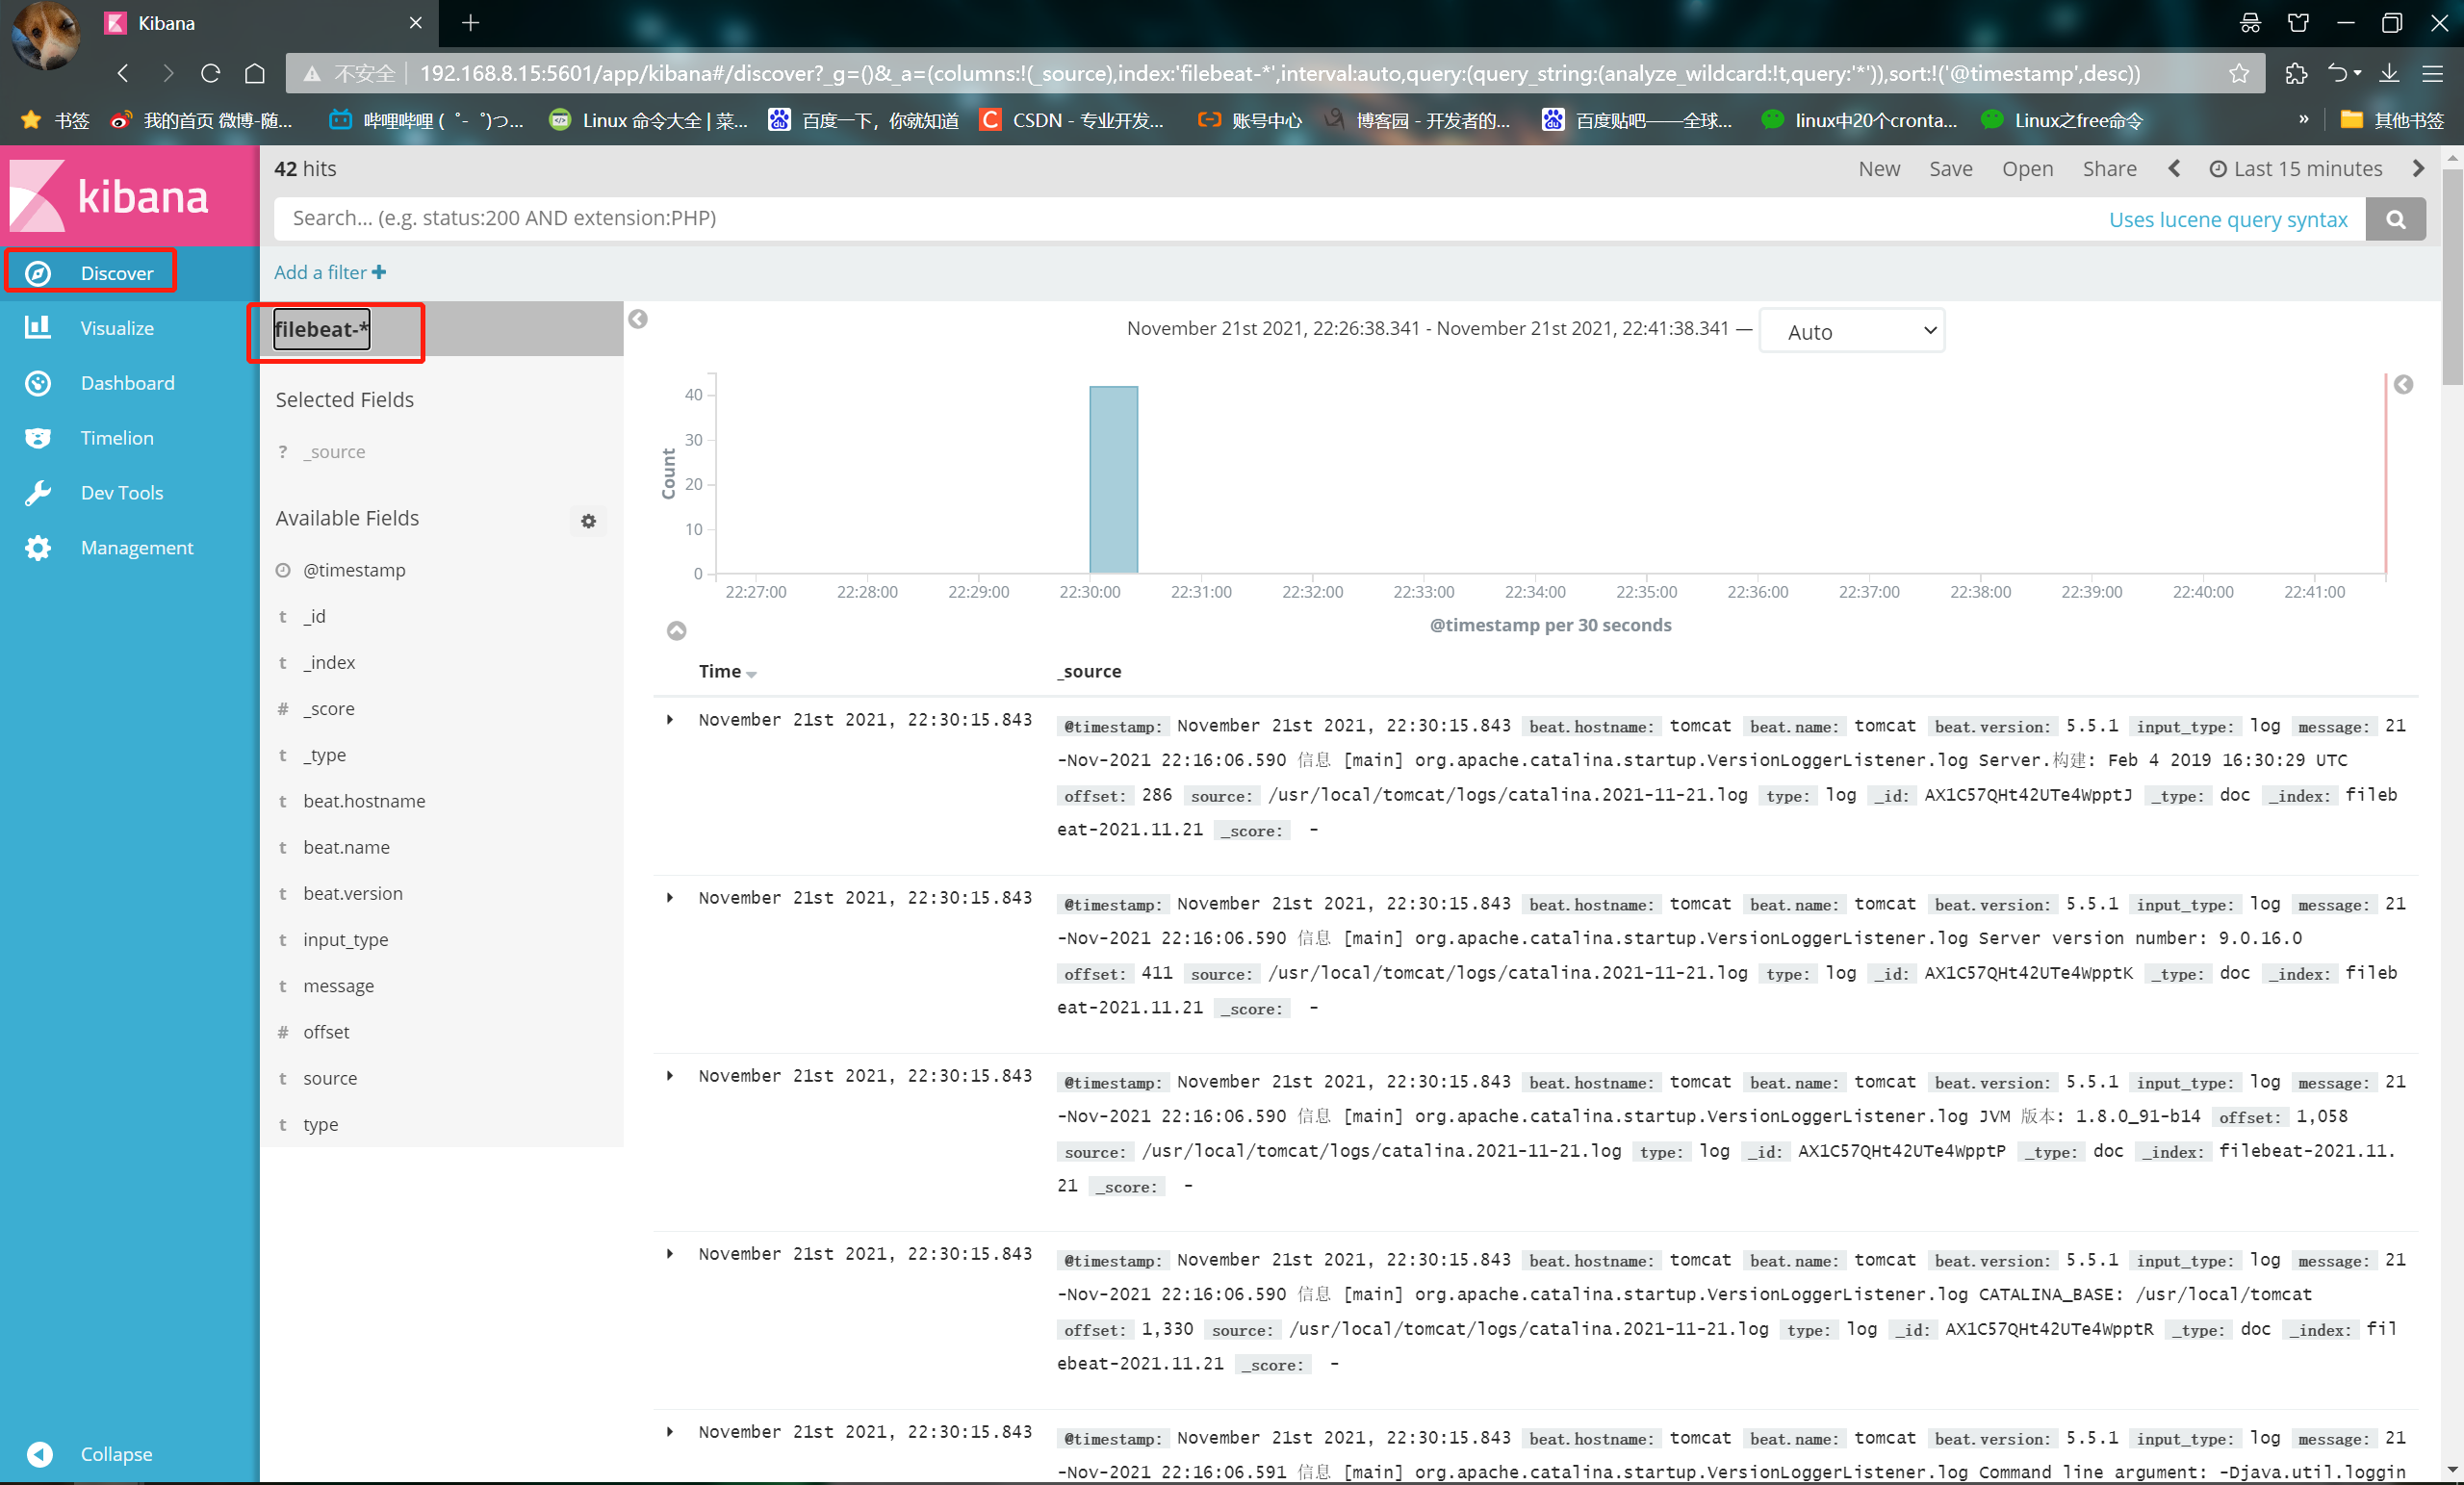
④ Click the Discover button in the top left corner to find the filebeat - * information
summary
-
ELK is composed of ElasticSearch, Logstash and Kiabana
-
Their functions are as follows:
① ES(nosql non relational database): storage function and index
② Logstash (log collection): take the log from the application server and output it to es after format conversion. Collect / collect the log through the input function
③ filter: format data and output logs to es database
④ Kibana (display tool): display the data in es in the browser and display it through the UI interface (you can process the log according to your own needs for easy viewing and reading) -
Each component of the EFK system eats memory very much. In the later stage, the EFK architecture can be expanded according to business needs. When FileBeat collects more and more logs, Redis can be introduced to prevent data loss, and ElasticSearch can also be expanded into a cluster and managed with the Head plug-in. Therefore, it is necessary to ensure that the server has sufficient running memory and disk space.