1. Principles and Features (Functions)
1. Main features
- Multidimensional data model (Time series consists of metric name and labels for k/v)
- Flexible Query Language ( PromQL)
- Distributed storage without dependencies; Single-node servers are autonomous
- Use http protocol, pull mode to pull data, easy to understand
- Monitoring objectives, which can be service discovery and static configuration
- Supports a variety of statistical models and interface displays. It can be combined with Grafana.
2. Architecture schematic
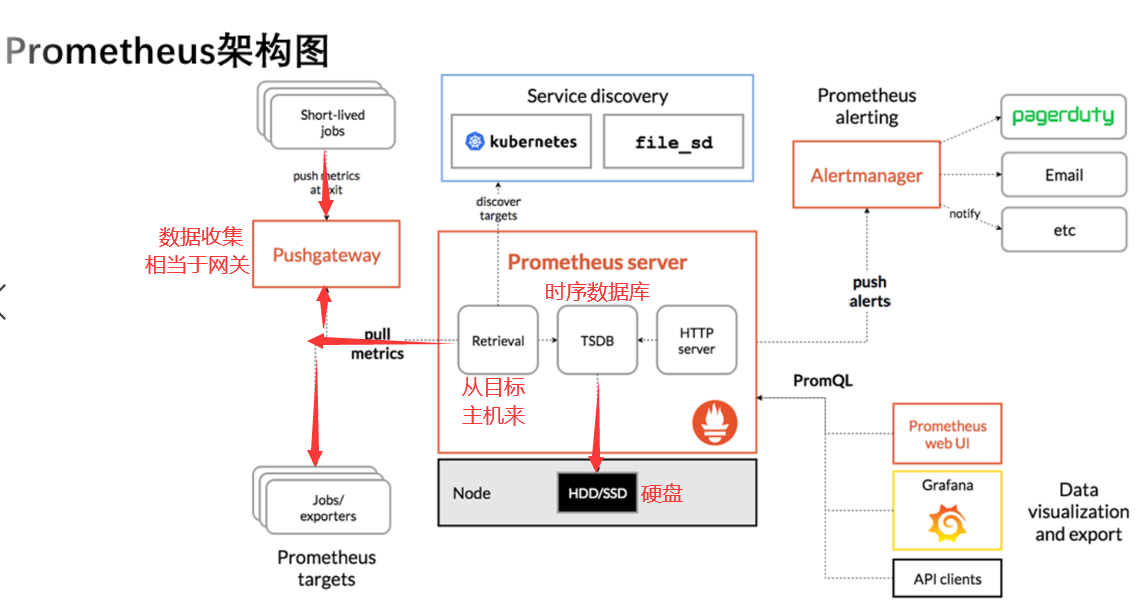
The picture comes from: Overview | Prometheus
2. Install Prometheus
1. Install the main components as follows:
- Prometheus Server
- The monitored object exporter component
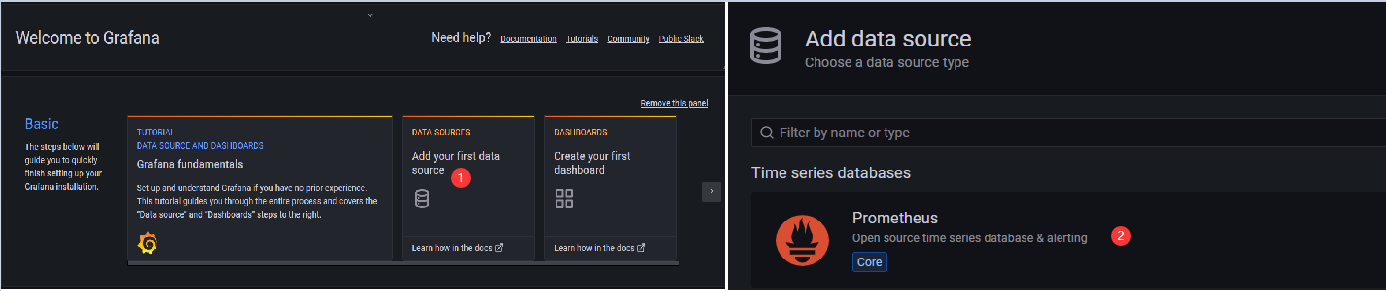
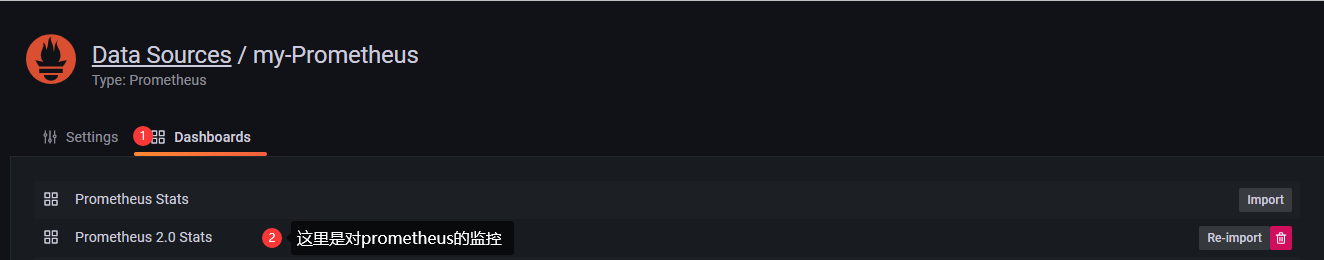
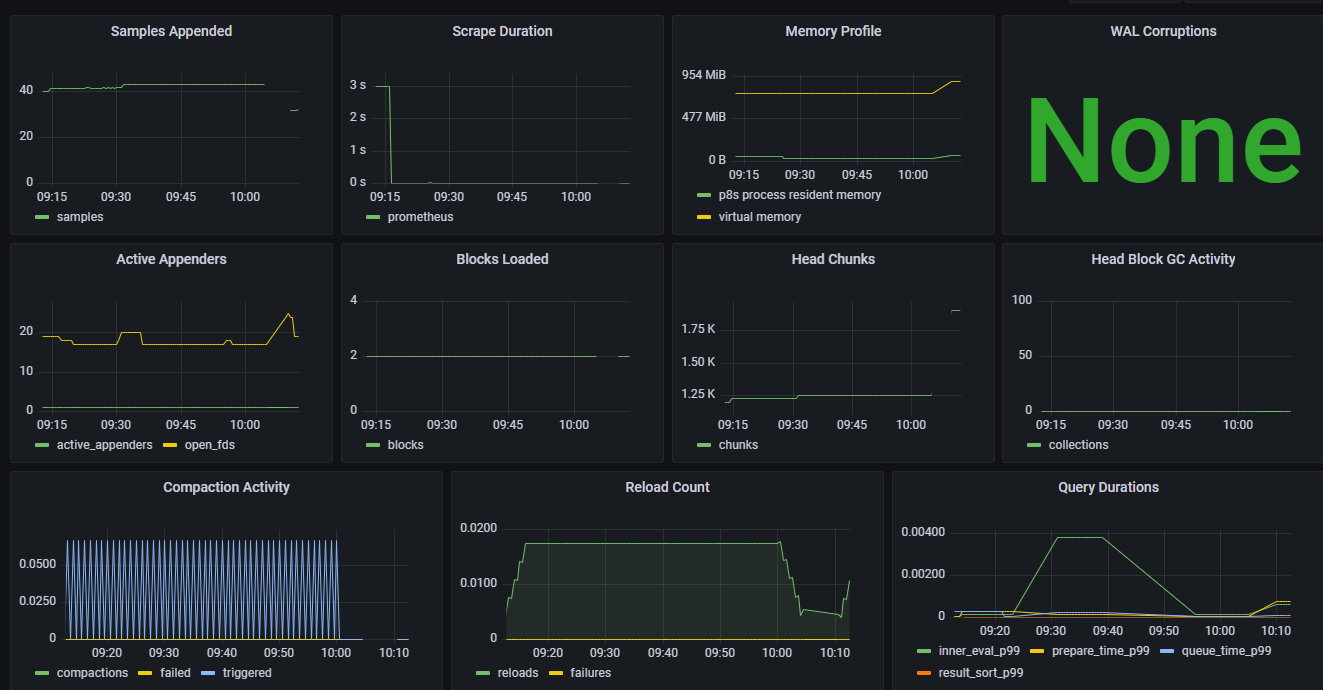
- Data visualization tool Grafana
- Data Upload Gateway push gateway
- Alertmanager
2. Install prometheus server
Official download address: Download | Prometheus
Due to the instability of the official address, not pursuing the latest version can use the disk address I downloaded: Please enter extraction code for Baidu netdisk 8888
#1. Send installation packages to host via software
[root@module 1-prometheus]# tar -xf prometheus-2.33.3.linux-amd64.tar.gz  #Unzip Package
[root@module 1-prometheus]# mv prometheus-2.33.3.linux-amd64/ /usr/local/prometheus #Move the package to the directory where the software is installed and rename it
[root@module 1-prometheus]# cd /usr/local/prometheus/  #Enter program directory
[root@module prometheus]# ./prometheus --version       #View Version
prometheus, version 2.33.3 (branch: HEAD, revision: 56e14463bccfbb6a8facfb663fed5e0ca9f8b387)
  build user:       root@4ee34e4f7340
  build date:       20220211-20:48:21
  go version:       go1.17.7
  platform:         linux/amd64
[root@module prometheus]# sed -i '$s/"localhost:/"192.168.1.123:/' prometheus.yml #Modify profile, IP is local address
[root@module prometheus]# ./promtool check config ./prometheus.yml  #Check profile syntax
Checking ./prometheus.yml
 SUCCESS: ./prometheus.yml is valid prometheus config file syntax

#2. Write a service file
[root@module prometheus]# vim /usr/lib/systemd/system/prometheus.service #Write a service file for later use
[Unit]
Description=Prometheus Monitoring System  #Descriptive Information
After=network.target                      #After which service to start

[Service]
ExecStart=/usr/local/prometheus/prometheus \         #The name of the process that needs to be started to execute systemctl start
   --config.file=/usr/local/prometheus/prometheus.yml \  #configuration file
   --storage.tsdb.path=/usr/local/prometheus/data/ \     #Data Storage Path
   --web.enable-admin-api \     #Turn on anonymous login
   --web.enable-lifecycle       #Turn on hot loading

[Install]
WantedBy=multi-user.target
[root@module prometheus]# systemctl daemon-reload     #Reload Configuration
[root@module prometheus]# systemctl enable prometheus.service --now  #Startup Program Start-Up
[root@module prometheus]# ss -tunlp |grep 9090        #Check if the service is started, default port is 9090
Note: If the environment is a virtual machine, to ensure time synchronization, configure NTP to access the Internet through a real machine
[root@module prometheus]# timedatectl status #Make sure the equipment is in Shanghai time zone
Local time: Thu 2022-02-17 02:51:54 CST
Universal time: Wed 2022-02-16 18:51:54 UTC
RTC time: Wed 2022-02-16 18:51:54
Time zone: Asia/Shanghai (CST, +0800)
NTP enabled: n/a
NTP synchronized: no
RTC in local TZ: no
DST active: n/a
[root@module prometheus]# yum -y install chrony #Install NTP
[root@module prometheus]# vim /etc/chrony.conf #Configure clock source, Ali source I use
server ntp1.aliyun.com iburst
#server 0.centos.pool.ntp.org iburst
#server 1.centos.pool.ntp.org iburst
#server 2.centos.pool.ntp.org iburst
#server 3.centos.pool.ntp.org iburst
[root@module prometheus]# systemctl enable chronyd --now #Start NTP and Start Self
[root@module prometheus]# date #View time synchronized with real machine
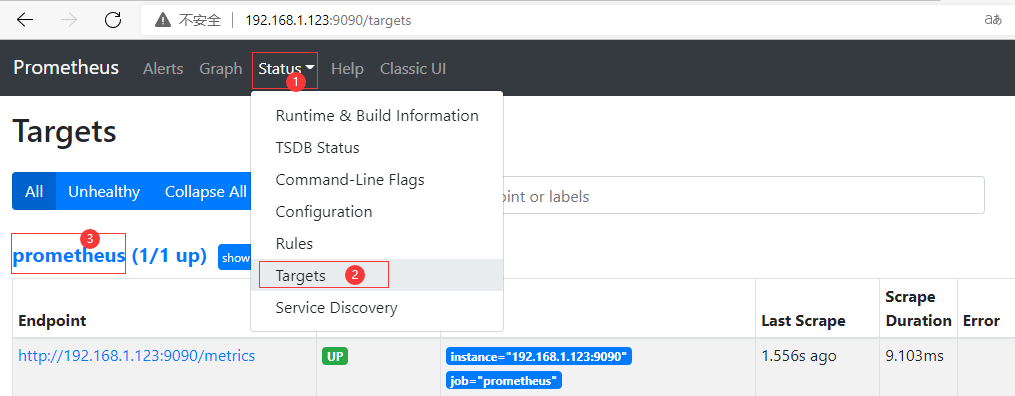
Wed Feb 16 18:56:20 CST 2022 Access through browser at this time: IP:9090; Ensure prometheus is working

3. Install prometheus controlled side
The package can also be downloaded to your home directory from the above disks
[root@module ~]# tar -xf node_exporter-1.3.1.linux-amd64.tar.gz
[root@module ~]# mv node_exporter-1.3.1.linux-amd64 /usr/local/node_exporter
[root@module ~]# vim /lib/systemd/system/node_exporter.service #Write service file
[Unit]
Description=node_exporter
After=network.target

[Service]
Type=simple
ExecStart=/usr/local/node_exporter/node_exporter

[Install]
WantedBy=multi-user.target

[root@module ~]# systemctl daemon-reload
[root@module ~]# systemctl enable node_exporter.service --now  #Set up the service and turn it on
[root@module ~]# ss -tunlp |grep 9100             #See if the service is being listened on
[root@module ~]# vim /usr/local/prometheus/prometheus.yml #Add Controlled End Configuration at End of Line
  - job_name: "node"
    static_configs:
      - targets: ["192.168.1.101:9100"]
4. Download and install grafana
[root@module ~]# wget https://dl.grafana.com/enterprise/release/grafana-enterprise-8.3.6-1.x86_64.rpm #Download GRANAFA Package
[root@module ~]# yum -y install grafana-enterprise-8.3.6-1.x86_64.rpm #Install RPM packages
[root@module ~]# systemctl enable grafana-server.service --now        #Start the program and set the startup self-startup
Created symlink from /etc/systemd/system/multi-user.target.wants/grafana-server.service to /usr/lib/systemd/system/grafana-server.service.
[root@module ~]# ss -tunlp | grep grafana  #View the port and make sure the service is started
tcp    LISTEN     0      128      :::3000                 :::*                   users:(("grafana-server",pid=4300,fd=10))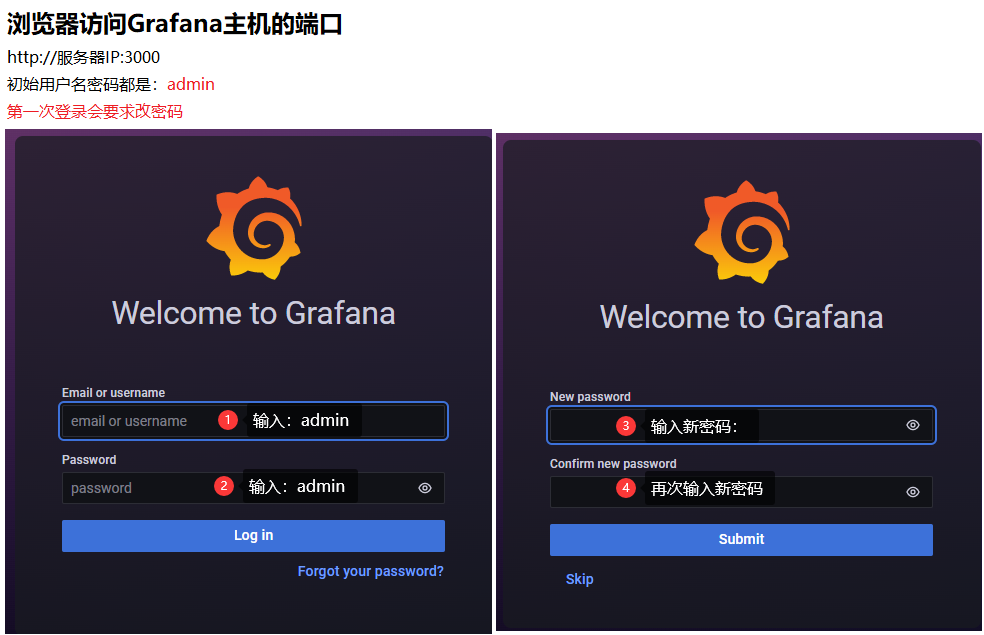
Question 1: Anonymous access can also be turned on if the password cannot be reset (default does not work)
[root@module ~]# vim /etc/grafana/grafana.ini
[auth.anonymous]
enabled = true     #Whether to turn on anonymous login
org_role = Admin   #Use login identity: Admin represents an administrator
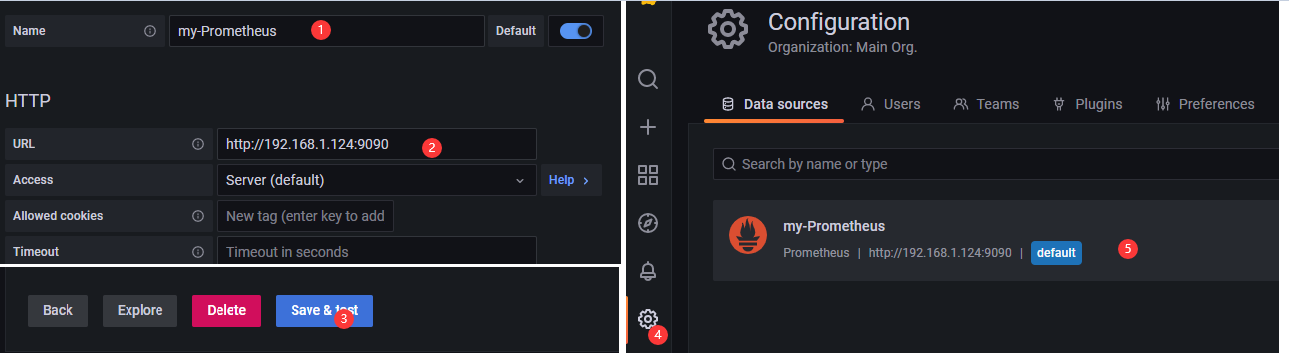
Question 2: If the interface shows a connection failure, check whether prometheus is started on the server side
5. Install Alertmanager
Download Address Choose Official or Shared Address
#I chose the downloaded package to transfer to the virtual machine
[root@module ~]# tar -xf 1-prometheus/alertmanager-0.23.0.linux-amd64.tar.gz -C /usr/local/  #Unzip Source Package
[root@module ~]# mv /usr/local/alertmanager-0.23.0.linux-amd64/ /usr/local/alertmanager
#Modify directory name for easy management

[root@module ~]# vim /lib/systemd/system/alertmanager.service #Write a systemd file
[Unit]
Description=Alertmanager for Prometheus
After=network.target

[Service]
Type=simple
ExecStart=/usr/local/alertmanager/alertmanager --config.file=/usr/local/alertmanager/alertmanager.yml --storage.path=/usr/local/alertmanager/data/
Restart=on-failur
ExecStop=/bin/kill -9 $MAINPID

[Install]
WantedBy=multi-user.target

[root@module ~]# systemctl enable alertmanager.service --now  #Start the program and start it automatically
Created symlink from /etc/systemd/system/multi-user.target.wants/alertmanager.service to /usr/lib/systemd/system/alertmanager.service.
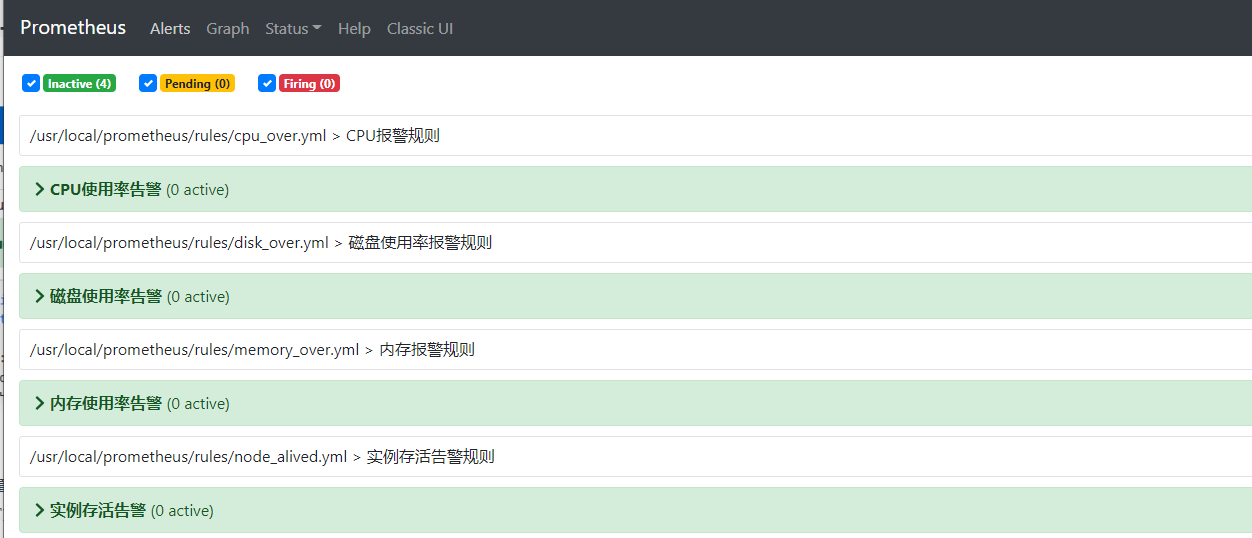
6. Configure alarm rules
Add in the rules directory. yml suffix files, prometheus will monitor and alarm according to these rule configuration files;
[root@module ~]# mkdir /usr/local/prometheus/rules
#1. Instance Survival Warning
[root@module ~]# vim /usr/local/prometheus/rules/node_alived.yml
groups: #A profile contains multiple groups
- name: Instance Survival Alert Rule #Group name
rules: #rule
- alert: Instance Survival Alert #Warning Name
expr: up == 0 #Trigger Rule
for: 1m #How long does the trigger last to send a warning
labels: #Alert Label
user: prometheus
severity: warning
annotations: #Warning Notes
summary: "Host Downtime !!!"
description: "The instance host has been down for more than a minute."
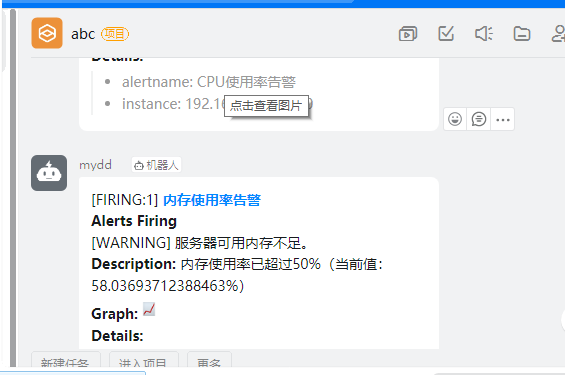
#2. Memory Alarm Rules
[root@module ~]# vim /usr/local/prometheus/rules/memory_over.yml
groups:
- name: Memory Alarm Rule
rules:
- alert: Memory Usage Alert
expr: (1 - (node_memory_MemAvailable_bytes / (node_memory_MemTotal_bytes))) * 100 > 50
for: 1m
labels:
severity: warning
annotations:
summary: "Server is running out of available memory."
description: "Memory usage has exceeded 50%(Current value:{{ $value }}%)"
#3.CPU Alarm
[root@module ~]# vim /usr/local/prometheus/rules/cpu_over.yml
groups:
- name: CPU Alarm rules
rules:
- alert: CPU Usage Alert
expr: 100 - (avg by (instance)(irate(node_cpu_seconds_total{mode="idle"}[1m]) )) * 100 > 50
for: 1m
labels:
severity: warning
annotations:
summary: "CPU Usage is soaring."
description: "CPU Usage over 50%(Current value:{{ $value }}%)"
#4. Disk Usage Alarm
[root@module ~]# vim /usr/local/prometheus/rules/disk_over.yml
groups:
- name: Disk Usage Alarm Rules
rules:
- alert: Disk Usage Alert
expr: 100 - node_filesystem_free_bytes{fstype=~"xfs|ext4"} / node_filesystem_size_bytes{fstype=~"xfs|ext4"} * 100 > 80
for: 20m
labels:
severity: warning
annotations:
summary: "High hard disk partition usage"
description: "Partition usage greater than 80%(Current value:{{ $value }}%)"Hot Load Configuration: curl-X POST http://192.168.1.101:9090/ -/reload
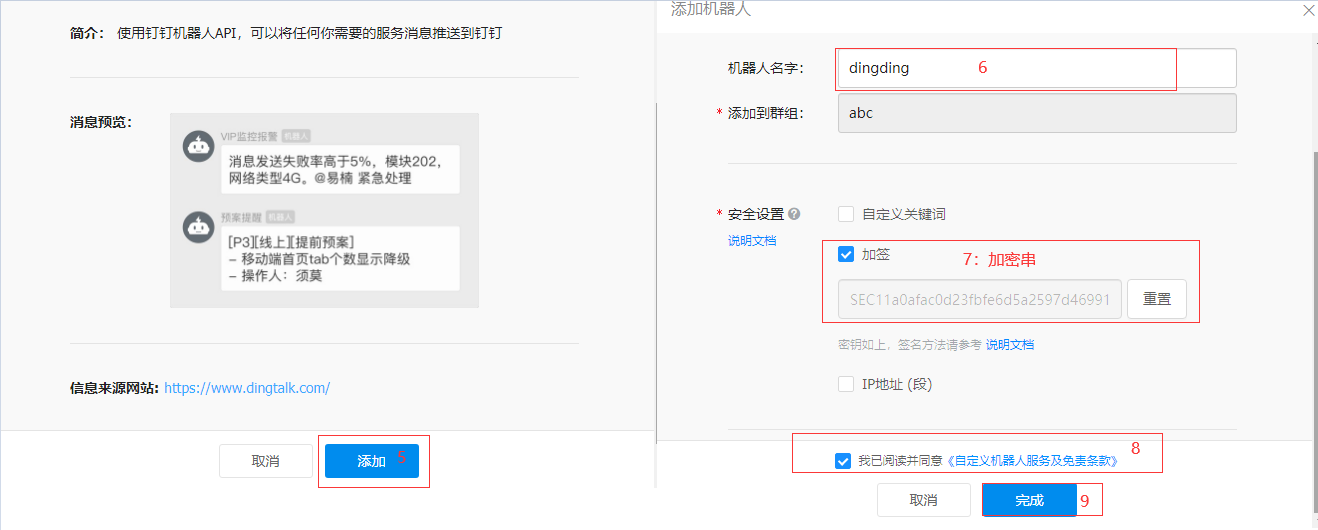
7. Create a pin machine on the client side (I created it on windows)
Create a project group yourself before setting it up
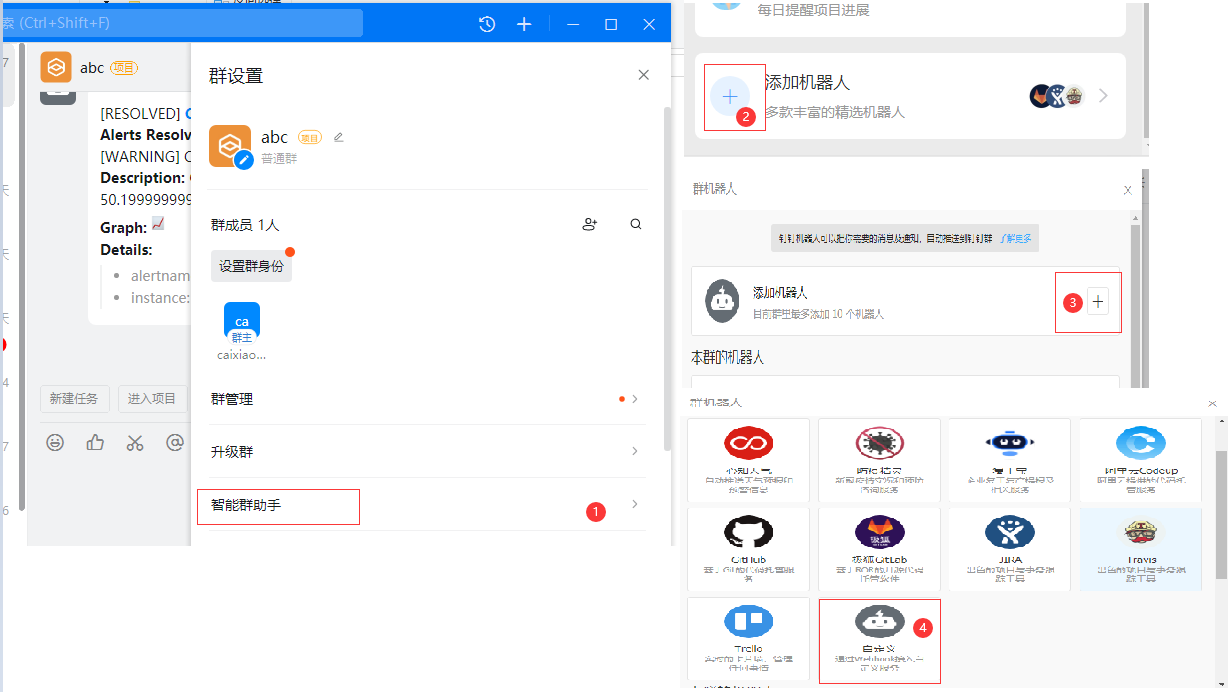
8. Download pin plug-ins and modifications (using a mesh pack)
#1. Download the plug-in and place it on the server
[root@module ~]# tar -C /usr/local/ -zxf /root/prometheus-webhook-dingtalk-1.4.0.linux-amd64.tar.gz #Unscrew Pin Plug-in Package
[root@module ding]# mv /usr/local/prometheus-webhook-dingtalk-1.4.0.linux-amd64 /usr/local/ding #Move to installation directory for easy use
[root@module ding]# cp config.example.yml conf.yml #Copy Template File
[root@module ding]# vim conf.yaml
targets:
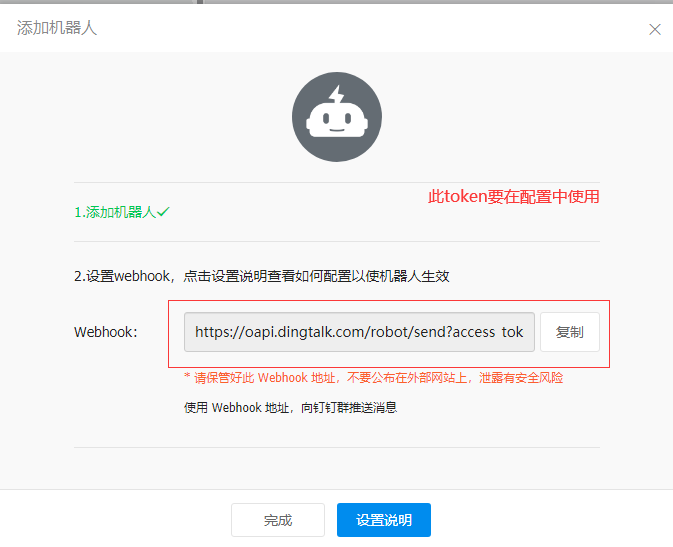
webhook1:
url: webhook address #(Copy the Token that created the pin)
secret: Encryption String
#2. Modify prometheus configuration file
[root@module ~]# vim /usr/local/prometheus/prometheus.yml
global: #Global Configuration
scrape_interval: 15s #Default time interval for collecting monitoring data
evaluation_interval: 15s #Average Interval Time
alerting: #Alarm rules
alertmanagers: #
- static_configs:
- targets:
- 192.168.1.125:9093 #Server listening port
rule_files: #Specify Rule File
- rules/*.yml
scrape_configs: #Monitoring Object Configuration
- job_name: "prometheus" #Task Name
static_configs: #Monitor Object Address
- targets: ["192.168.1.125:9090"]
- job_name: "node"
static_configs:
- targets: ["192.168.1.125:9100"]
#3. Modify Rule File
[root@module ~]# vim /usr/local/alertmanager/alertmanager.yml
global: #Global Configuration Items
resolve_timeout: 5m #Processing timeout, default 5 minutes
route: #Define Routing Tree Information
group_by: ['alertname','instance'] #Alarm Grouping Basis
group_wait: 10s #How long do I initially wait to send a set of alert notifications
group_interval: 10s #Wait time before sending a new alert
repeat_interval: 1h #Cycle for sending duplicate alerts, cannot be set too low for email configuration or it will be rejected by smtp server due to too many email > deliveries
receiver: 'webhook' #Name of the recipient who sent the alert
receivers: #Define alert recipient information
- name: 'webhook' #alert
webhook_configs: #webhook configuration
- send_resolved: true #Is it on or off
url: 'http://192.168.1.125:8060/din gt alk/webhook1/send'#alert webhook address, alert information will be post ed to this address, need > To write a service to receive the alert data
#An inhibition rule is a rule that invalidates an alert matching a set of matchers in the presence of an alert matching another set of matchers. Both alerts must have the same set of labels.
inhibit_rules:
- source_match:
severity: 'critical'
target_match:
severity: 'warning' #Target Alert Status
equal: ['alertname', 'dev', 'instance']
[root@module ~]# systemctl restart alertmanager.service #Restart Service
[root@module ding]# nohup ./prometheus-webhook-dingtalk --config.file="conf.yml" 2>&1 1>dingding.log & #Start program background run exit terminal does not affect
[root@module ding]# dd if=/dev/zero of=/dev/null #Simulate CPU usage improvement to achieve alarm effect
Ultimately, if the test feels like waiting too long, change alertmanager text to piece repeat_interval: 60s