In the previous article, we introduced inline hook (hook method for modifying code). Next, we are going to introduce hardware breakpoint + veh hook (hook method without modifying code). As the groundwork, this paper first introduces the hardware breakpoint.
After obtaining the actual combat code and reference materials of this article, please pay attention and reply in the chat box: Hardware breakpoint.
Introduction to hardware breakpoints
Similar to software breakpoints, hardware breakpoints are a means of code debugging, which can make the code interrupt where it is needed to facilitate debugging.
Software breakpoints are implemented by the debugger inserting int 3 assembly instructions at the breakpoint position. As the name suggests, the hardware breakpoint depends on the hardware cpu, which is mainly realized by dr0~dr7 and 8 debugging registers.
Hardware breakpoints are more powerful than software breakpoints. In addition to function breakpoints, you can also specify data breakpoints, which can be interrupted when data is read or written.
The essence of a hardware breakpoint is a breakpoint in a specified memory, which can be located in a code segment (function breakpoint) or a data segment (data breakpoint). You can set events to interrupt during execution, writing, reading and writing.
The debugger uses hardware breakpoints to implement data breakpoint functions (such as gdb's watch command)
Breakpoint 1, main (argc=0, argv=0x7fffffffe3e0) at xxx.cpp:27
27      {
(gdb) watch argc
Hardware watchpoint 2: argc
Some game plug-ins will also use hardware breakpoints to achieve hook effect. I'll talk about it after introducing hardware breakpoints.
Debug register
Hardware breakpoint is a function provided by cpu, which mainly deals with dr0~dr7 these eight debug registers on cpu. Please refer to intel manual for details.
intel-325462-sdm-vol-1-2abcd-3abcd.pdf ,page 3415
dr0,dr1,dr2,dr3(Debug Address Registers)

dr0~dr3 are debug address registers that store the memory addresses of four hardware breakpoints. Hardware limitations, so there are only four hardware breakpoints at most.
dr4, dr5 (reserved, temporarily useless)

It's no use at present. Don't say it.
dr6(Debug Status Register)


The debug status register is dr6 used by bit. We mainly focus on bits B0~B3. After triggering the hardware breakpoint, the corresponding sequence number bit will be set to 1.
dr7(Debug Control Register)
The properties of hardware breakpoints can be set by bit, including switch bit, condition bit and length bit.
Switch position

The switch position of dr7 controls whether the hardware breakpoint dr0~dr3 is enabled.
Conditional bit

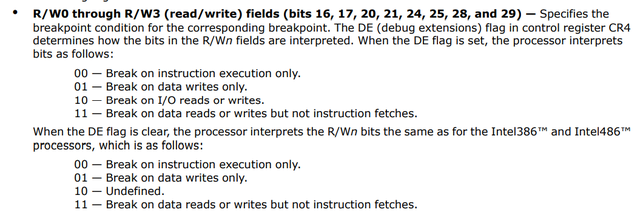
The conditional bit of dr7 controls how dr0~dr3 is triggered. Triggered when 00 is executed. Triggered when 01 writes, and triggered when 11 reads and writes.
Length bit

The memory address specified by dr0~dr3, and the length bit of dr7 controls the memory length.

If the condition bit of dr7 is set to 00 for execution, the corresponding length bit must be 00.
Code practice
Set debug register
windows provides an API to set and get registers.
BOOL SetThreadContext(
    _In_ HANDLE hThread,
    _In_ CONST CONTEXT* lpContext
    );
BOOL GetThreadContext(
    _In_ HANDLE hThread,
    _Inout_ LPCONTEXT lpContext
    );
CONTEXT is a structure that contains all registers. Because each cpu has a set of registers, the API needs to transfer the thread handle and set the register of which thread.
dr7 auxiliary class
dr7 registers are bit operation, which is inconvenient to set and see. Write an auxiliary class. The bit by bit operation can be done in this way, and there is no need to move back and forth.
// <<intel-325462-sdm>> page 3414
// Debug control register (DR7)
// Specifies the forms of memory or I / O access that cause breakpoints to be generated.
struct xx_dr7 {
  uint32_t L0 : 1;
  uint32_t G0 : 1;
  uint32_t L1 : 1;
  uint32_t G1 : 1;
  uint32_t L2 : 1;
  uint32_t G2 : 1;
  uint32_t L3 : 1;
  uint32_t G3 : 1;


  uint32_t LE : 1;
  uint32_t GE : 1;
  uint32_t no_use1 : 1;
  uint32_t RTM : 1;
  uint32_t no_use2 : 1;
  uint32_t GD : 1;
  uint32_t no_use3 : 2;


  uint32_t RW0 : 2;
  uint32_t LEN0 : 2;
  uint32_t RW1 : 2;
  uint32_t LEN1 : 2;
  uint32_t RW2 : 2;
  uint32_t LEN2 : 2;
  uint32_t RW3 : 2;
  uint32_t LEN3 : 2;
};
Our encapsulated functions
We encapsulate a function for setting hardware breakpoints, using the dr7 helper class above.
Parameters include: thread handle, hardware breakpoint sequence number (0 ~ 3), memory address, event type (execution, write, read-write), and memory length.
#define RW_EXE    0b00
#define RW_WRITE  0b01
#define RW_RW    0b11


#define LEN_1B    0b00
#define LEN_2B    0b01
#define LEN_4B    0b11
static bool xx_set_hw_bp(HANDLE thread, int idx, void* addr,
  int RW = RW_EXE, int LEN = LEN_4B)
{
  if (RW == RW_EXE) {
    //If the corresponding RWn field in register DR7 is 00 (instruction execution), then the LENn field should also be 00.
    // The effect of using other lengths is undefined.See Section 17.2.5, "Breakpoint Field Recognition, " below.
    LEN = 0b00;
  }


  // get context
  CONTEXT context = { 0 };
  context.ContextFlags = CONTEXT_DEBUG_REGISTERS;
  BOOL get_ret = GetThreadContext(thread, &context);
  if (FALSE == get_ret) {
    return false;
  }


  // set dr7
  xx_dr7 dr7{ 0 };
  if (0 == idx) {
    memcpy(&context.Dr0, &addr, sizeof(addr));
    dr7.L0 = 1;
    dr7.G0 = 1;
    dr7.RW0 = RW;
    dr7.LEN0 = LEN;
  }
  else if (1 == idx) {
    memcpy(&context.Dr1, &addr, sizeof(addr));
    dr7.L1 = 1;
    dr7.G1 = 1;
    dr7.RW1 = RW;
    dr7.LEN1 = LEN;
  }
  else if (2 == idx) {
    memcpy(&context.Dr2, &addr, sizeof(addr));
    dr7.L2 = 1;
    dr7.G2 = 1;
    dr7.RW2 = RW;
    dr7.LEN2 = LEN;
  }
  else if (3 == idx) {
    memcpy(&context.Dr3, &addr, sizeof(addr));
    dr7.L3 = 1;
    dr7.G3 = 1;
    dr7.RW3 = RW;
    dr7.LEN3 = LEN;
  }
  // set context
  context.Dr7 = dr7.get();
  BOOL set_ret = SetThreadContext(thread, &context);
  return TRUE == set_ret;
}
The code logic is not complex, and the corresponding control bits are set with the help of dr7 auxiliary classes.
Let's do some tests
Data breakpoints for vs
Test, what is the value of the debug register after setting the data breakpoint in vs?
Test code:
void test_vs_data_bp() {
  int n = 0;// Data breakpoint under n
  CONTEXT context = { 0 };
  context.ContextFlags = CONTEXT_DEBUG_REGISTERS;
  auto ret = GetThreadContext(GetCurrentThread(), &context);
  xx_dr7 dr7{ 0 };
  dr7.set(context.Dr7);
}
In the third line of code, the normal breakpoint stops, and then the data breakpoint under n.

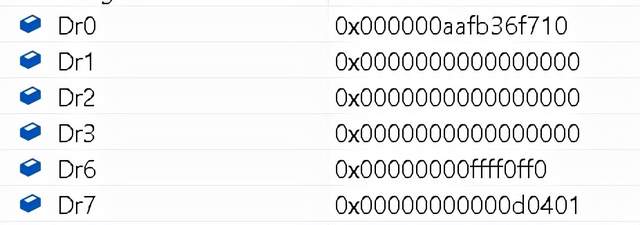
Then look at the value of the debug register

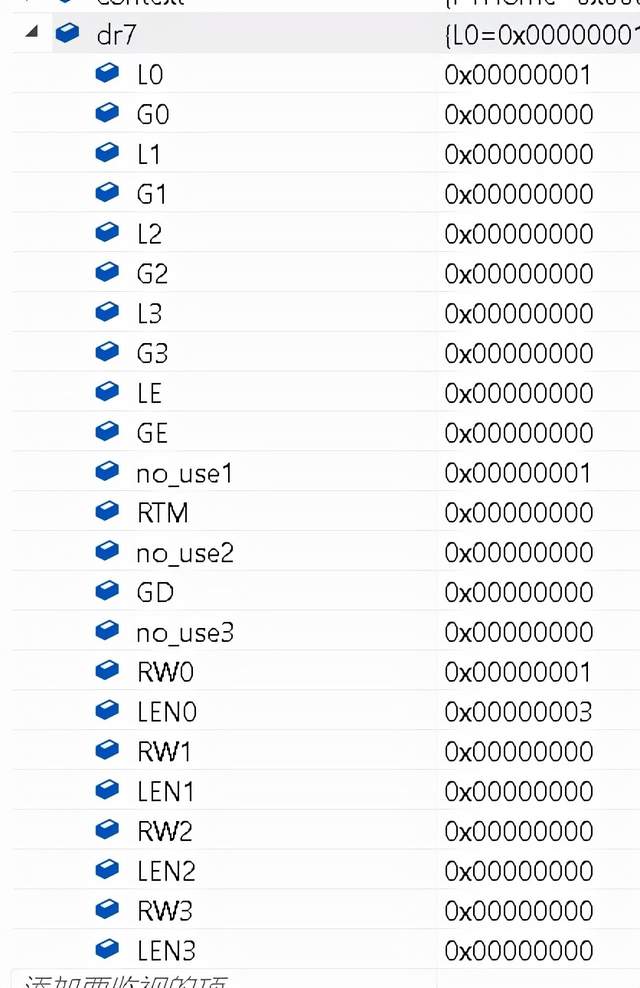
Look at the dr7 situation with the help of the dr7 auxiliary class.

The control bit L0 is set to 0b1, the condition bit RW0 is set to 0b01 (write event), and the length bit is 0b11 (0x3, 4 bytes).
Hardware breakpoint execution event
Let's continue to test the hardware breakpoint of the execution event.
void test_exe_hw_bp_func() {
  xx_set_hw_bp(GetCurrentThread(),1, &func, RW_EXE);
  func();
}
An exception is triggered when func is executed. We did not set veh processing, but it was caught by the debugger

Hardware breakpoint write event
Next, try to write an event. The test code is as follows:
void test_write_hw_bp() {
  int n = 0;
  xx_set_hw_bp(GetCurrentThread(), 0, &n, RW_WRITE);


  n = 1;//write
}
Trigger breakpoint when n=1

Hardware breakpoint read / write event
Continue to try read-write events. Why can't you set read-only events?
void test_read_hw_bp() {
  int n = 0;
  xx_set_hw_bp(GetCurrentThread(), 0, &n, RW_RW);
  int b = n;//read


  b = b * b;


  n = 5;
}
Interrupt while reading events

Interrupt on write event

Hardware breakpoint write event 1Byte
Next, try the length control bit. First set the write event and 1 byte. Then set the write event and 4 bytes.
void test_write_hw_bp_1byte() {
  char c[4];


  xx_set_hw_bp(GetCurrentThread(), 0, c, RW_WRITE,LEN_1B);
  c[0] = 0;
  c[1] = 0;


  xx_set_hw_bp(GetCurrentThread(), 0, c, RW_WRITE, LEN_4B);
  c[0] = 0;
  c[1] = 0;
}
No mapping. An interrupt occurs when lines 5, 9, and 10 are executed. Line 6 is not interrupted because only 1 byte is set.
After the introduction of hardware breakpoints and debugging registers, the hardware breakpoint hook will be introduced next time.
Finally, ask for attention, praise and forwarding~
Northeast code farmer, the same name in the whole network, seeking customs~