At the beginning of the article, let's ask a question. If OOM occurs in one thread of a java program, can other threads in the process still run?
Next, do an experiment to see if the six kinds of JVM programs can be accessed after OOM.
Here I use a springboot program.
/**
 * @author : charon
 * @date : Created in 2021/5/17 8:30
 * @description :  Program startup class
 * @version: 1.0
 */
@SpringBootApplication
public class CharonApplication {

    public static void main(String[] args) {
        SpringApplication.run(CharonApplication.class, args);
    }

}
Monitoring service availability( http://localhost:8080/checkHealth Test service (normally available):
/**
 * @author : charon
 * @date : Created in 2021/5/17 8:49
 * @description :  Test service availability
 * @version: 1.0
 */
@RestController
public class CheckHealthController {

    @RequestMapping("/checkHealth")
    public String stackOverFlowError(){
        System.out.println("Call service monitoring interface-----------------------");
        return "Service monitoring interface return";
    }
}
1.StackOverflowError (stack overflow)
Stack overflow means that an error occurs when the depth of the stack exceeds the stack size allocated by the virtual machine to the thread.
/**
 * @author : charon
 * @date : Created in 2021/5/17 8:49
 * @description :  Test Java Lang.stackoverflowerror: null error
 * @version: 1.0
 */
@RestController
public class StackOverFlowErrorController {

	/**
	 * Recursively call a method to exceed the maximum depth of the stack
	 */
    @RequestMapping("/stackOverFlowError")
    public void stackOverFlowError(){
        stackOverFlowError();
    }
}
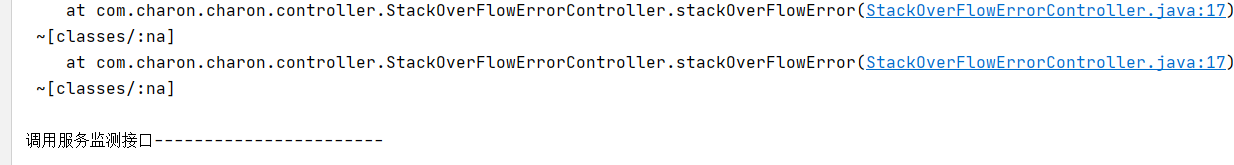
Use the browser to call the stack overflow interface (localhost:8080/stackOverFlowError) and find that the error of stack overflow is reported in the background.
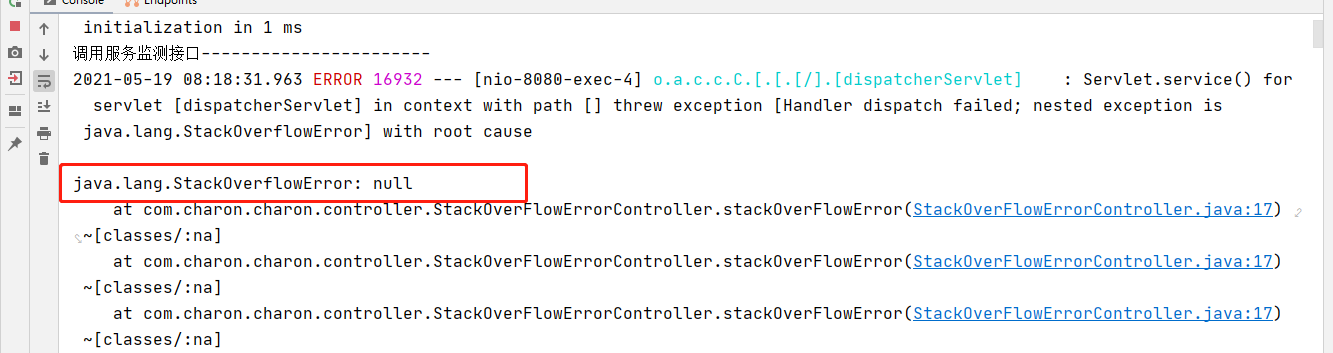
Call the available interfaces of the monitoring program and find that it can still be accessed normally.
2.Java heap space (heap memory overflow)
When the GC is repeated many times, the heap memory of the new generation and the old generation is almost full. The Full GC (Ergonomics) is triggered frequently until there is no memory space for the new object. So the JVM threw a memory overflow error! Which leads to program crash.
Setting virtual machine parameters (- Xms10m -Xmx10m -XX:+PrintGCDetails) may take a long time if not set.
@RestController
public class JavaHeapSpaceController {

    /**
     * Using a loop to create an object is a heap memory overflow
     */
    @RequestMapping("/javaHeapSpace")
    public void javaHeapSpace(){
        String str = "hello world";
        while (true){
            str += new Random().nextInt(1111111111) + new Random().nextInt(222222222);
            /**
             *  intern()method:
             * (1)When there is no reference to this string in the constant pool, add the reference of this object to the constant pool and return the reference of this object.
             * (2)When there is a reference to this string in the constant pool, return the reference to this object;
             */
            str.intern();
        }
    }
}
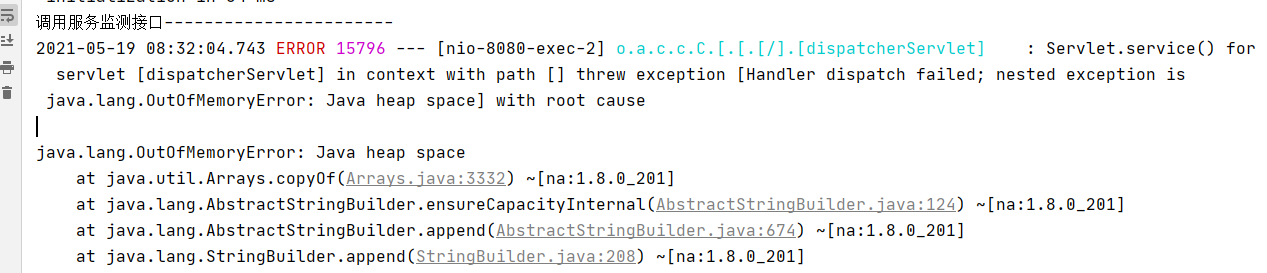
Call the available interfaces of the monitoring program and find that it can still be accessed normally.
3.direct buffer memory
When writing IO programs (such as Netty), ByteBuffer is often used to read or write data. This is an IO method based on channel and Buffer. It can directly allocate external memory using the Native function library, and then use a DirectByteBuffer object stored in the java heap as the reference operation of this memory, This can significantly improve performance in some scenarios because it avoids copying data back and forth between the java heap and the Native heap.
ByteBuffer.allocate(capacity) is used to allocate jvm heap memory, which belongs to the jurisdiction of GC. It is slow because it needs to be copied
ByteBuffer.allocateDirect(capacity) allocates local memory, which is not under the jurisdiction of GC. Since memory copy is not required, it is faster
However, if local memory is constantly allocated and heap memory is rarely used, the JVM does not need to execute GC and the DirectByteBuffer object will not be recycled,
At this time, the heap memory is sufficient, but the local memory may have been used up. If you try to allocate the local memory again, OutOfMemoryError will appear
Set JVM parameters: - Xms10m -Xmx10m -XX:+PrintGCDetails -XX:MaxDirectMemorySize=5m
@RestController
public class DirectBufferMemoryController {
@RequestMapping("/directBufferMemory")
public void directBufferMemory(){
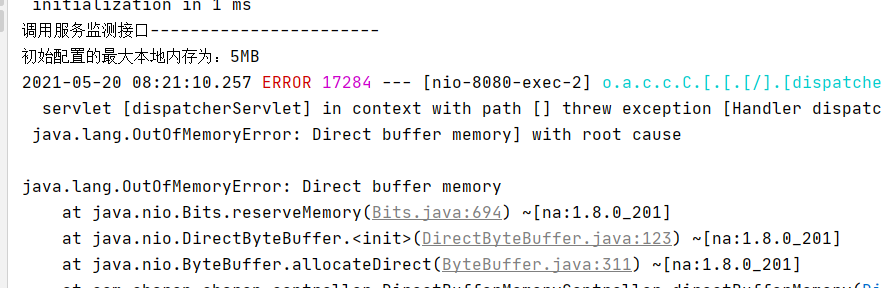
System.out.println("The maximum local memory initially configured is:"+ (sun.misc.VM.maxDirectMemory()/1024/1024)+"MB");
// The maximum memory set in the jvm parameter is 5M,
ByteBuffer buffer = ByteBuffer.allocateDirect(6*1024*1024);
}
}
Interface to access memory overflow( http://localhost:8080/directBufferMemory ), after an error is reported, access the service monitoring interface again, and it is found that it can still be accessed.
4.GC overhead limit exceeded
This error will be thrown if GC recycling is too long. The definition of too long is that more than 98% of the time is spent on garbage collection and less than 2% of the heap memory is recycled. It will be thrown only when GC recycling is less than 2% for several consecutive times. If GC overhead limit error is added, the following situations will occur:
- The memory cleared by GC will soon be filled again, forming a vicious circle
- CPU utilization has always been 100%, and GC has no effect
Set JVM parameters: - Xms10m -Xmx10m -XX:+PrintGCDetails -XX:MaxDirectMemorySize=5m
@RestController
public class GcOverHeadController {
@RequestMapping("/gcOverHead")
public void gcOverHead(){
int i = 0;
List<String> list = new ArrayList<>();
try{
while(true){
list.add(String.valueOf(++i).intern());
}
}catch(Throwable e){
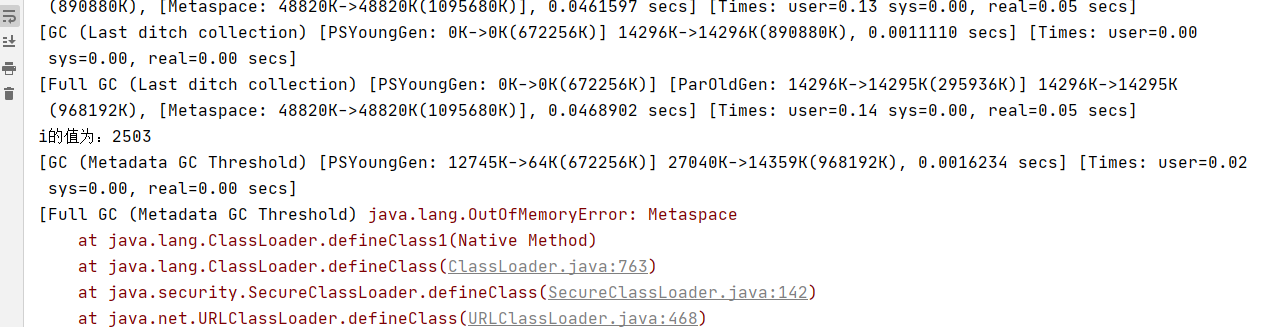
System.out.println("i The value of is:" + i);
e.printStackTrace();
throw e;
}
}
}
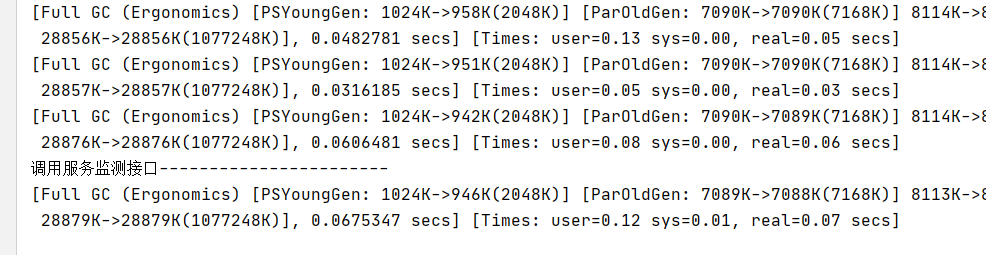
As shown in the figure below, before the exception of error reporting, there are frequent full GCS, but before and after garbage collection, the memory of the new generation and the old generation are similar, which shows that the garbage collection effect is not good.

Visit the service monitoring interface again and find that it can still be accessed.
5.Metaspace
In java 8 and later versions, MetaSpace is used to replace the permanent generation. The biggest difference between it and the permanent generation is:
MetaSpace does not exist in virtual machine memory, but uses local memory. That is, in java8, Class metadata is stored in MetaSpace's native Memory
The following information is stored in MetaSpace:
- Class information loaded by virtual machine
- Constant pool
- Static variable
- Just in time compiled code
Parameter settings: - XX:+PrintGCDetails -XX:MetaspaceSize=50m -XX:MaxMetaspaceSize=50m
@RestController
public class MetaSpaceController {

    static class OomTest{

    }

    /**
     * Simulate MetaSpace overflow, continuously generate classes and put them into the meta space, and the space occupied by the classes will exceed the size specified by MetaSpace
     */
    @RequestMapping("/metaSpace")
    public void metaSpace(){
        int i = 0;
        try{
            while (true){
                i++;
                /**
                 * Enhancer Allows you to create a java proxy for non interface types. Enhancer dynamically creates subclasses of the given type, but intercepts all methods,
                 * Unlike proxy, it works well whether it's an interface or a class.
                 */
                Enhancer enhancer = new Enhancer();
                enhancer.setSuperclass(OomTest.class);
                enhancer.setUseCache(false);
                enhancer.setCallback(new MethodInterceptor() {
                    @Override
                    public Object intercept(Object o, Method method, Object[] objects, MethodProxy methodProxy) throws Throwable {
                        return methodProxy.invokeSuper(o,objects);
                    }
                });
                enhancer.create();
            }
        }catch (Throwable e){
            System.out.println("i The value of is:" + i);
            e.printStackTrace();
        }
    }
}
I remember reading a official account before, using the proxy class created by Fastjson to cause the Metaspace problem, and I forgot the specific address.
Visit the service monitoring interface again and find that it can still be accessed.
6.unable to create new thread
In high concurrency services, the following errors often occur,
Cause:
- 1. The application has created too many threads, and the threads created by an application process exceed the system load limit
- 2. The server does not allow applications to create so many threads. By default, the linux system allows a single process to create 1024 threads (less than this value for ordinary users)
terms of settlement:
- 1. Reduce the number of threads created by the application and analyze whether the application really needs to create so many threads
- 2. Some applications do need to create so many threads. You can modify the linux server configuration and expand the default limit of linux
View: ulimit -u
Modification: VIM / etc / security / limits d/90-nproc. conf
@RestController
public class UnableCreateThreadController {
	/**
     * Friendly tip: don't run this code in windows. If you accidentally try it like me, you can only forcibly restart it
     */
    @RequestMapping("/unableCreateThread")
    public void unableCreateThread(){
        for (int i = 0; ; i++) {
            System.out.println("i The value of is:" + i);
            new Thread(()->{
               try{
                   Thread.sleep(1000*1000);
               } catch (InterruptedException e){
                   e.printStackTrace();
               }
            }).start();
        }
    }
}
I used the root user test here and created 7409 threads. When you test, it's best to use ordinary user test.
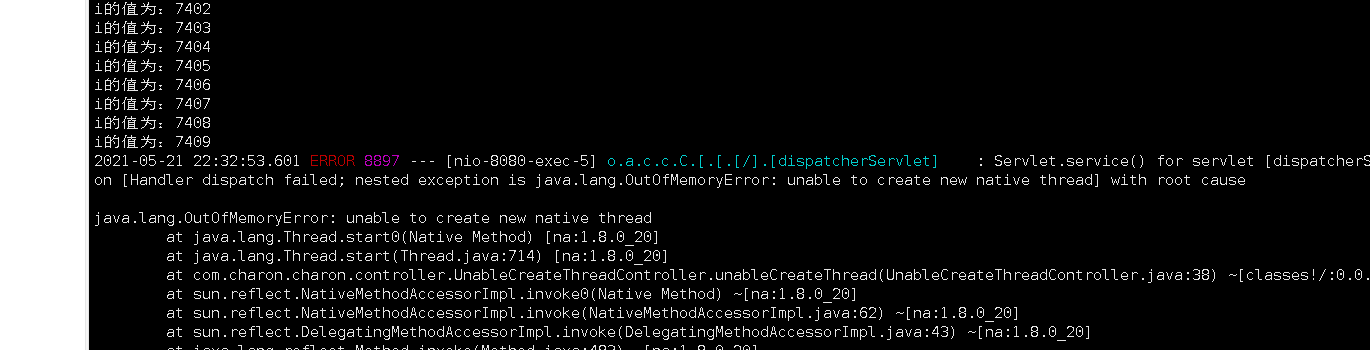
Finally, execute the interface of the detection service and find that the program can continue to access.
Summary
In fact, the thread with OOM will generally die, that is, it will be terminated. The heap occupied by the object held by the thread will be gc to free memory. Because gc is performed before OOM occurs, even if other threads can work normally, frequent gc will have a great impact.