KMEANS clustering
https://www.cnblogs.com/pinard/p/6164214.html
1. Briefly describe the principle and workflow of K-means algorithm
-
K sample points are randomly selected as the initial centroid
-
Calculate the distance from other samples to K centroids respectively, and divide each sample into the nearest cluster
-
For the new cluster, calculate the new cluster center
-
Repeat steps 2 and 3 until the cluster center does not move
2. What are the commonly used measures of distance to center in K-means?
-
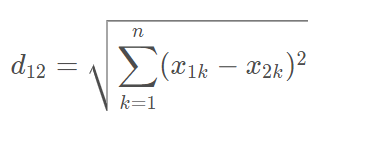
Euclidean distance
Vector subtraction square sum open root sign

2. Manhattan distance
Sum of absolute values of vector subtraction

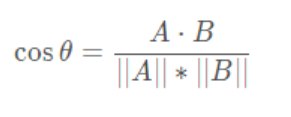
3. Cosine similarity (when processing documents)

3. How to select the k value in K-means?
-
Elbow method
-
Contour coefficient method
Selection of optimal K value for K-means clustering_ qq_15738501 blog - CSDN blog_ Selection of kmeans clustering K
4. Does the selection of initial point in K-means algorithm affect the final result?
The different positions of initial points will affect the final clustering effect.
The selection of initial points shall be the farthest from each other as far as possible
5. How to select the initial point of each category center in K-means clustering?
- Select K points as far away from the batch as possible
- Hierarchical clustering or Canopy algorithm is selected for initial clustering, and then the center point of these clusters is used as the initial cluster center point of KMeans algorithm.
6. Processing of K-means hollow clustering
- Select a point farthest from any current centroid. This will eliminate the point that currently has the greatest impact on the total square error.
- Select a substitute centroid from the cluster with the largest SSE, which will split the cluster and reduce the total sse of the cluster. If there are multiple empty clusters, the process is repeated multiple times.
- If there are too many noise or outliers, consider changing the algorithm, such as density clustering
7. Will K-means always fall into the cycle of choosing the center of mass?
No, math proves that kmeans will converge. The general idea is to use the concept of SSE (that is, the sum of squares of errors), that is, the sum of squares of the distance from each point to its own centroid. This sum of squares is a convex function, and its local optimal solution can be reached through iteration.
The code can set the number of iterations, convergence judgment distance, etc
8. How to quickly converge K-means with a large amount of data?
Batch processing mini batch
9. What are the advantages and disadvantages of K-means algorithm?
advantage:
- The principle is simple and easy to implement
- Only one K-value parameter needs to be adjusted for parameter adjustment
- Strong interpretability
Disadvantages:
- It is sensitive to outliers and noise points.
- The choice of K value is difficult to determine.
- The selection of initial value has a great impact on the results.
- The clustering result may be local optimal rather than global optimal.
- kmeans cannot handle nonconvex datasets.
- If the two categories are close, the results may not be good.
10. How to evaluate the effect of K-means clustering?
Contour coefficient
data normalization
Benefits of data normalization / standardization:
- Improve model accuracy
- Improve convergence speed
Standardization: (X-mean)/std
Normalization: (x-min) / (max min)
Scatter matrix
Scatter diagram is generally used to describe the relationship between two numerical variables
Interpretation of scatter matrix:
- Diagonal part: represents the distribution of the ith feature, x is the value of the feature, and y axis is the number of occurrences of the value of the feature. Density estimation representing the ith feature
- Non diagonal part: scatter diagram of the i-th feature and the j-th feature, describing the correlation before the two features
Contour coefficient
A way to evaluate the quality of clustering results
- For each vector in the cluster, the contour coefficient is calculated separately
- Averaging the contour coefficients of all points is the total contour coefficient of the clustering result

DBSCAN algorithm
It is a density based spatial clustering algorithm
Complete code
import pandas as pd
from sklearn.cluster import KMeans
from pandas.plotting import scatter_matrix
import matplotlib.pyplot as plt
import numpy as np
from sklearn.preprocessing import StandardScaler
from sklearn import metrics
# Load data
beer = pd.read_csv('E:\\ai\\main\\data.txt', sep=' ')
# Feature extraction
X = beer[["calories", "sodium", "alcohol", "cost"]]

# kmeans clustering
# Set clustering core
km = KMeans(n_clusters=3).fit(X)
km2 = KMeans(n_clusters=2).fit(X)

# The results of clustering are used as labels
beer['cluster'] = km.labels_
beer['cluster2'] = km2.labels_
# Compare the two clustering methods
cluster_centers = km.cluster_centers_
cluster_centers_2 = km2.cluster_centers_
centers = beer.groupby("cluster").mean().reset_index()
# Drawing comparison
plt.rcParams['font.size'] = 14
colors = np.array(['red', 'green', 'blue', 'yellow'])
plt.scatter(beer["calories"], beer["alcohol"], c=colors[beer["cluster"]])
plt.scatter(centers.calories, centers.alcohol, linewidths=3, marker='+', s=300, c='black')
plt.xlabel("Calories")
plt.ylabel("Alcohol")
# Scatter matrix analysis
scatter_matrix(beer[["calories", "sodium", "alcohol", "cost"]], s=100, alpha=1, c=colors[beer["cluster"]],
               figsize=(10, 10))
plt.suptitle("With 3 centroids initialized")
scatter_matrix(beer[["calories", "sodium", "alcohol", "cost"]], s=100, alpha=1, c=colors[beer["cluster2"]],
               figsize=(10, 10))
plt.suptitle("With 2 centroids initialized")

# Scale data
scaler = StandardScaler()
X_scaled = scaler.fit_transform(X)
# Cluster the scaled data
km3 = KMeans(n_clusters=3).fit(X_scaled)
beer["scaled_cluster"] = km3.labels_
beer.sort_values("scaled_cluster")
beer.groupby("scaled_cluster").mean()
pd.scatter_matrix(X, c=colors[beer.scaled_cluster], alpha=1, figsize=(10, 10), s=100)

# Clustering evaluation contour coefficient
score_scaled = metrics.silhouette_score(X, beer.scaled_cluster)
score = metrics.silhouette_score(X, beer.cluster)
print(score_scaled, score)
scores = []
for k in range(2, 20):
    labels = KMeans(n_clusters=k).fit(X).labels_
    score = metrics.silhouette_score(X, labels)
    scores.append(score)
plt.plot(list(range(2, 20)), scores)
plt.xlabel("Number of Clusters Initialized")
plt.ylabel("Sihouette Score")

# DBSCAN clustering
from sklearn.cluster import DBSCAN

db = DBSCAN(eps=10, min_samples=2).fit(X)
labels = db.labels_
beer['cluster_db'] = labels
beer.sort_values('cluster_db')
beer.groupby('cluster_db').mean()
pd.scatter_matrix(X, c=colors[beer.cluster_db], figsize=(10, 10), s=100)