background
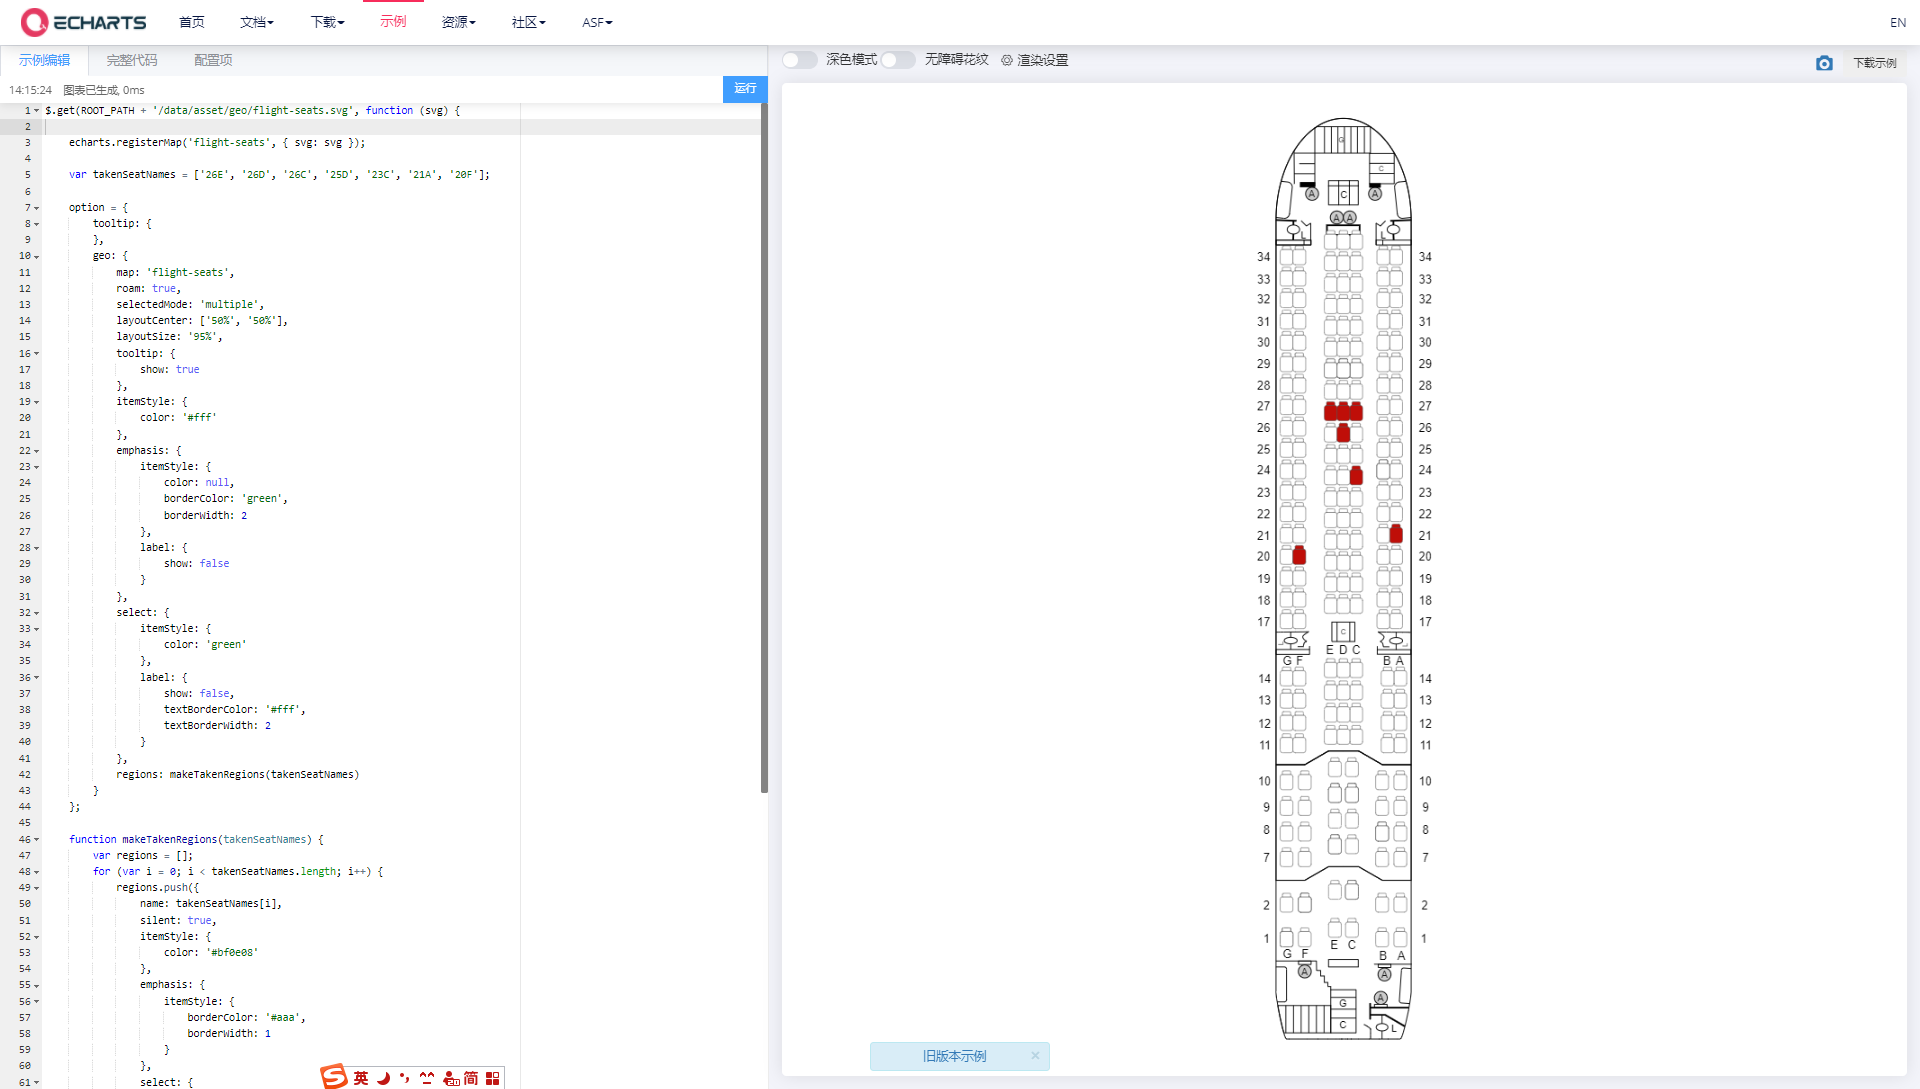
Recently, I saw an example of flight seat selection in the official echarts. I feel very good. It can be expanded and reduced. When the mouse is placed on the seat, the seat number can be displayed, and the seat can be selected by default. So I took a little time during the 5.1 holiday to write an article, deeply study and analyze this example, and analyze the complete code of this example. First, let's take a look at the rendering of the example.
Realization idea
The code is implemented using echarts, which mainly uses the knowledge of svg and user-defined map. Complete code of the example
In the function of seat selection, we can also simply realize it by using the technical means of div layout and background map, but it does not support scaling. When there are many locations and you want to see the details, you need to use svg, which can expand and reduce the vector graphics that will not be distorted. With the rendering ability and scalability of echarts, the functions can achieve a good user experience. The main features of this example are as follows
- There are three default seat states: unselected (white), self selected (green) and selected by others (red)
- It can be expanded and reduced, and the picture is not distorted and clear
- The seat number can be displayed by placing the mouse on the seat
- Portability. If you change an svg file, you can change it to theater seat selection or meeting room seat arrangement
- Simple and fast, with less than 100 lines of code
code analysis
Get svg
In the sample code, the first step is to get an svg file.
$.get(ROOT_PATH + '/data/asset/geo/flight-seats.svg', function (svg) {
  // ....
})
Use jquery to obtain an svg file. The full path of svg is https://cdn.jsdelivr.net/gh/apache/echarts-website@asf-site/examples/data/asset/geo/flight-seats.svg Click to access. But it shows this.

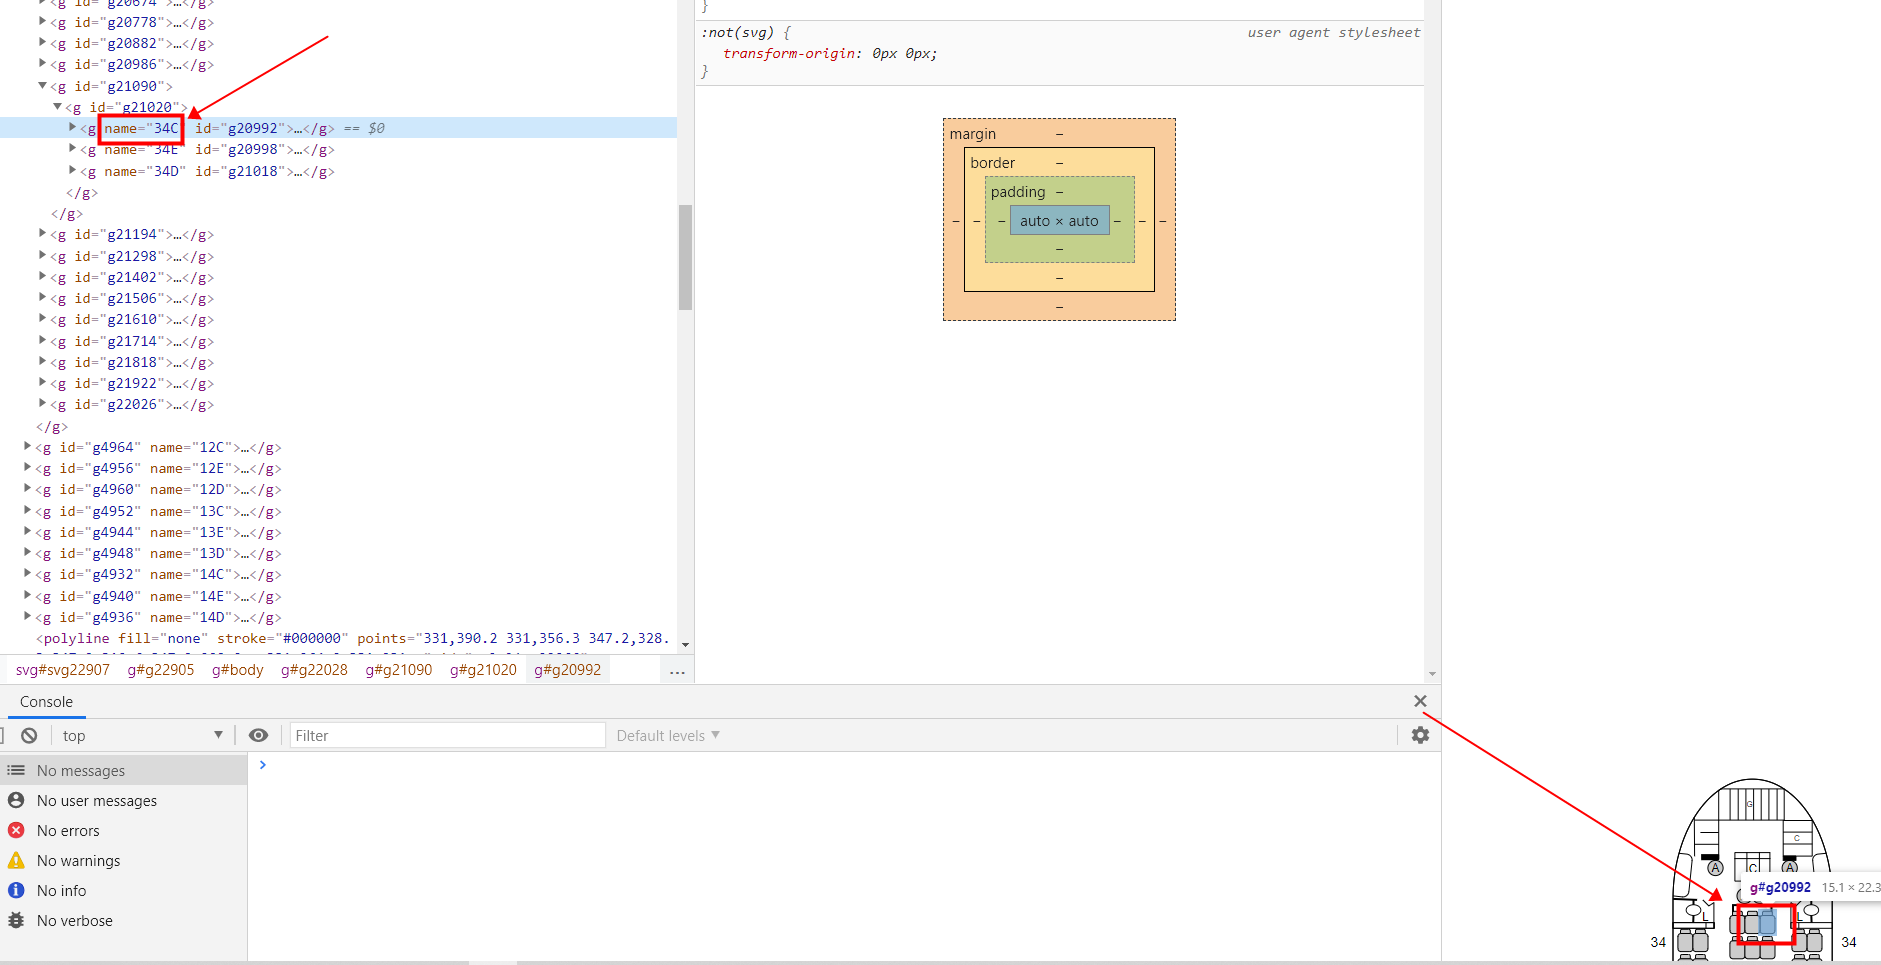
Only one aircraft head is displayed, which is because the svg is too large. To see the complete, you need to use special svg viewing software. The svg obtained using jquery is the encoding of the svg file. We can debug, print the content of svg and have a look.
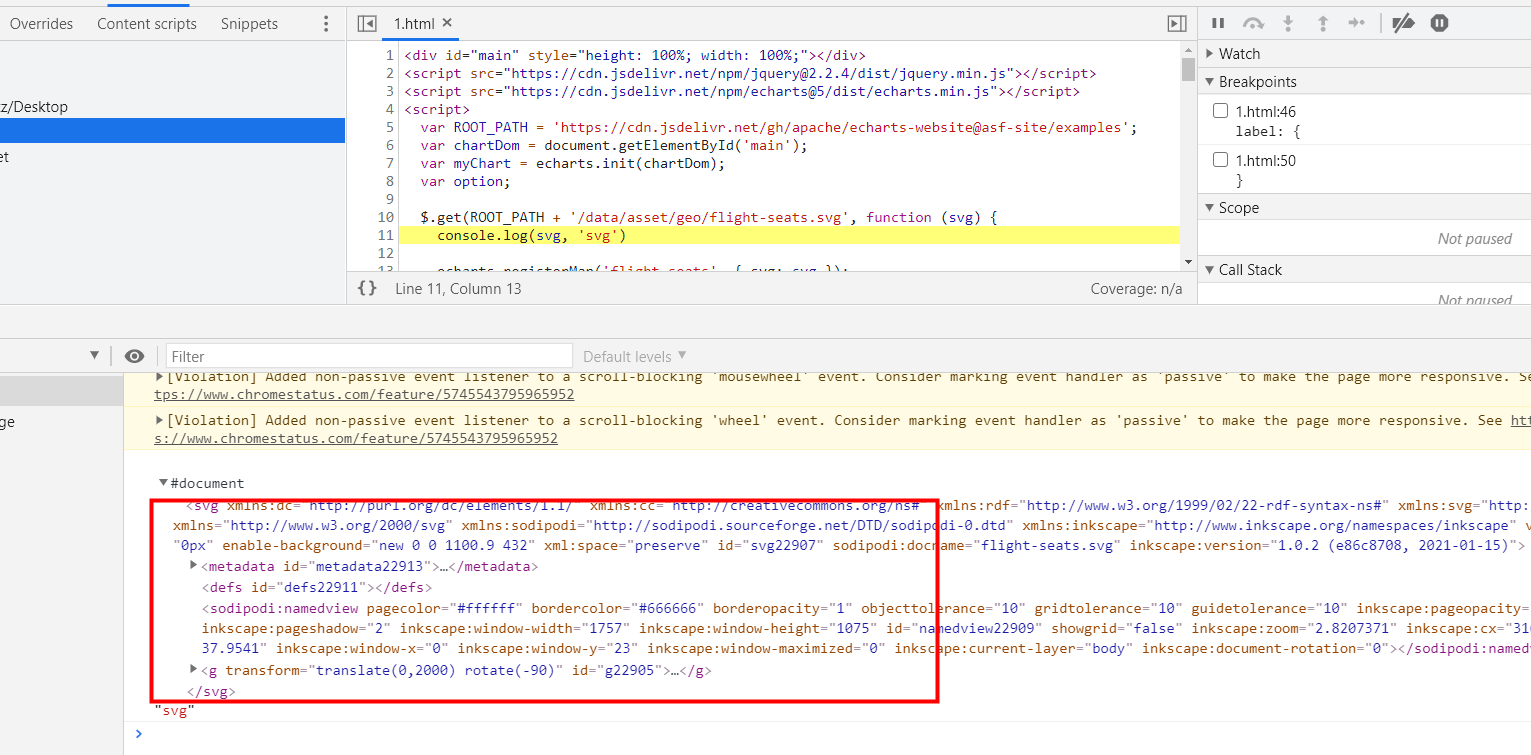
Here you can see the details of svg.
Register custom maps
Ecarts can be combined with maps to achieve custom location coordinate layout rendering. But not limited to Baidu, Gaode map. He also supports registering an svg that matches map data as a map. Let's take a look at the api for registering custom maps of echorts.
registerMap
Complete explanation Click here to view
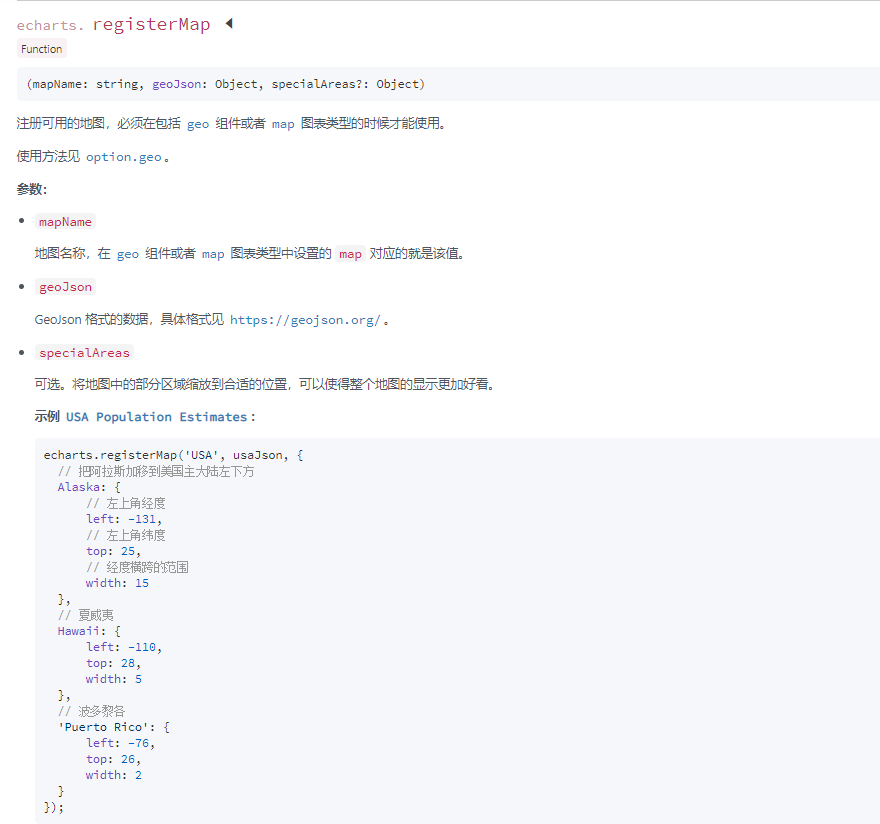
The general meaning of the document is that you can configure a geojason thing, and then ecarts can analyze the internal coordinates, render and support search. Documents related to geo in echarts. https://echarts.apache.org/zh/option.html#geo This component can configure some name s, colors, indexes, whether they can be selected, colors after interaction, and hover effects.
Here is a little extension of GeoJSON, which is also my first contact. It is a format for encoding various geographic data structures. A programmed map that uses some special attributes to express lines, surfaces, points and colors on the map. Area. The following geometry types are supported with GeoJSON: Point, LineString, Polygon, MultiPoint, MultiLineString, and MultiPolygon. Geometric objects with other attributes are feature objects. Feature sets are contained in FeatureCollection objects. What is said here is wrong. Welcome to clap bricks and preach to dispel doubts. Related documents If you want to talk about it here, with my current knowledge, it must not be thorough enough. If you are interested, you can leave a message in the comment area. The next article can bring you a more detailed analysis of geojson.
To return to the main line, the registerMap method actually converts svg into a standard map coordinate system. However, the location of the transformed map is not based on longitude and latitude, but because of name.
echarts.registerMap('flight-seats', { svg: svg });Well, that's all for the meaning of the above code. In fact, every api involves a lot of knowledge. As long as you are careful and have the spirit of exploration, you will learn more and better than others. Knowledge is coherent and does not exist alone. Draw inferences from one instance and learn Tao only when you have a thorough understanding.
Configuration of geo components
There are many components in ecarts, such as brush (region selection component), parallel (parallel coordinate system), timeline and calendar (calendar coordinate system). One of them is geo, geographic coordinate system component. The geographic coordinate system component is used for map drawing, and supports the drawing of scatter diagram and line set on the geographic coordinate system. All configuration items related to geo components are OK Query here To detailed analysis. This case uses this component, so let's see how the example is configured.
geo: {
    map: 'flight-seats',
    roam: true,
    selectedMode: 'multiple',
    layoutCenter: ['50%', '50%'],
    layoutSize: '95%',
    tooltip: {
        show: true
    },
    itemStyle: {
        color: '#fff'
    },
    emphasis: {
        itemStyle: {
            color: null,
            borderColor: 'green',
            borderWidth: 2
        },
        label: {
            show: false
        }
    },
    select: {
        itemStyle: {
            color: 'green'
        },
        label: {
            show: false,
            textBorderColor: '#fff',
            textBorderWidth: 2
        }
    },
    regions: makeTakenRegions(takenSeatNames)
}
The above is the configuration of geo components in the example. Let's analyze each configuration item carefully.
map
First, the map points to a custom map 'flight seats' that we just registered
map: 'flight-seats',
roam
roam keyword is used to configure whether to turn on mouse zoom and pan roaming. Not on by default. If you only want to turn on zoom or pan, you can set it to 'scale' or 'move'. Set true to enable all
selectedMode
As the literal meaning is, the selectedMode field is used to configure the selection mode, indicating whether multiple selections are supported. It is off by default. Boolean values and strings are supported. The string value can be selected from 'single' for single selection or 'multiple' for multiple selection.
layoutCenter, layoutSize
Used to adjust the initial position of the instance of echarts in the dom container.
tooltip
Whether to turn on the tooltip effect. After it is turned on, the mouse will be placed on the seat and a text will prompt the current seat.
itemStyle
Default style of seat, configuration color and font
emphasis
Polygon and label styles in the highlighted state.
select
Polygon and label styles when selected.
regions
Configure styles for specific areas in the map. What is passed in here is an array of formatted seat information that has been selected, Default already selected The data format of each item is like this
{
    name: '26E',
    silent: true,
    itemStyle: {
        color: '#bf0e08'
    },
    emphasis: {
        itemStyle: {
            borderColor: '#aaa',
            borderWidth: 1
        }
    },
    select: {
        itemStyle: {
            color: '#bf0e08'
        }
    }
}
One of the attributes is called silent, which is used to determine whether the graph does not respond to and trigger mouse events. The default is false, that is, respond to and trigger mouse events.
So far, the echarts configuration of this example has been explained. The coordinate system here is not found by longitude and latitude, but by the name of each seat. Therefore, the corresponding name can be found in svg. The value of name must be unique.
In this example, in addition to the core configuration, there are two auxiliary functions. Let's have a look.
makeTakenRegions function
This function is to convert the defined selected seat data into formatted seat style data. The following are the default selected seats defined.
var takenSeatNames = ['26E', '26D', '26C', '25D', '23C', '21A', '20F'];
geoselectchanged
At the end of this example, there is a listener function
myChart.on('geoselectchanged', function (params) {
    var selectedNames = params.allSelected[0].name.slice();

    // Remove taken seats.
    for (var i = selectedNames.length - 1; i >= 0; i--) {
        if (takenSeatNames.indexOf(selectedNames[i]) >= 0) {
            selectedNames.splice(i, 1);
        }
    }

    console.log('selected', selectedNames);
});
What are these lines of code for? When we click a seat, there is a click event, which is used to deal with the interaction after clicking, and then obtain the seat selected by the current user. The geoselected world is an event that switches the selected state of a map area in geo. This event will be triggered when the user clicks to select. Related documents
We can debug this function to see what params is
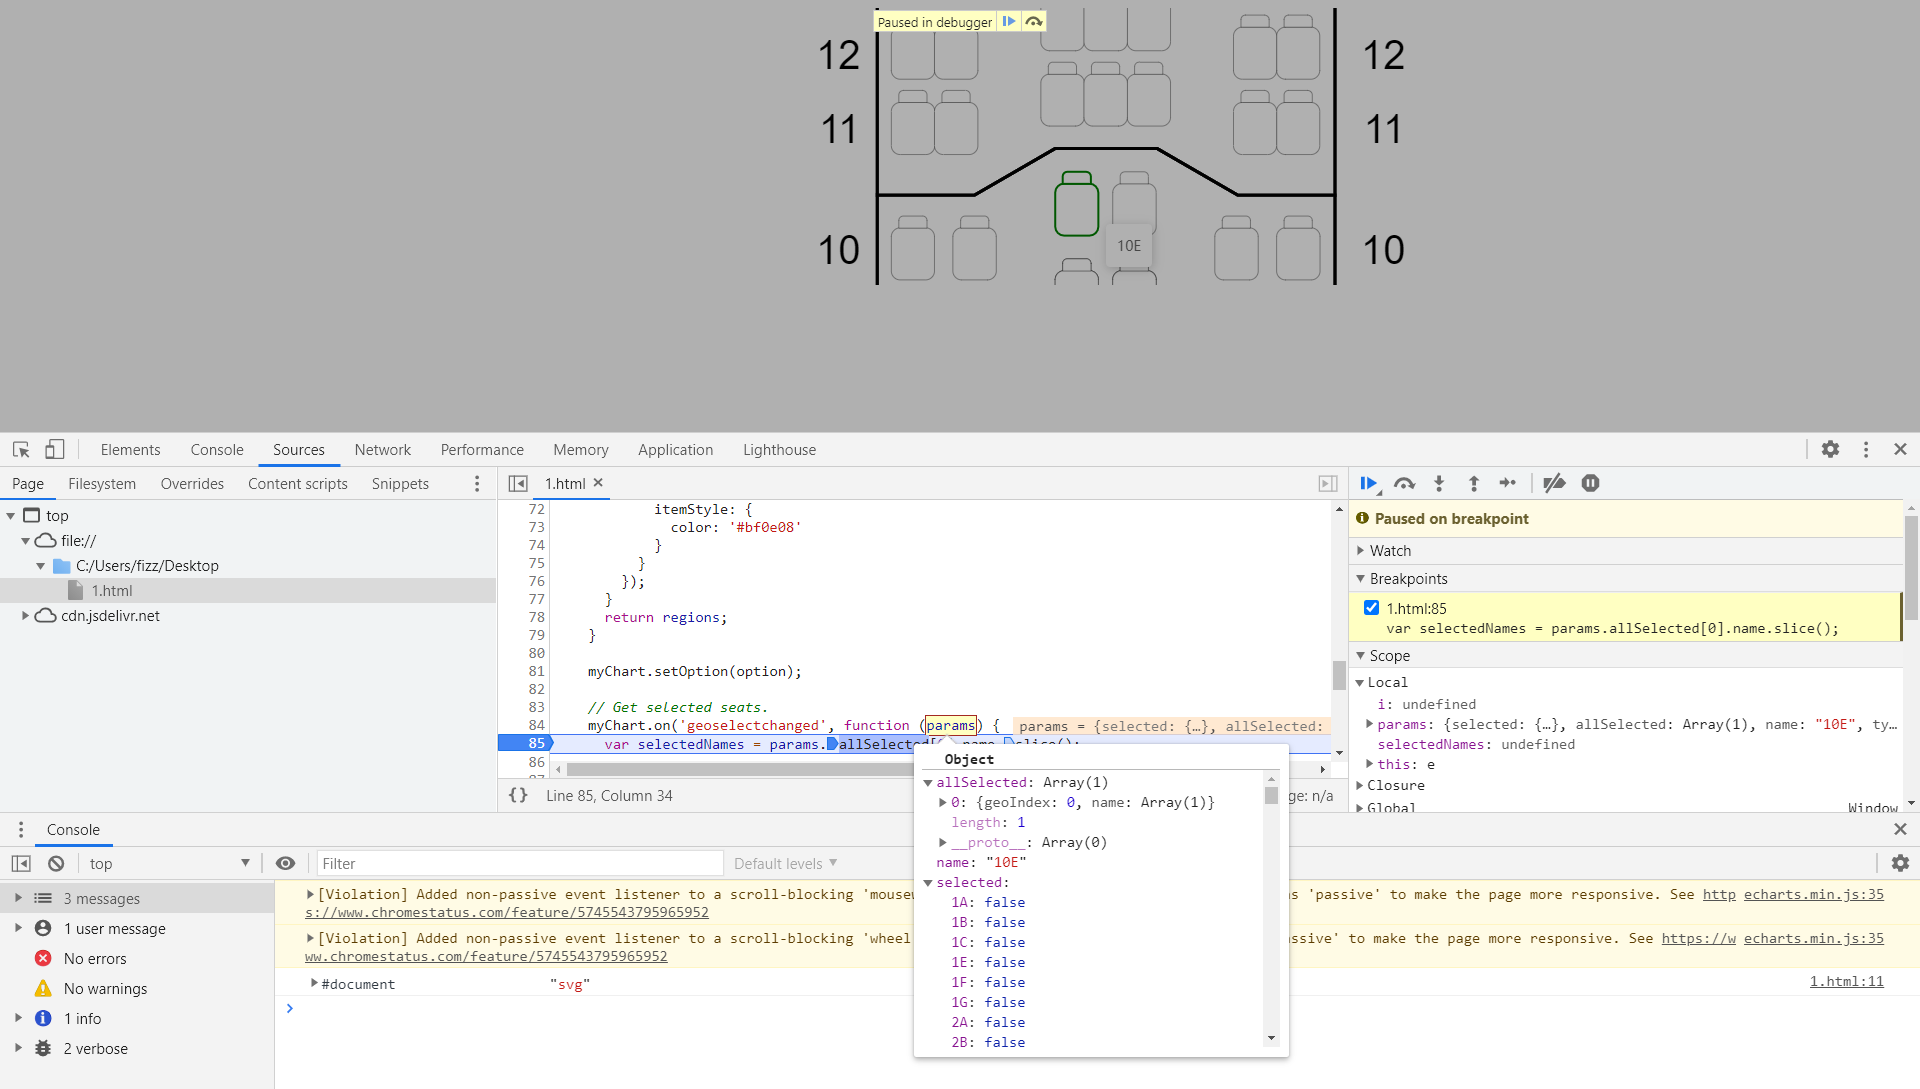
This function is used to click the seats that have been selected without selecting them. The use scenario of this function is to obtain the list of seats selected by the current user. For example, after selecting seats, the user should send the seat information to the background for saving. The main function is to judge whether the selected seat has been selected by others. If it has been selected, it will be eliminated.
infer other things from one fact
three
After analyzing the code, we understand the meaning of each configuration item, so we strike while the iron is hot to do a similar connection question, so as to draw inferences from one instance and learn from others. Requirements, define an svg file with 6 blocks, and use it to select seats. Define mysvg file
<?xml version="1.0" encoding="UTF-8" standalone="no"?>
<svg width="600px" height="600px" version="1.1" xmlns="http://www.w3.org/2000/svg">

    <g name="a1">
        <rect x="20" y="20" rx="20" ry="20" width="100" fill="#cccccc" stroke="#000000" height="100" />
    </g>
    <g name="a2">
        <rect x="20" y="120" rx="20" ry="20" width="100" fill="#cccccc" stroke="#000000" height="100" />
    </g>
    <g name="a3">
        <rect x="20" y="220" rx="20" ry="20" width="100" fill="#cccccc" stroke="#000000" height="100" />
    </g>
    <g name="a4">
        <rect x="20" y="320" rx="20" ry="20" width="100" fill="#cccccc" stroke="#000000" height="100" />
    </g>

</svg>
html code
<div id="main" style="height:600px;width:600px"></div>
<script src="https://cdn.jsdelivr.net/npm/jquery@2.2.4/dist/jquery.min.js"></script>
<script src="https://cdn.jsdelivr.net/npm/echarts@5/dist/echarts.min.js"></script>
<script>
    var chartDom = document.getElementById('main');
    var myChart = echarts.init(chartDom);
    var option;
    $.get('/mysvg.svg', function (svg) {
        echarts.registerMap('flight-seats', { svg: svg });

        var takenSeatNames = ['a1'];

        option = {
            tooltip: {
            },
            geo: {
                map: 'flight-seats',
                roam: true,
                selectedMode: 'multiple',
                layoutCenter: ['50%', '50%'],
                layoutSize: '95%',
                tooltip: {
                    show: true
                },
                itemStyle: {
                    color: '#fff'
                },
                emphasis: {
                    itemStyle: {
                        color: null,
                        borderColor: 'green',
                        borderWidth: 2
                    },
                    label: {
                        show: false
                    }
                },
                select: {
                    itemStyle: {
                        color: 'green'
                    },
                    label: {
                        show: false,
                        textBorderColor: '#fff',
                        textBorderWidth: 2
                    }
                },
                regions: makeTakenRegions(takenSeatNames)
            }
        };

        function makeTakenRegions(takenSeatNames) {
            var regions = [];
            for (var i = 0; i < takenSeatNames.length; i++) {
                regions.push({
                    name: takenSeatNames[i],
                    silent: true,
                    itemStyle: {
                        color: '#bf0e08'
                    },
                    emphasis: {
                        itemStyle: {
                            borderColor: '#aaa',
                            borderWidth: 1
                        }
                    },
                    select: {
                        itemStyle: {
                            color: '#bf0e08'
                        }
                    }
                });
            }
            return regions;
        }

        myChart.setOption(option);

        // Get selected seats.
        myChart.on('geoselectchanged', function (params) {
            var selectedNames = params.allSelected[0].name.slice();

            // Remove taken seats.
            for (var i = selectedNames.length - 1; i >= 0; i--) {
                if (takenSeatNames.indexOf(selectedNames[i]) >= 0) {
                    selectedNames.splice(i, 1);
                }
            }

            console.log('selected', selectedNames);
        });
    })
</script>
design sketch

Attention
- Every seat and clickable area in the svg file must be wrapped with the g tag, and the name attribute must be defined on the g tag
- When defining geojson, svg cannot point to a text
epilogue
If you have mastered the geo custom map of echarts, you can make a lot of examples Like this
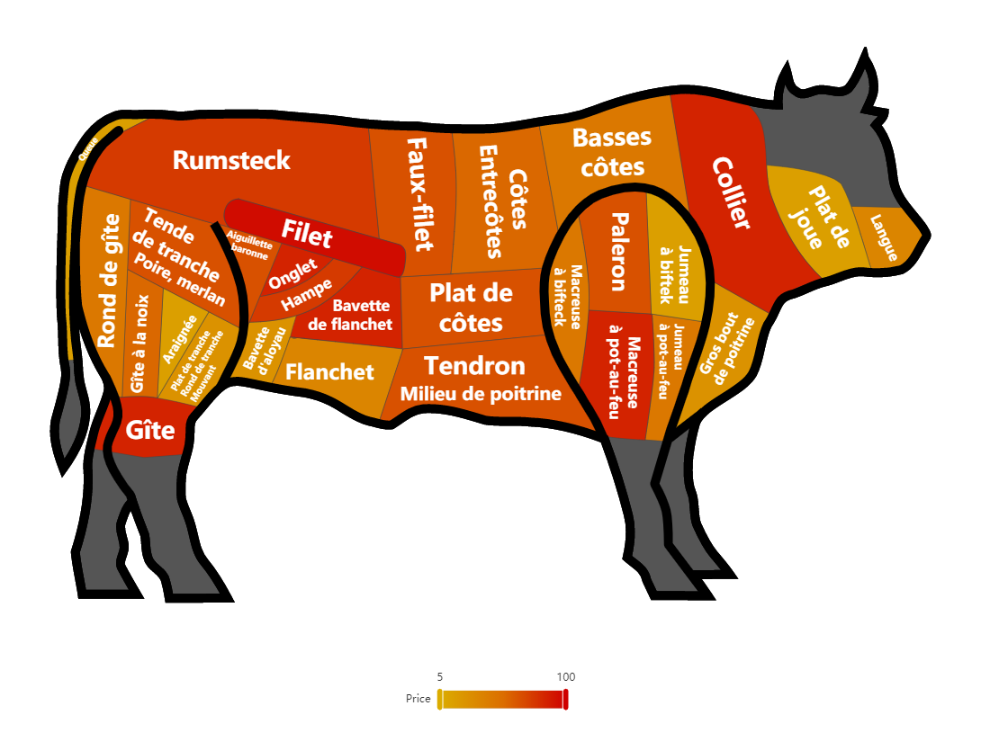
In this way
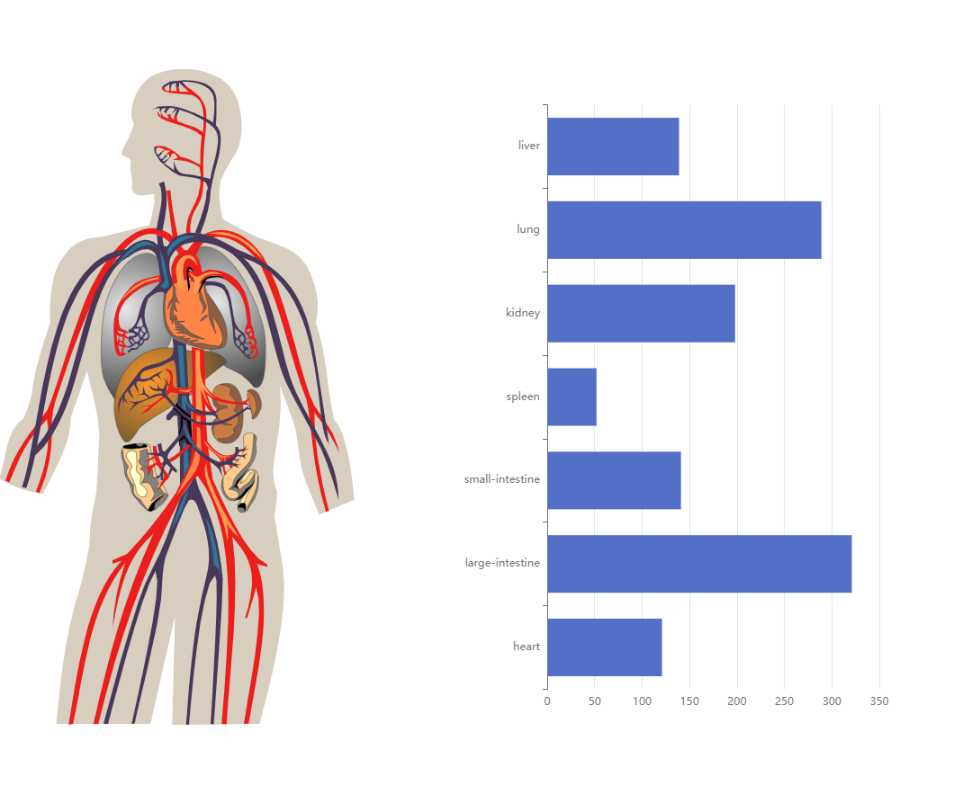
There's something like this
Just one svg file and a few name s, you can make the map chart you want. Finally, I would like to give you a word: Little steps, no even thousands of miles; If you don't accumulate small streams, you can't form rivers and seas