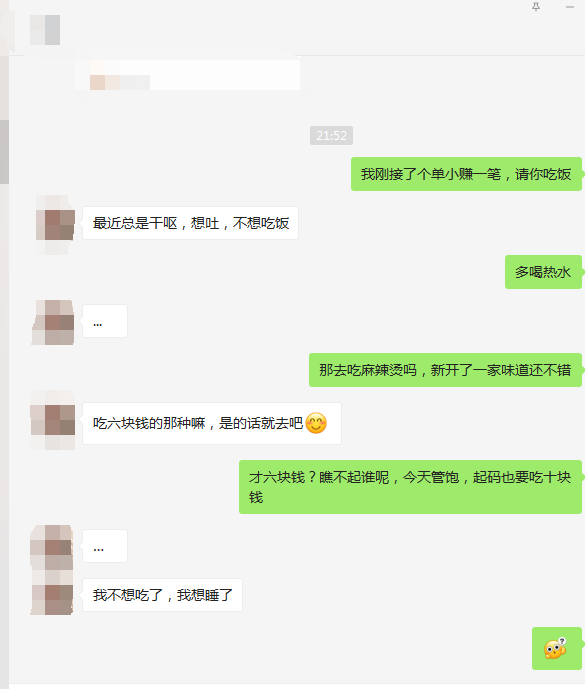
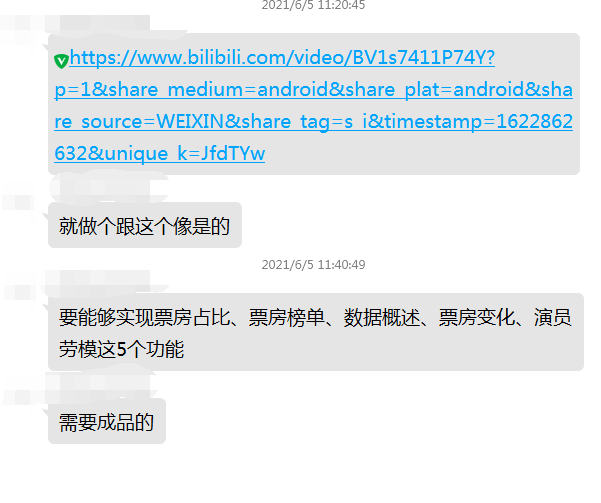
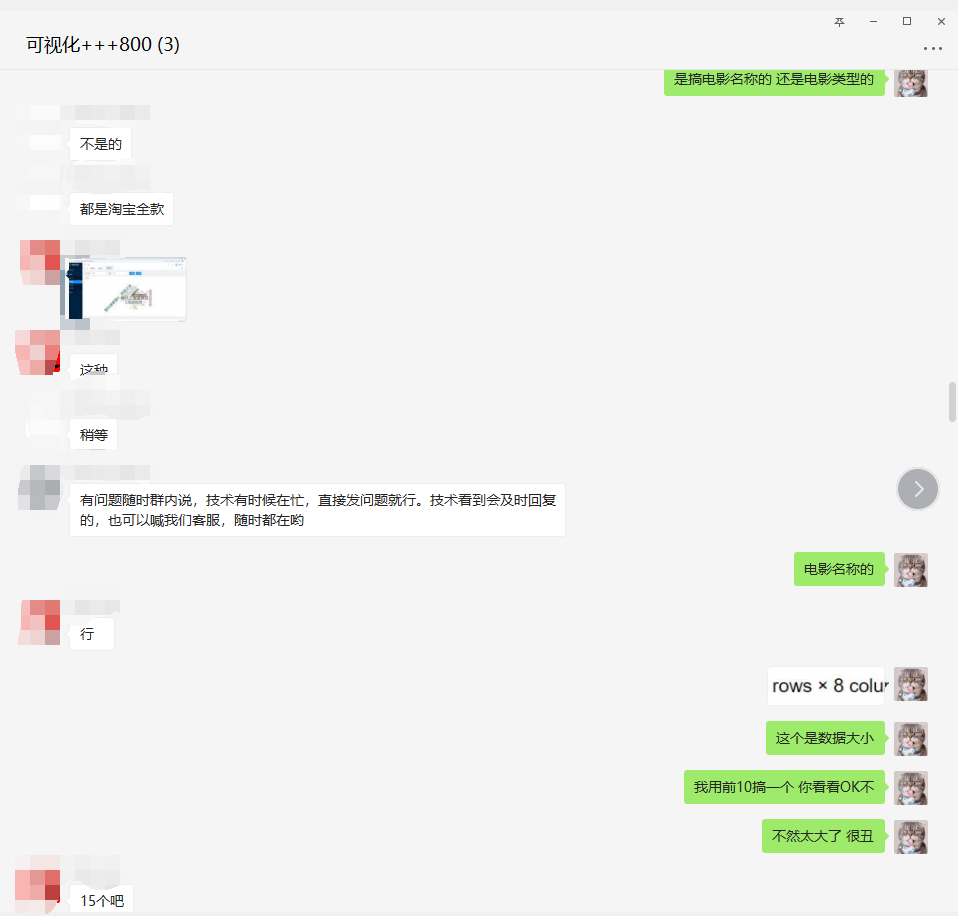
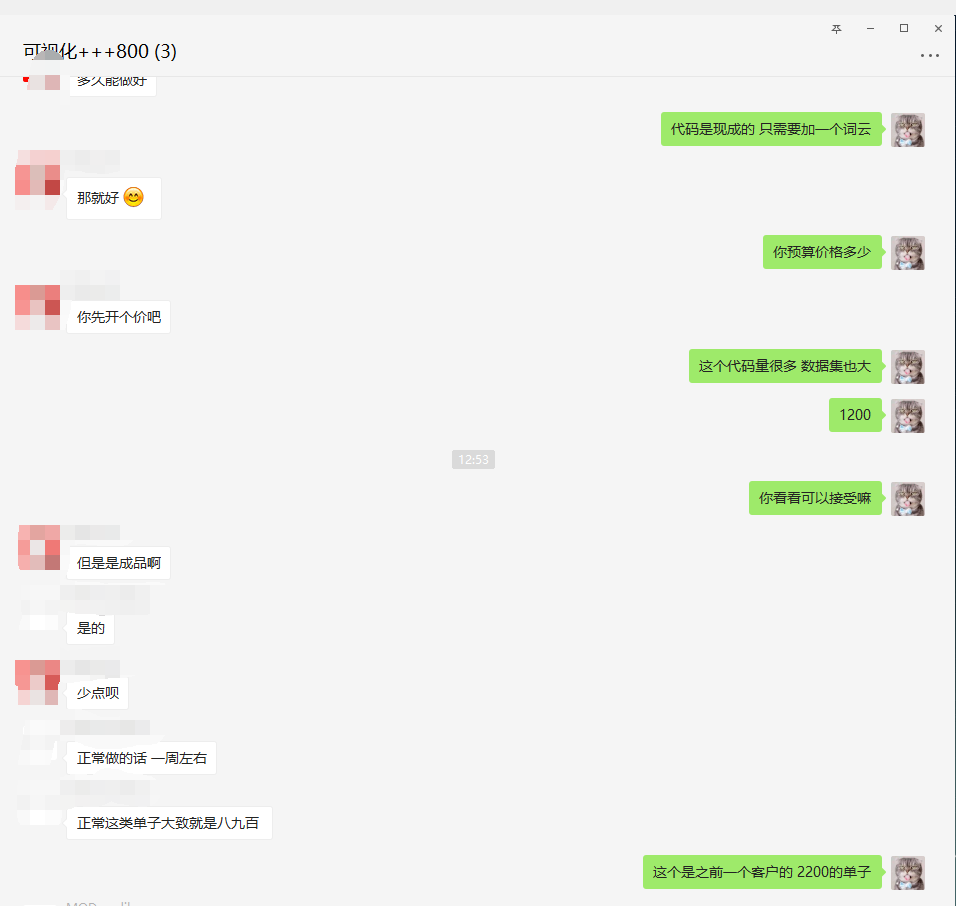
Last weekend, we received a 1200 order. The customer service took a 10% commission and got 1000. It was completed in two hours. I was very happy. In fact, there are not many such orders. The technical difficulty is low, but the price is high. We commonly call them "fish picking list". Thinking of making money, I invited the goddess to dinner, but I was ruthlessly rejected!
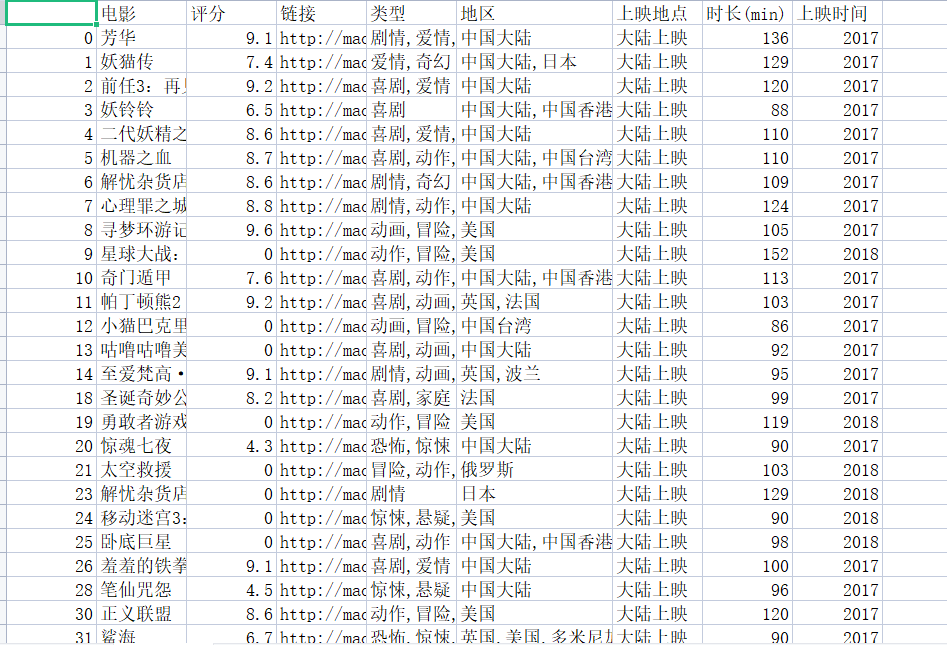
Effect display

Tool preparation
Data source: Cat's eye movie
Development environment: win10, python3 seven
Development tools: pycharm, Chrome
Analysis of project ideas
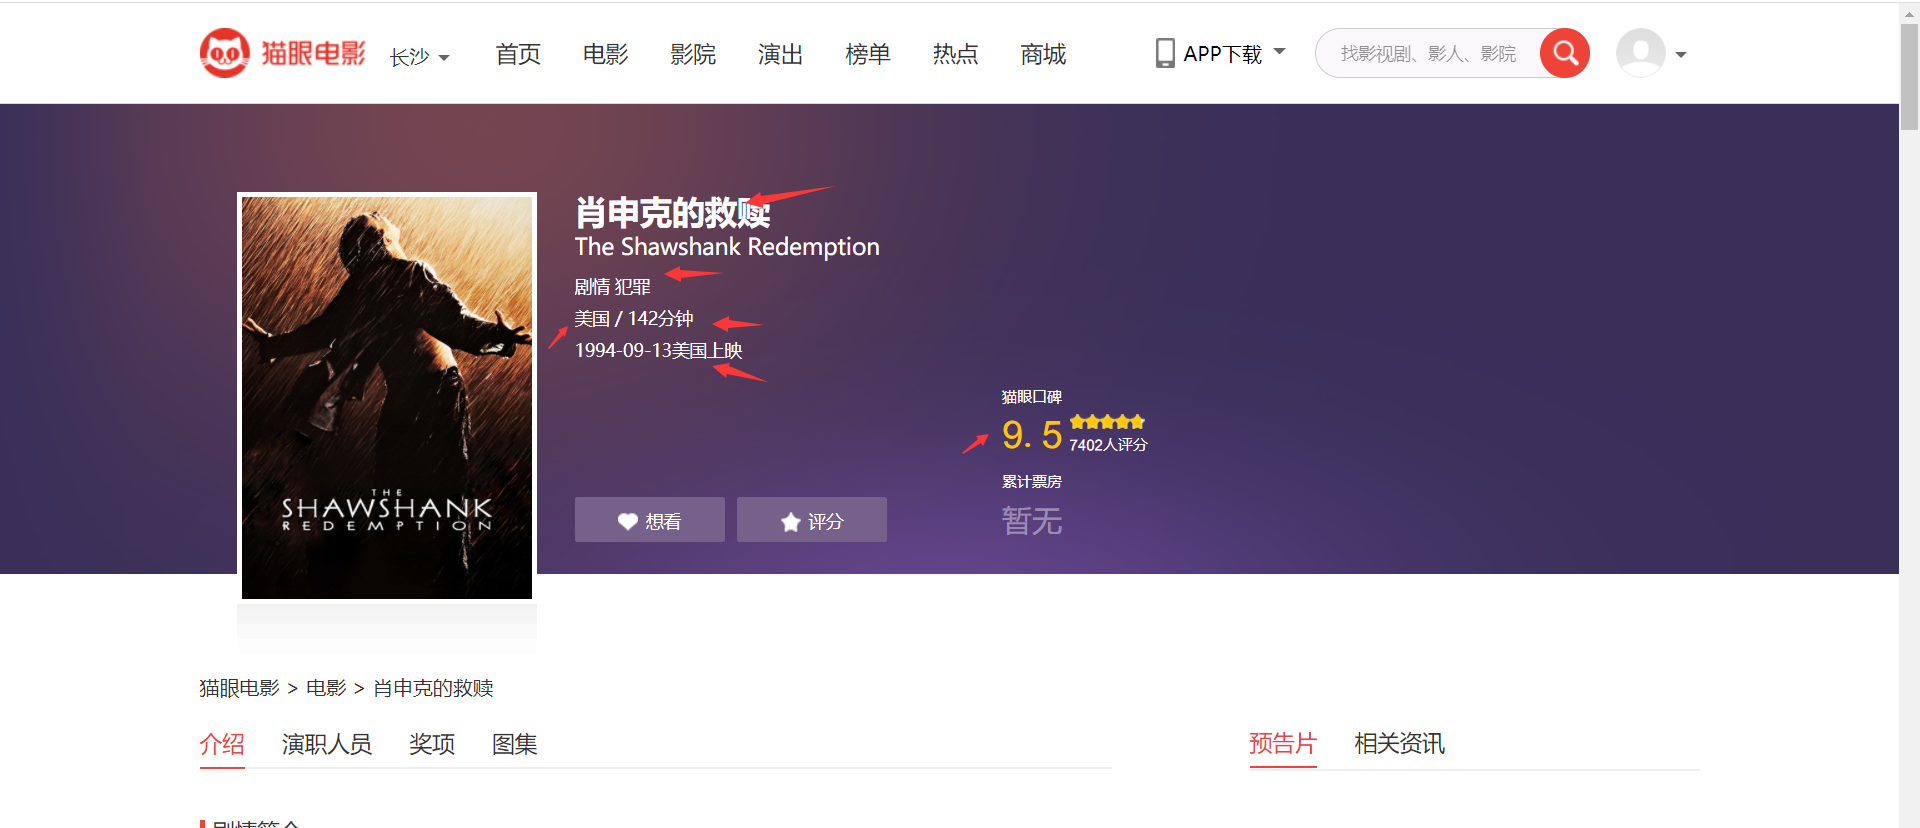
First, collect all the movie information of cat's eye movie
Take the top 100 list of cat's eye as an example
Get movie information:
- Movie title
- Film rating
- Movie link
- Film type
- Location of the film
- place
- Film duration
- Film duration
Parsing web page data information
Analyze the jump link of the home page
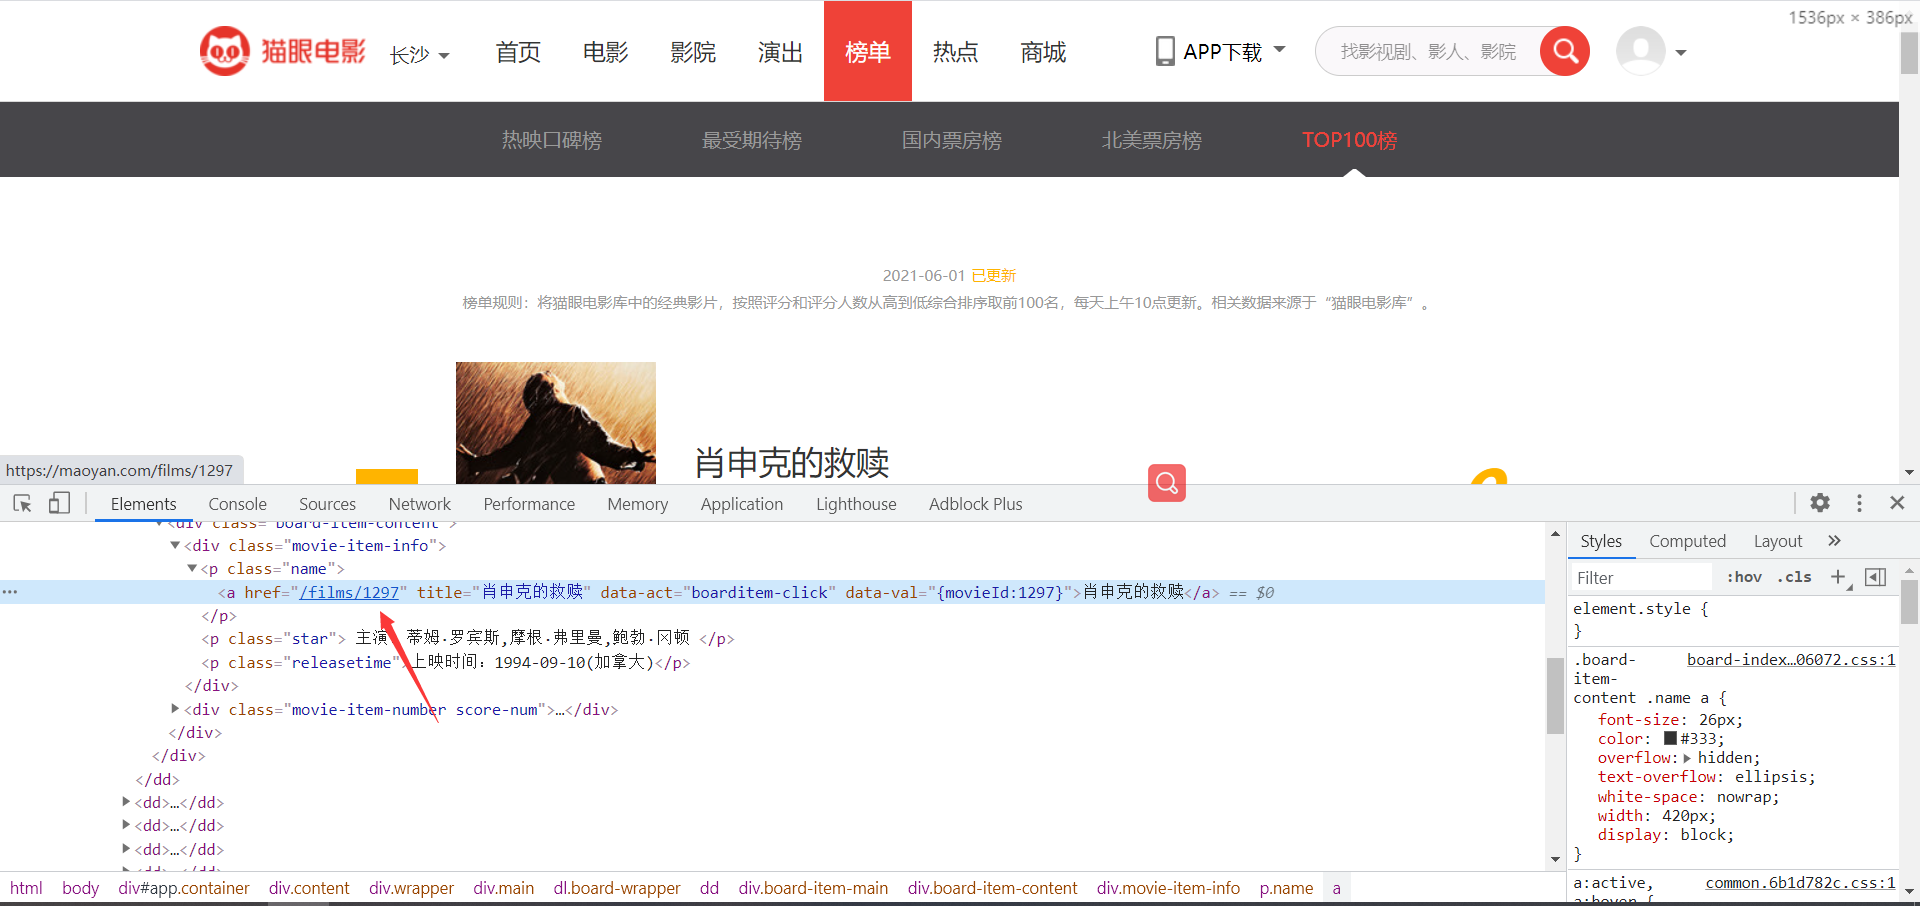
The score on the cat's eye details page is encrypted, so we directly retrieve the score information from the home page
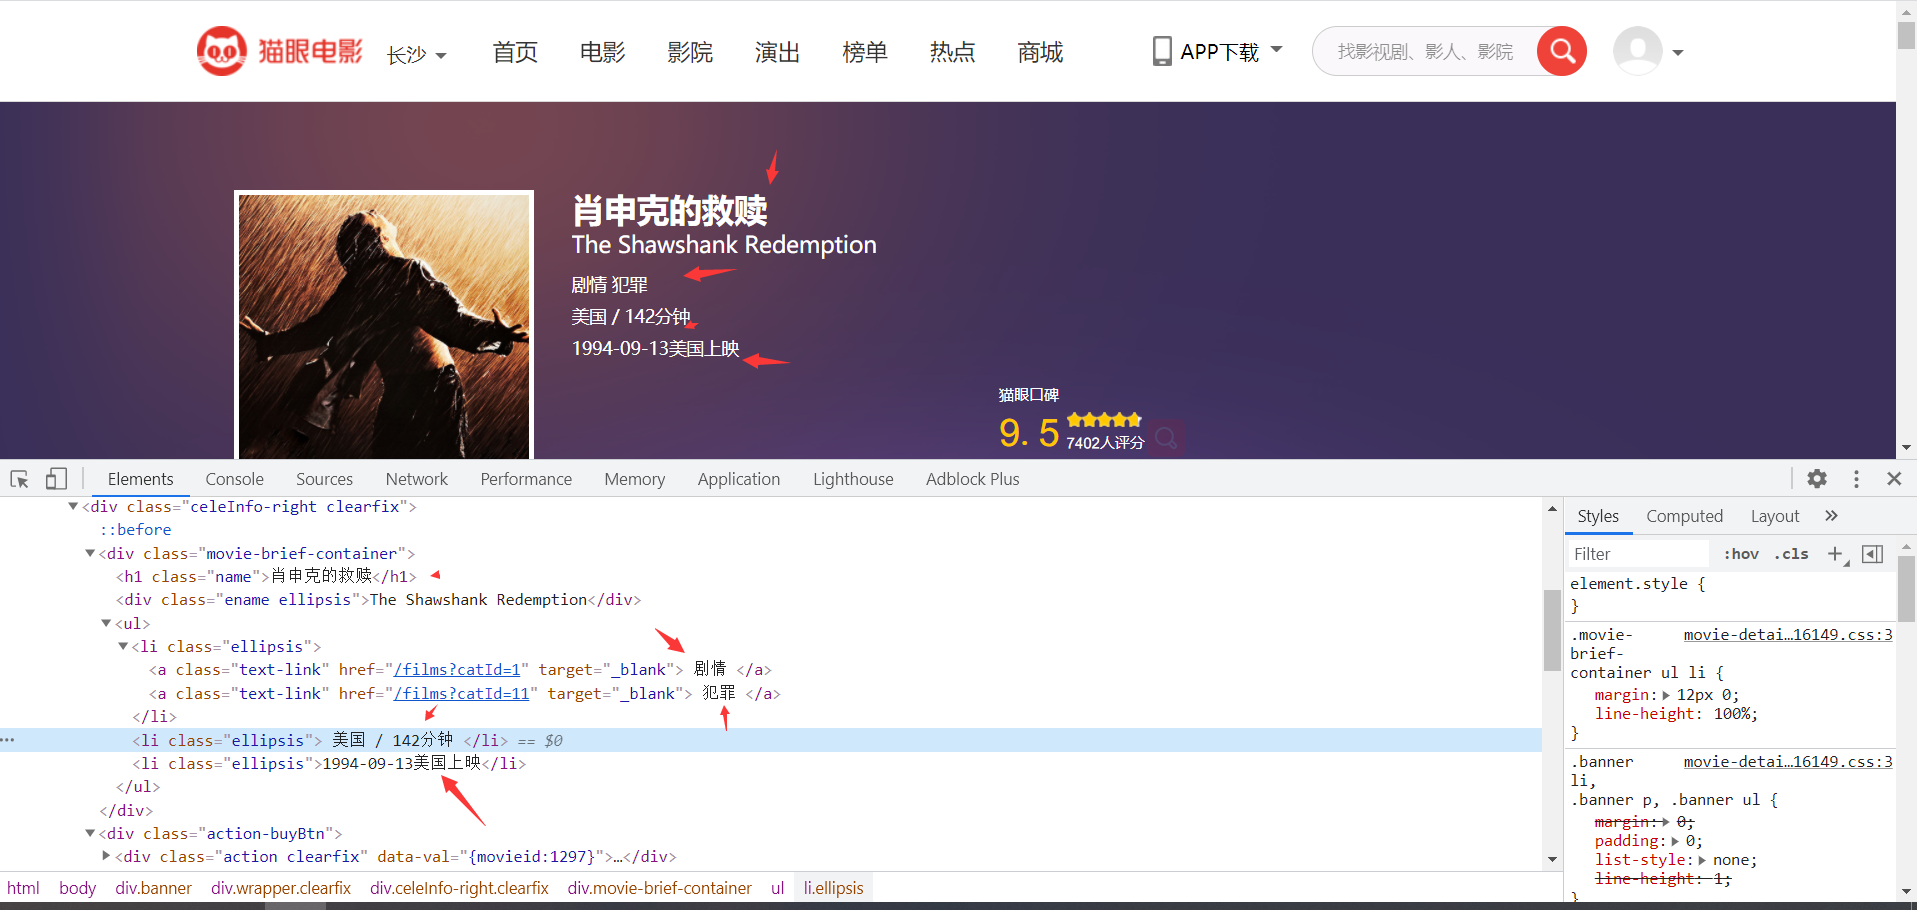
Extract data on the details page
Save the data in csv form for data visualization
Tools needed for data visualization
import pandas as pd
import numpy as np
import jieba
from wordcloud import WordCloud
import matplotlib.pyplot as plt
# get_ipython().run_line_magic('matplotlib', 'inline')
Rendering display

Source code display:
Reptiles:
#!/usr/bin/env python
# -*- coding: utf-8 -*-
# @Time: June 5, 2021
# @File    : demo4.py

import requests
from fake_useragent import UserAgent
from lxml import etree
import time

# Random request header
ua = UserAgent()

# To build a request, you need to change it on the web page. If the request is not available, you need to refresh the web page and get the verification code
headers = {
    'Accept': 'text/html,application/xhtml+xml,application/xml;q=0.9,image/webp,image/apng,*/*;q=0.8,application/signed-exchange;v=b3;q=0.9',
    'Cookie': '__mta=244176442.1622872454168.1622876903037.1622877097390.7; uuid_n_v=v1; uuid=6FFF6D30C5C211EB8D61CF53B1EFE83FE91D3C40EE5240DCBA0A422050B1E8C0; _csrf=bff9b813020b795594ff3b2ea3c1be6295b7453d19ecd72f8beb9700c679dfb4; Hm_lvt_703e94591e87be68cc8da0da7cbd0be2=1622872443; _lxsdk_cuid=1770e9ed136c8-048c356e76a22b-7d677965-1fa400-1770e9ed136c8; _lxsdk=6FFF6D30C5C211EB8D61CF53B1EFE83FE91D3C40EE5240DCBA0A422050B1E8C0; ci=59; recentCis=59; __mta=51142166.1622872443578.1622872443578.1622876719906.2; Hm_lpvt_703e94591e87be68cc8da0da7cbd0be2=1622877097; _lxsdk_s=179dafd56bf-06d-403-d81%7C%7C12',
    'User-Agent': str(ua.random)
}


def RequestsTools(url):
    '''
    Crawler request tool function
    :param url: Request address
    :return: HTML Object for xpath extract
    '''
    response = requests.get(url, headers=headers).content.decode('utf-8')
    html = etree.HTML(response)
    return html


def Index(page):
    '''
    Homepage function
    :param page: the number of pages
    :return:
    '''
    url = 'https://maoyan.com/board/4?offset={}'.format(page)
    html = RequestsTools(url)
    # Detail page address suffix
    urls_text = html.xpath('//a[@class="image-link"]/@href')
    # score
    pingfen1 = html.xpath('//i[@class="integer"]/text()')
    pingfen2 = html.xpath('//i[@class="fraction"]/text()')

    for i, p1, p2 in zip(urls_text, pingfen1, pingfen2):
        pingfen = p1 + p2
        urs = 'https://maoyan.com' + i
        # Requests are too frequent anyway
        time.sleep(2)
        Details(urs, pingfen)


def Details(url, pingfen):
    html = RequestsTools(url)
    dianyan = html.xpath('//h1[@class="name"]/text()) # movie name
    leixing = html.xpath('//li[@class="ellipsis"]/a/text()) # type
    diqu = html.xpath('/html/body/div[3]/div/div[2]/div[1]/ul/li[2]/text()') # Read sum
    timedata = html.xpath('/html/body/div[3]/div/div[2]/div[1]/ul/li[3]/text()') # time
    for d, l, b, t in zip(dianyan, leixing, diqu, timedata):
        countyr = b.replace('\n', '').split('/')[0] # region
        shichang = b.replace('\n', '').split('/')[1] # duration
        f = open('cat eye.csv', 'a')
        f.write('{}, {}, {}, {}, {}, {}, {}\n'.format(d, pingfen, url, l, countyr, shichang, t))
        print(d, pingfen, url, l, countyr, shichang, t )


for page in range(0, 11):
    page *= 10
    Index(page)
visualization
#!/usr/bin/env python
# coding: utf-8
# Load data analysis common library
import pandas as pd
import numpy as np
import jieba
from wordcloud import WordCloud
import matplotlib.pyplot as plt
# get_ipython().run_line_magic('matplotlib', 'inline')
# In[3]:
path='./maoyan.csv'
df=pd.read_csv(path,sep=',',encoding='utf-8',index_col=False)
df.drop(df.columns[0],axis=1,inplace=True)
df.dropna(inplace=True)
df.drop_duplicates(inplace=True)
df.head(10)
#View the structure of the data
df.info()
print(df.columns)
# In[11]:
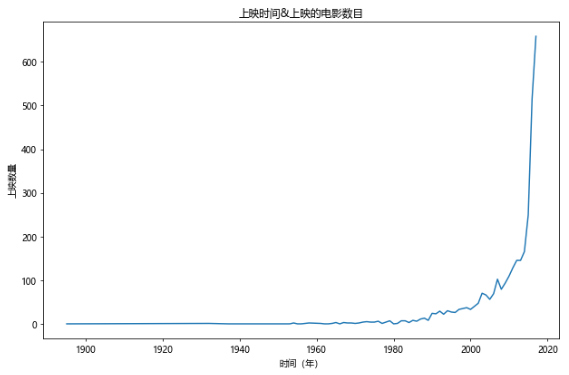
#Year & the number of films released. The number of films released in 2018 and beyond is only announced on the cat's eye at present, which is uncertain. We will eliminate the films released in 2018 and beyond first
fig,ax=plt.subplots(figsize=(9,6),dpi=70)
df[df[u'Release time']<2018][u'Release time'].value_counts().sort_index().plot(kind='line',ax=ax)
ax.set_xlabel(u'Time (year)')
ax.set_ylabel(u'Number of releases')
ax.set_title(u'Release time&Number of films released')
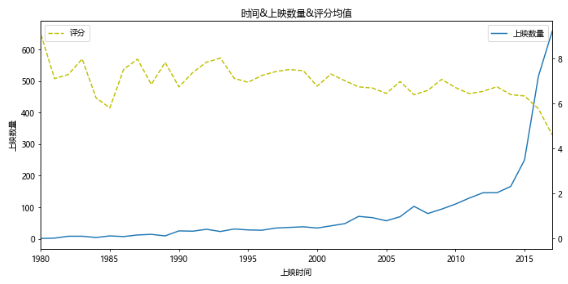
#Based on the above figure, we will draw another diagram of the relationship between release time, release quantity and score
#However, due to the small amount of data before 1980 and inaccurate score, the main analysis areas are concentrated in 1980-2017
x=df[df[u'Release time']<2018][u'Release time'].value_counts().sort_index().index
y=df[df[u'Release time']<2018][u'Release time'].value_counts().sort_index().values
y2=df[df[u'Release time']<2018].sort_values(by=u'Release time').groupby(u'Release time').mean()[u'score'].values
fig,ax=plt.subplots(figsize=(10,5),dpi=70)
ax.plot(x,y,label=u'Number of releases')
ax.set_xlim(1980,2017)
ax.set_xlabel(u'Release time')
ax.set_ylabel(u'Number of releases')
ax.set_title(u'time&Number of releases&Average score')
ax2=ax.twinx()
ax2.plot(x,y2,c='y',ls='--',label=u'score')
ax.legend(loc=1)
ax2.legend(loc=2)
# Solve the problem of Chinese garbled code and no negative value on the coordinate axis
plt.rcParams['font.sans-serif'] =['Microsoft YaHei']
plt.rcParams['axes.unicode_minus'] = False
# In[12]:
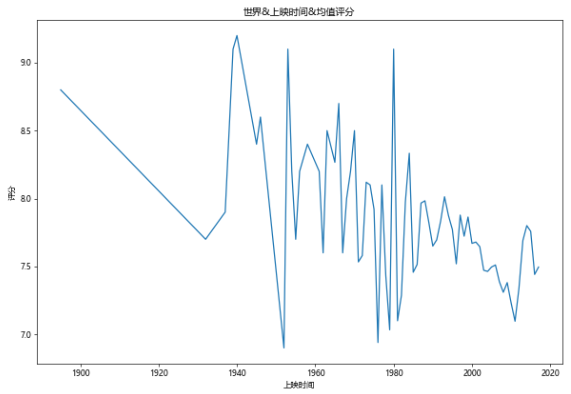
#World & release time & average score
fig,ax=plt.subplots(figsize=(10,7),dpi=60)
df[df[u'score']>0].groupby(u'Release time').mean()[u'score'].plot(kind='line',ax=ax)
ax.set_ylabel(u'score')
ax.set_title(u'world&Release time&Mean score')
# In[13]:
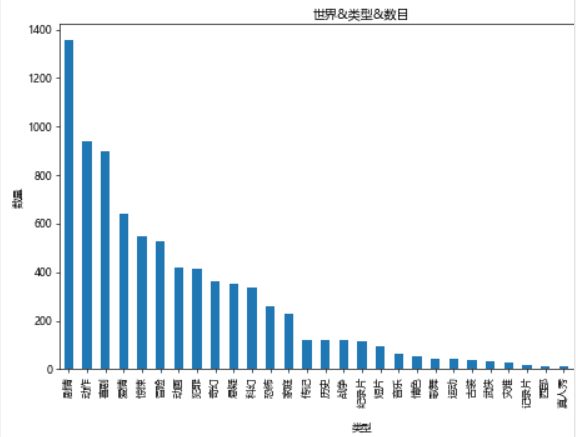
#Number of films of all types in the world
#Cut the type into the smallest unit, and then make statistics
types=[]
for tp in df[u'type']:
ls=tp.split(',')
for x in ls:
types.append(x)
tp_df=pd.DataFrame({u'type':types})
fig,ax=plt.subplots(figsize=(9,6),dpi=60)
tp_df[u'type'].value_counts().plot(kind='bar',ax=ax)
ax.set_xlabel(u'type')
ax.set_ylabel(u'quantity')
ax.set_title(u'world&type&number')
# In[14]:
#Distribution of film duration and score
#There is a problem: in fact, there are some films that have not been rated. We should ban them here
x=df[df[u'score']>0].sort_values(by=u'duration(min)')[u'duration(min)'].values
y=df[df[u'score']>0].sort_values(by=u'duration(min)')[u'score'].values
fig,ax=plt.subplots(figsize=(9,6),dpi=70)
ax.scatter(x,y,alpha=0.6,marker='o')
ax.set_xlabel(u'duration(min)')
ax.set_ylabel(u'quantity')
ax.set_title(u'Film duration&Score distribution')
#You can see the score
i=0
c0=[]
c1=[]
c2=[]
c3=[]
c4=[]
c5=[]
c6=[]
c7=[]
for x in df[u'region']:
if u'Chinese Mainland' in x:
c0.append(df.iat[i, 0])
c1.append(df.iat[i, 1])
c2.append(df.iat[i, 2])
c3.append(df.iat[i, 3])
c4.append(df.iat[i, 4])
c5.append(df.iat[i, 5])
c6.append(df.iat[i, 6])
c7.append(df.iat[i, 7])
i=i+1
china_df=pd.DataFrame({u'film':c0, u'score':c1,u'link':c2, u'type':c3,u'region':c4, u'Place of release':c5,u'duration(min)':c6,u'Release time':c7})
# In[16]:
#The comparison time range of China world average score is 1980-2017
x1 = df[df[u'score']>0].groupby(u'Release time').mean()[u'score'].index
y1 = df[df[u'score']>0].groupby(u'Release time').mean()[u'score'].values
x2 = china_df[china_df[u'score']>0].groupby(u'Release time').mean()[u'score'].index
y2 = china_df[china_df[u'score']>0].groupby(u'Release time').mean()[u'score'].values
fig,ax=plt.subplots(figsize=(12,9),dpi=60)
ax.plot(x1,y1,ls='-',c='DarkTurquoise',label=u'world')
ax.plot(x2,y2,ls='--',c='Gold',label=u'China')
ax.set_title(u'China&World average score')
ax.set_xlabel(u'time')
ax.set_xlim(1980,2017)
ax.set_ylabel(u'score')
ax.legend()
# In[17]:
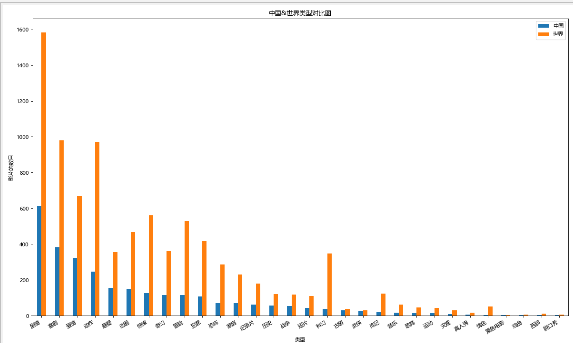
#Type and number of releases: a comparison between China and the world
#Because types are mixed, in order to facilitate statistics, first write a function to segment types
# In[18]:
#The write split function passes in a Sreies type object and returns a type split DataFrame
#What is passed in here is a type of Series
def Cuttig_type(typeS):
types=[]
types1=[]
for x in typeS:
if len(x)<4:
# print x
types1.append(x)
ls=x.split(',')
for i in ls:
types.append(i)
types.extend(types1)
df=pd.DataFrame({u'type':types})
return pd.DataFrame(df[u'type'].value_counts().sort_values(ascending=False))
# In[19]:
#Comparison of film types between China and the world
df1=Cuttig_type(china_df[u'type'])
df2=Cuttig_type(df[u'type'])
trans=pd.concat([df1,df2],axis=1)
trans.dropna(inplace=True)
trans.columns=[u'China',u'world']
fig,ax=plt.subplots(figsize=(15,9),dpi=80)
trans.plot(kind='bar',ax=ax)
fig.autofmt_xdate(rotation=30)
ax.set_title(u'China&World type comparison chart')
ax.set_xlabel(u'type')
ax.set_ylabel(u'Number of films')
# In[20]:
#Then there is the scattered distribution, China & World & time length & score distribution
y = df[df[u'score'] > 0].sort_values(by=u'duration(min)')[u'score'].values
x = df[df[u'score'] > 0].sort_values(by=u'duration(min)')[u'duration(min)'].values
y2 = china_df[china_df[u'score'] > 0].sort_values(by=u'duration(min)')[u'score'].values
x2 = china_df[china_df[u'score'] > 0].sort_values(by=u'duration(min)')[u'duration(min)'].values
fig, ax = plt.subplots(figsize=(10,7), dpi=80)
ax.scatter(x, y, c='DeepSkyBlue', alpha=0.6, label=u'world')
ax.scatter(x2, y2, c='Salmon', alpha=0.7, label=u'China')
ax.set_title(u'China&Distribution of world scores')
ax.set_xlabel(u'duration(min)')
ax.set_ylabel(u'score')
ax.legend(loc=4)
# In[25]:
dfs=df[(df[u'Release time']>1980)&(df[u'Release time']<2019)]
# for x in range(0,len(dfs)):
# print(dfs.iat[x,0],dfs.iat[x,-1])
df666 = dfs['film'][:15]
wl = ",".join(df666.values)
# Write the txt after word segmentation to the text file
# fenciTxt = open("fenciHou.txt","w+")
# fenciTxt.writelines(wl)
# fenciTxt.close()
# Set word cloud l
wc = WordCloud(background_color="white", #Set background color
# mask=imread('shen.jpg'), #Set background picture
# max_words=2000, #Set the maximum number of words displayed
font_path="C:\\Windows\\Fonts\\simkai.ttf", # Set to regular italics
#Set the Chinese font so that the word cloud can be displayed (the default font of the word cloud is "DroidSansMono.ttf font library", which does not support Chinese)
max_font_size=60, #Set font maximum
random_state=30, #Set the number of randomly generated States, that is, the number of color schemes
)
myword = wc.generate(wl) #Generate word cloud
wc.to_file('result.jpg')
# Show word cloud
plt.imshow(myword)
plt.axis("off")
plt.show()
# In[41]:
Summary
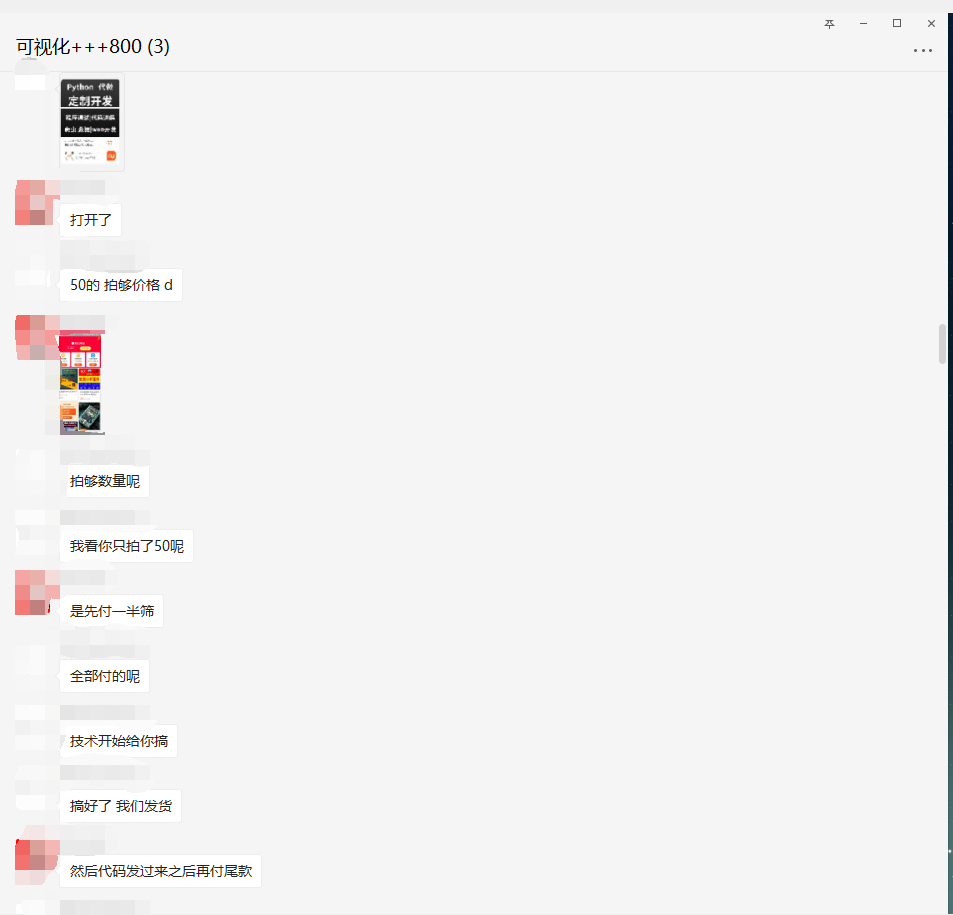
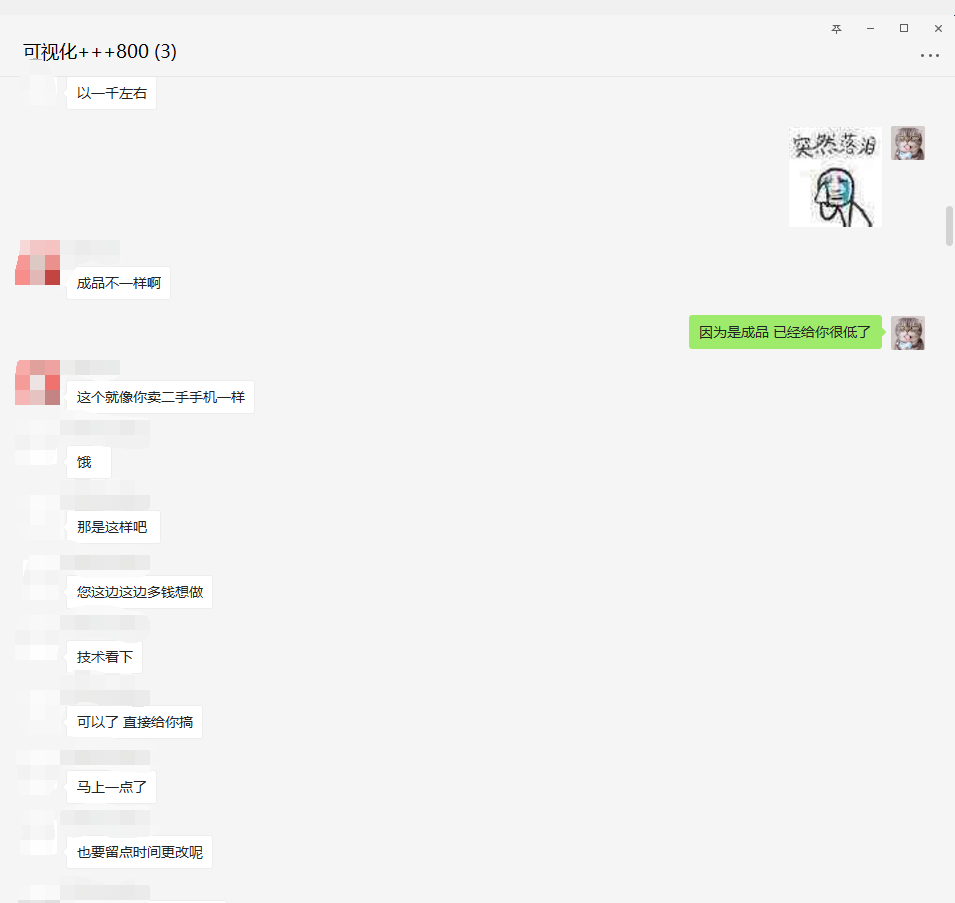
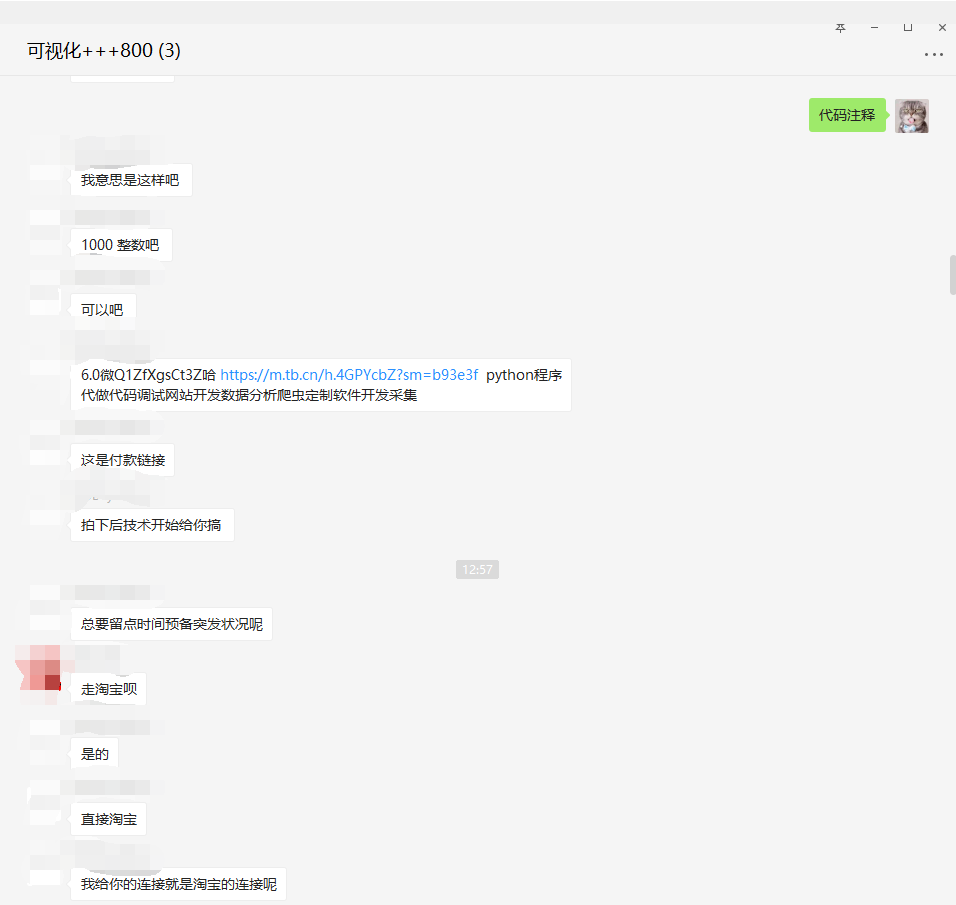
The source code has been provided, so I won't analyze the source code. If it's useful to you, please give it three times. Thank you very much. Finally, I'll show you the process of receiving orders.
PS: you must go to the third-party platform to receive and take orders!!!
PS: you must go to the third-party platform to receive and take orders!!!
PS: you must go to the third-party platform to receive and take orders!!!
PS: you must go to the third-party platform to receive and take orders!!!
PS: you must go to the third-party platform to receive and take orders!!!
PS: you must go to the third-party platform to receive and take orders!!!
If you want to take orders [if you have technology, don't participate in Xiaobai], or if you want to exercise your technology, you can privately trust me in the background and note what technology you will know and which order you want to take, I will pull you in. In addition, I sorted out some materials for Xiaobai, which can be obtained by myself.
① More than 3000 Python e-books
② Python development environment installation tutorial
③ Python 400 set self-study video
④ Common vocabulary of software development
⑤ Python learning Roadmap
⑥ Project source code case sharing
If you can use it, you can take it away directly. In my QQ technology exchange group (pure technology exchange and resource sharing, advertising is not allowed) you can take it away by yourself. The group number is 949222410.