Ideas and steps of kNN algorithm
The basic idea of kNN algorithm is as follows:
Suppose there are n samples in the sample set, which have discrimination on m features, and they belong to one of 0 or 1 respectively. Suppose the eigenvector of the ith sample is
(
a
i
1
,
a
i
2
,
⋯
,
a
i
m
)
(a_{i1},a_{i2},\cdots,a_{im})
(ai1,ai2,⋯,aim). There is an object to be classified, and its eigenvector is
(
b
1
,
b
2
,
⋯
,
b
m
)
(b_1,b_2,\cdots,b_m)
(b1,b2,⋯,bm). Calculate the Euclidean distance between the object to be classified and n samples in the feature space, that is, for each i(i=1,2,
⋯
\cdots
(n), calculation
∑
j
=
1
m
(
a
i
j
−
b
j
)
2
\sqrt{\sum_{j=1}^m (a_{ij}-b_j)^2}
∑j=1m(aij−bj)2
, find k samples closest to the object to be classified from n samples, and count the number of 0 and 1 in these k samples. kNN algorithm will classify the object to be classified into the category with a large number.
Example analysis and code implementation
Taking the problem that the number of sample sets is 10 and the number of features is 2 as an example, we introduce how to write kNN algorithm using python.
First import the required libraries:
import numpy as np
import matplotlib.pyplot as plt
from collections import Counter
Where matplotlib is convenient for our observation
Then define the sample set:
X_train = np.array([[1.2,2.8],
                    [1.9,3.7],
                    [2.5,3.8],
                    [4.8,7.9],
                    [9.7,2.6],
                    [5.6,7.8],
                    [10.8,2.7],
                    [13.7,22.7],
                    [5.48,14.82],
                    [11.23,17.16]])
Y_train = np.array([1,1,1,1,0,1,0,0,0,0])
Let's first look at the distribution of the sample set:
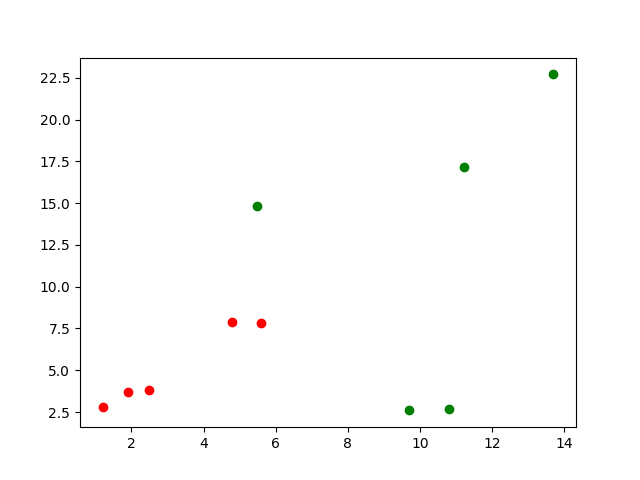
In the figure, the red point is class 1 and the green point is class 0
Next, enter the object to be classified:
x = np.array([6.653,10.849])
Calculated distance:
distance = []
for x_train in X_train:
    d = np.sqrt(np.sum((x-x_train)**2))
    distance.append(d)
Next, sort the ditance elements in the distance list and select the smallest k, but it should be noted that we don't care about the size of the distance itself. We care about which k samples in the sample set correspond to these k minimum distances, so as to judge how many k samples belong to class 0 and how many belong to class 1. Therefore, we use the argsort function in numpy next, It returns the index value.
out = np.argsort(distance)
Thus, the out list stores the sample serial number corresponding to the sorting of distance from small to large. Next, select the first k to judge which category they belong to.
k = 4

topK_y = [Y_train[i] for i in out[:k]]
r = Counter(topK_y)
s = r.most_common(1)[0][0]
print(s)
List topK_y stores the sample set y_ For the category corresponding to the k indexes in the train, the Counter function helps us count the number of each element in the list, most_ The common (T) function will return the most t-tuples. At this time, we need the most category, so t=1 and return [0] [0]
Output results:
The final output result is 1, which indicates that the algorithm classifies this object into class 1. Let's observe the following image:
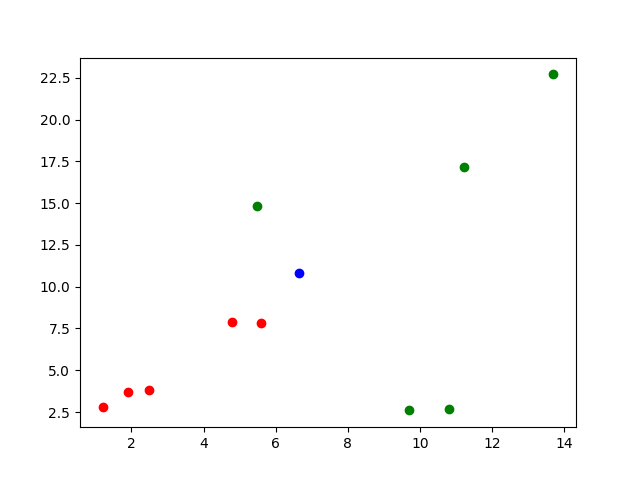
The blue dot is a new dot, so it is classified into the red dot set
The complete code is as follows:
import numpy as np
import matplotlib.pyplot as plt
from collections import Counter

#Define training set:
X_train = np.array([[1.2,2.8],
                    [1.9,3.7],
                    [2.5,3.8],
                    [4.8,7.9],
                    [9.7,2.6],
                    [5.6,7.8],
                    [10.8,2.7],
                    [13.7,22.7],
                    [5.48,14.82],
                    [11.23,17.16]])
Y_train = np.array([1,1,1,1,0,1,0,0,0,0])

#Samples to be judged:
x = np.array([6.653,10.849])

#Calculated distance:
distance = []
for x_train in X_train:
    d = np.sqrt(np.sum((x-x_train)**2))
    distance.append(d)

out = np.argsort(distance)

#Define k value:
k = 4

topK_y = [Y_train[i] for i in out[:k]]
r = Counter(topK_y)
s = r.most_common(1)[0][0]
print(s)

plt.scatter(X_train[Y_train==0,0],X_train[Y_train==0,1],c='g')
plt.scatter(X_train[Y_train==1,0],X_train[Y_train==1,1],c='r')
plt.scatter(x[0],x[1],c='b')
plt.show()
It should be pointed out that the specific value of k is not arbitrary and needs to be determined according to different situations.