WeChat Public Number: Operations Development Story by Joke
Preface
In Kubernetes, networks are provided through third-party network plug-ins, whose implementation is so complex that they often run into difficulties when troubleshooting network problems. So what is the way to monitor all the network connections in a cluster?
kubenurse is one such project that monitors all network connections in a cluster and provides monitoring metrics for Prometheus to collect.
Kubenurse
The deployment of kubenurse is simple, using Daemonset to deploy on cluster nodes, and Yaml files are located in the example directory of the project.
After successful deployment, a check request is sent to/alive every 5 seconds, and then a variety of methods are run inside it to detect the cluster network in an all-round way. To prevent excessive network traffic, the check results are cached for 3 seconds. Its detection mechanism is as follows: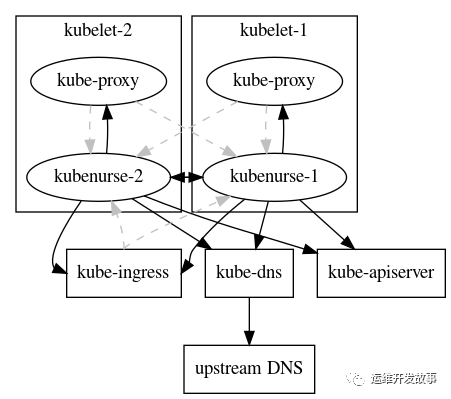 From the figure above, we can see that kubenurse detects ingress, dns, apiserver, kube-proxy.
All checks create public metrics that can be used to detect:
-
SDN network latency and errors
-
Network latency and errors between Kubelet s
-
Pod and apiserver communication problems
-
Ingress round-trip network latencies and errors
-
Service round-trip network latencies and errors (kube-proxy)
-
Kube-apiserver problem
-
Kube-dns (CoreDns) error
-
External DNS Resolution Error (ingress url Resolution)
Then these data are mainly reflected by two monitoring indicators:
-
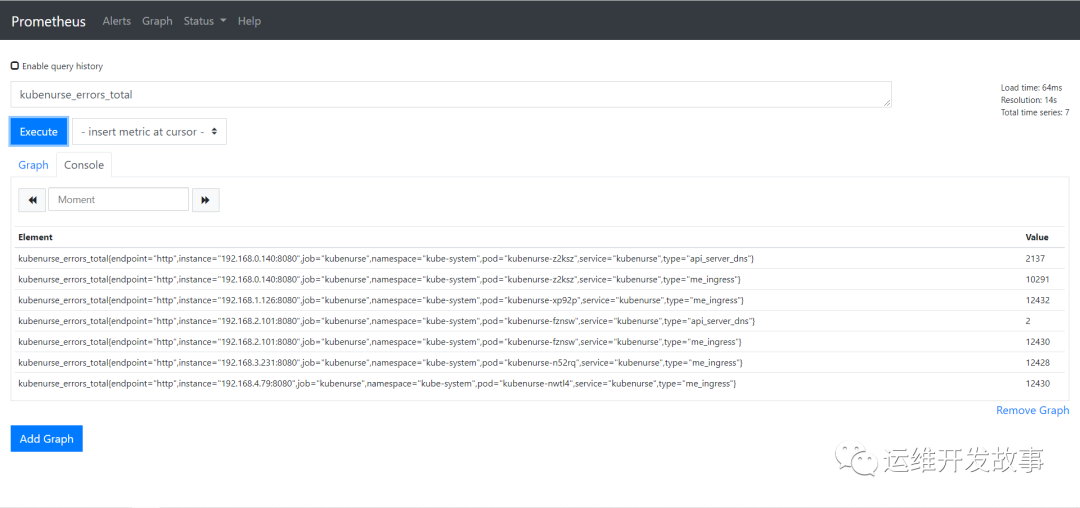
kubenurse_errors_total: error counters by error type
-
kubenurse_request_duration: Distribution of request time by type
These indicators are identified by Type, corresponding to several different detection targets:
-
api_server_direct: Detect API Server directly from node
-
api_server_dns: Detect API Server from node through DNS
-
me_ingress: Detect the Service through Ingress
-
me_service: Use Service to detect this service service
-
path_$KUBELET_HOSTNAME: mutual detection between nodes
Then these indicators are divided by P50, P90, P99 quantiles, which can confirm the status of cluster network according to different situations.
Install Deployment
Deployment is done directly here using official deployment files. But there are a few changes that need to be made. (1) First clone the code locally
git clone https://github.com/postfinance/kubenurse.git
(2) Enter the example directory and modify ingress.yaml configuration, mainly add the domain name, as follows.
---
apiVersion: extensions/v1beta1
kind: Ingress
metadata:
  annotations:
    kubernetes.io/ingress.class: nginx
  name: kubenurse
  namespace: kube-system
spec:
  rules:
  - host: kubenurse-test.coolops.cn
    http:
      paths:
      - backend:
          serviceName: kubenurse
          servicePort: 8080
(2) Update daemonset.yaml configuration, mainly changes ingress entry domain name, as follows.
---
apiVersion: apps/v1
kind: DaemonSet
metadata:
  labels:
    app: kubenurse
  name: kubenurse
  namespace: kube-system
spec:
  selector:
    matchLabels:
      app: kubenurse
  template:
    metadata:
      labels:
        app: kubenurse
      annotations:
        prometheus.io/path: "/metrics"
        prometheus.io/port: "8080"
        prometheus.io/scheme: "http"
        prometheus.io/scrape: "true"
    spec:
      serviceAccountName: nurse
      containers:
      - name: kubenurse
        env:
        - name: KUBENURSE_INGRESS_URL
          value: kubenurse-test.coolops.cn      # Where to change
        - name: KUBENURSE_SERVICE_URL
          value: http://kubenurse.kube-system.svc.cluster.local:8080
        - name: KUBENURSE_NAMESPACE
          value: kube-system
        - name: KUBENURSE_NEIGHBOUR_FILTER
          value: "app=kubenurse"
        image: "postfinance/kubenurse:v1.2.0"
        ports:
        - containerPort: 8080
          protocol: TCP
      tolerations:
      - effect: NoSchedule
        key: node-role.kubernetes.io/master
        operator: Equal
      - effect: NoSchedule
        key: node-role.kubernetes.io/control-plane
        operator: Equal
(4) Create a new ServiceMonitor to obtain the indicator data as follows:
apiVersion: monitoring.coreos.com/v1
kind: ServiceMonitor
metadata:
  name: kubenurse
  namespace: monitoring
  labels:
    k8s-app: kubenurse
spec:
  jobLabel: k8s-app
  endpoints:
  - port: "8080-8080"
    interval: 30s
    scheme: http
  selector:
    matchLabels:
     app: kubenurse
  namespaceSelector:
    matchNames:
    - kube-system
(5) Deploy the application and execute the following commands in the example directory.
kubectl apply -f .
(6) Wait for all applications to become running as follows.
# kubectl get all -n kube-system -l app=kubenurse
NAME                  READY   STATUS    RESTARTS   AGE
pod/kubenurse-fznsw   1/1     Running   0          17h
pod/kubenurse-n52rq   1/1     Running   0          17h
pod/kubenurse-nwtl4   1/1     Running   0          17h
pod/kubenurse-xp92p   1/1     Running   0          17h
pod/kubenurse-z2ksz   1/1     Running   0          17h

NAME                TYPE        CLUSTER-IP      EXTERNAL-IP   PORT(S)    AGE
service/kubenurse   ClusterIP   10.96.229.244   <none>        8080/TCP   17h

NAME                       DESIRED   CURRENT   READY   UP-TO-DATE   AVAILABLE   NODE SELECTOR   AGE
daemonset.apps/kubenurse   5         5         5       5            5           <none>          17h
(7) Go to prometheus to see if you are getting the data normally.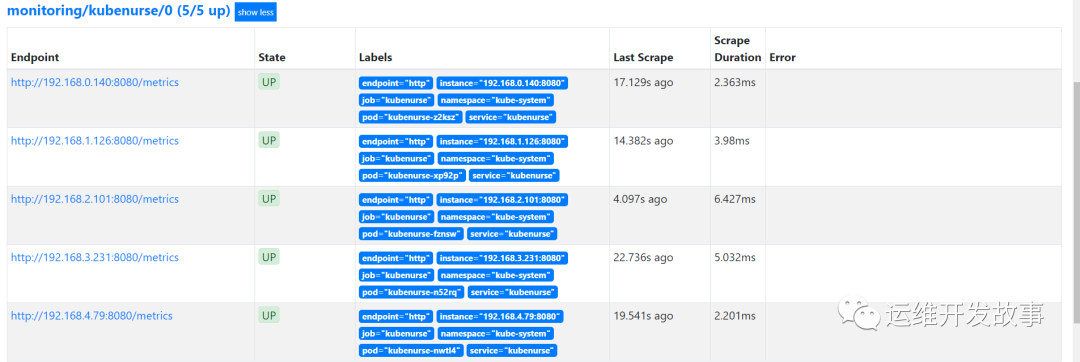 Check to see if the indicator is working.
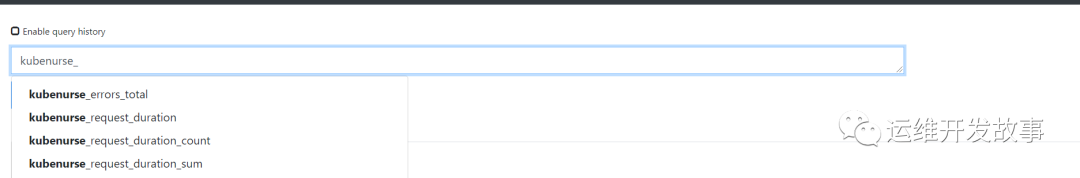
 (8) Now you can draw a picture on grafana showing the monitoring data as follows.
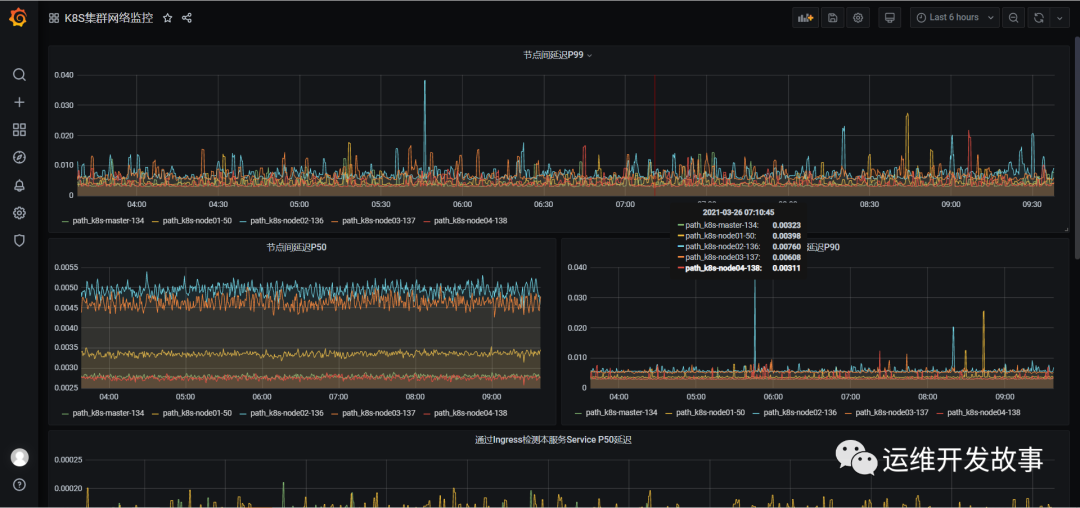
Reference Documents
[1]https://github.com/postfinance/kubenurse[2]https://github.com/postfinance/kubenurse/tree/master/examples
Public Number: Operations and Maintenance Development Story
github: https://github.com/orgs/sunsharing-note/dashboard
Love life, love operations
If you think the article is good, click on the top right corner to select Send to Friends or Forward to Friends Circle. Your support and encouragement are my greatest motivation. Please pay attention to me if you like it.

Scavenging 2D Code
Focus on me and maintain premium content irregularly
Reminder
If you like this article, please share it with your circle of friends and follow me for more information.
........................