Clustering algorithm - Kmeans
1. Unsupervised learning and clustering algorithm
- Supervised learning model algorithm, the sample data required by the model needs both characteristic matrix X and real label y.
- Unsupervised learning means that the model only needs to use the characteristic matrix X without the real label y. clustering algorithm is one of the representatives of unsupervised learning.
- clustering algorithm
- The purpose of clustering algorithm is to divide the data into meaningful or useful groups (or clusters). This division can be based on our business requirements or modeling requirements. It can also simply help us explore the natural structure and distribution of data. For example, in business, there is a large amount of information about current and potential customers. We can use clustering to divide customers into several groups to further analyze and carry out marketing and activities
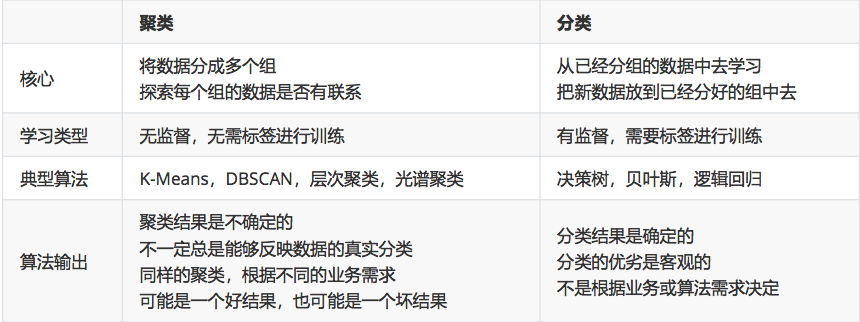
2. The difference between clustering algorithm and classification

3. Principle of kmeans algorithm
-
Cluster: the Kmeans algorithm divides the characteristic matrix X of a group of N samples into K clusters without intersection. Intuitively, the cluster is the data gathered one after another. The data in a cluster is considered to be the same class, and the cluster is the result of clustering
-
Centroid: the mean value u of all data in a cluster is usually called the "centroid" of the cluster
- In a two-dimensional plane, the abscissa of the centroid of a cluster of data points is the mean of the abscissa of the cluster of data points, and the ordinate of the centroid is the mean of the ordinate of the cluster of data points. The same principle can be extended to high-dimensional space
-
The number of centroids is consistent with the number of categories after clustering
-
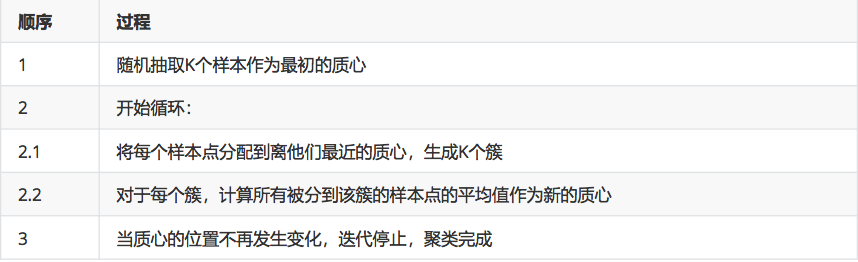
In the Kmeans algorithm, the number of clusters k is a super parameter, which needs to be determined by human input. The core task of Kmeans is to find k optimal centroids according to the k set by us, and assign the data closest to these centroids to the clusters represented by these centroids respectively. The specific process is as follows:
-
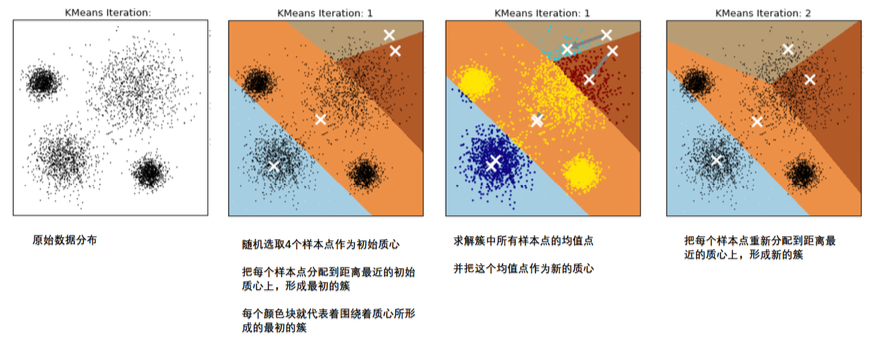
When we find a centroid, the samples assigned to this centroid in each iteration are consistent, that is, the newly generated clusters are consistent every time. All sample points will not be transferred from one cluster to another, and the centroid will not change
-
As shown in the figure [divide the data into 4 clusters, and white x represents the center of Mass]
4. Intra cluster error representation
-
The data in the same cluster are similar, but the data in different clusters are different. After clustering, we should study the nature of the samples in each cluster and formulate different strategies according to the business needs
-
Clustering algorithm pursues "small difference within the cluster and large difference outside the cluster" [difference: measured by the distance from the sample point to the centroid of its cluster]
-
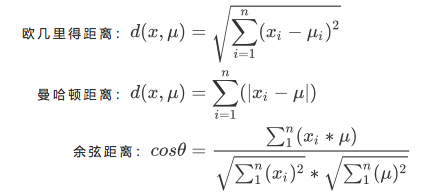
For a cluster, the smaller the sum of the distances from all sample points to the centroid, the more similar the samples in the cluster are and the smaller the difference within the cluster. The distance from the sample point to the centroid can be measured by the distance:
- x: A sample point in a cluster
- u: Centroid in cluster
- n: Number of features in each sample point
- i: Each feature that makes up a point
-
Sum of squares in cluster
- Using Euclidean distance, the sum of squares of the distances from all sample points in a cluster to the centroid is the sum of squares in the cluster. The sum of squares within the cluster can represent the size of the difference within the cluster
-
Overall sum of squares
- Add the sum of squares within all clusters in a dataset to obtain the total cluster sum of square, also known as total inertia. The smaller the total inertia, the more similar the samples in each cluster, and the better the clustering effect
5. Does kmeans have a loss function?
-
Yes, what Kmeans pursues is to solve the centroid that can minimize the sum of squares in the cluster. In the process of continuous change and iteration of the center of mass, the overall sum of squares is getting smaller and smaller. When the overall sum of squares is the smallest, the center of mass will no longer change, that is, solving the problem has become an optimization problem
- In Kmeans, under a fixed number of clusters k, minimize the overall sum of squares to solve the optimal centroid, and cluster based on the existence of centroid. Moreover, the minimum value of the overall sum of squares of distances can be solved by gradient descent. Therefore, some people believe that the sum of squares within clusters or the overall sum of squares is the loss function of Kmeans
-
No,
- The essence of the loss function is to measure the fitting effect of the model (the smaller the loss, the better the fitting effect of the simulation). Only the algorithm for solving the parameter requirements can have the loss function. Kmeans does not solve the parameters, and its essence is not to fit the data, but to explore the data. Therefore, some people believe that there is no loss function in kmeans, and the overall sum of squares is more like the model evaluation index of kmeans than the loss function
6. Prediction of results by kmeans
- Kmeans algorithm usually does not need prediction results, because the algorithm is essentially exploring unknown classification data, but in some cases, we can use predict to predict
- Forecast when the data is too large
- Instead of using all the data to find the centroid, a small amount of data can help us determine the centroid
- When the amount of data is very large, some data can be used to confirm the centroid
- The clustering results of the remaining data are called using predict
- When we don't require such accuracy, or our data volume is too large, we can use the predict method. If the data is OK, call labels_ directly after using fit. View clustering results
7.API
- class sklearn.cluster.KMeans(n_clusters=8,init='k-means++',n_init=10,max_iter=300,tol=0.0001,precompute_distances='auto',verbase=0,random_state=None,copy_x=True,n_jobs=None,algorthm='auto')
- parameter
- n_clusters: is k in KMeans, which indicates how many categories the model should be divided into. It is a required parameter. The default is 8 categories. The usual clustering result will be a result less than 8. Before clustering, n is not known_ How many clusters are, that is to explore it
- random_state: initializes the centroid generator
- attribute
- labels_: View the clustered categories and the corresponding classes of each sample
- cluster_centers_: View centroid coordinates
- intertia_: View sum of squares of total distances
8.Kmeans exploration
-
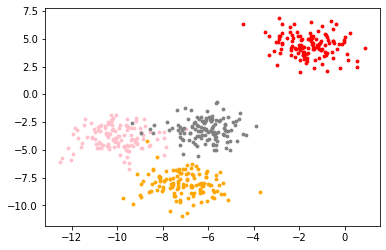
When we get a data set, we hope to observe the data distribution of the data set through drawing, so as to provide the N input during clustering_ Clusters makes a reference and creates a dataset by itself_ Blobs, self created, with labels
from sklearn.datasets import make_blobs
import matplotlib.pyplot as plt
#Create your own dataset, with feature dimension of 2 and centroid of 4, divided into 4 categories and 500 samples
X,y=make_blobs(n_samples=500,n_features=2,centers=4,random_state=1)
color=['red','pink','orange','gray']
fig,ax1=plt.subplots(1)
for i in range(4):
    ax1.scatter(
        X[y==i,0],
        X[y==i,1],
        marker='o',#Shape of point
        s=8,#Point size
        c=color[i]  #colour
    )

plt.show()
-
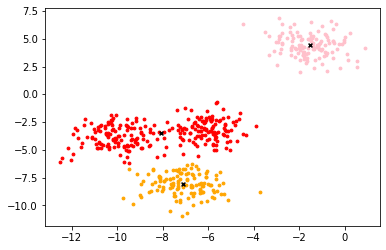
Based on this distribution, using kmeans, it is assumed that the data has three clusters
#Assume 3 clusters
from sklearn.cluster import KMeans
from sklearn.datasets import make_blobs
#Create your own dataset, with feature dimension of 2 and centroid of 4, divided into 4 categories and 500 samples
X,y=make_blobs(n_samples=500,n_features=2,centers=4,random_state=1)
n_clusters = 3
cluster = KMeans(n_clusters=n_clusters,random_state=0).fit(X)
y_pred=cluster.labels_  #For important attributes, view the clustered categories and the corresponding classes of each sample
centroid=cluster.cluster_centers_   #Important attribute view centroid
# array([[-8.0807047 , -3.50729701],
#        [-1.54234022,  4.43517599],
#        [-7.11207261, -8.09458846]])

inertia=cluster.inertia_  #Important properties, see the sum of squares of total distances
# 1903.4503741659223
-
Draw a picture to show the center of mass
from sklearn.cluster import KMeans
from sklearn.datasets import make_blobs
#Create your own dataset, with feature dimension of 2 and centroid of 4, divided into 4 categories and 500 samples
X,y=make_blobs(n_samples=500,n_features=2,centers=4,random_state=1)
n_clusters = 3
cluster = KMeans(n_clusters=n_clusters,random_state=0).fit(X)
centroid=cluster.cluster_centers_   #Important attribute view centroid
color=['red','pink','orange','gray']
fig,ax1=plt.subplots(1)
for i in range(n_clusters):
    ax1.scatter(X[y_pred==i,0],X[y_pred==i,1],marker='o',s=8,c=color[i])
ax1.scatter(centroid[:,0],centroid[:,1],marker='x',s=15,c='black')
plt.show()
-
Use partial data
from sklearn.cluster import KMeans
from sklearn.datasets import make_blobs
X,y=make_blobs(n_samples=500,n_features=2,centers=4,random_state=1)
n_clusters=3
cluster=KMeans(n_clusters=n_clusters,random_state=0).fit(X)
y_pred=cluster.labels_  #For important attributes, view the clustered categories and the corresponding classes of each sample
cluster_smallsub=KMeans(n_clusters=n_clusters,random_state=0).fit(X[:200])
#Use the model to classify and predict X
y_pred_ = cluster_smallsub.predict(X)
(y_pred==y_pred_).sum()
9. Model evaluation indicators
-
[interview question] how to measure the effect of clustering algorithm?
- The result of clustering algorithm is not a label output, and the result of clustering is uncertain. Its quality is determined by business requirements or algorithm requirements, and there is no correct answer
-
Disadvantages of the sum of squares within clusters
-
First of all, it is not bounded. We only know that the smaller the inertia, the better. It is 0 best. However, we do not know whether a smaller inertia has reached the limit of the model or whether it can continue to improve
-
The calculation is too easy to be affected by the number of features. When the data dimension is large, the amount of calculation of interia will explode, which is not suitable for evaluating the model again and again
-
It will be affected by the super parameter k. with the increase of K, the intera will become smaller and smaller, but it does not mean that the effect of the model is better and better
-
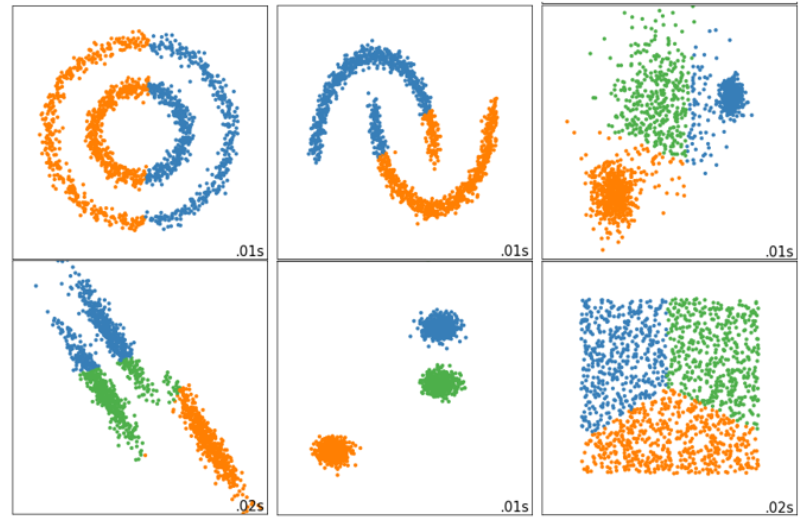
Using inertia as an index will make the clustering algorithm ineffective in some slender clusters, ring clusters or irregular clusters:
-
9.1 profile factor
-
Contour coefficient [contour coefficient is the evaluation index of the most commonly used clustering algorithm]
-
In 99% of cases, it is to explore the data without real labels, that is, to cluster the data that do not know the real answer. This clustering completely depends on the evaluation of the density within the cluster (small difference within the cluster) and the dispersion between clusters (large difference outside the cluster). The contour coefficient is the evaluation index of the most commonly used clustering algorithm. It is defined for each sample and can measure:
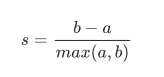
- 1. The similarity a between the sample and other samples in its own cluster is equal to the average distance between the sample and all other points in the same cluster
- 2. The similarity b between the sample and the samples in other clusters is equal to the average distance between the sample and all points in the next nearest cluster. According to the clustering requirements, "the difference within the cluster is small, and the difference outside the cluster is large", I hope b will always be greater than a, and the larger the better
-
The single contour coefficient is calculated as:
-
-
The contour coefficient range is (- 1,1):
- The closer the value is to 1, it means that the sample is very similar to the sample in its own cluster and is not similar to the sample in other clusters. When the sample is more similar to the sample outside the cluster, the contour coefficient is negative
- When the contour coefficient is 0, it means that the sample similarity in the two clusters is the same, and the two clusters should be one cluster.
- That is, the closer the contour coefficient is to 1, the better. A negative number indicates that the clustering effect is very poor
-
If most samples in a cluster have high contour coefficient, the cluster will have high total contour coefficient. The higher the average contour coefficient of the whole data set, that is, clustering is appropriate
-
If many sample points have low contour coefficients or even negative numbers, clustering is not appropriate, and the super parameter k of clustering may be set too large or too small
-
Calculation of contour coefficient
- silhouette_score
- from sklearn.metrics import silbouette_score, which returns the mean value of contour coefficients of all samples in a data set
- silhouette_sample
- from sklearn.metrics import silhouetet_samples, which returns the contour coefficient of each sample in the dataset
from sklearn.cluster import KMeans
from sklearn.datasets import make_blobs
from sklearn.metrics import silhouette_score
from sklearn.metrics import silhouette_samples
X,y=make_blobs(n_samples=500,n_features=2,centers=4,random_state=1)
n_clusters=3
cluster=KMeans(n_clusters=n_clusters,random_state=0).fit(X)
y_pred=cluster.labels_
silhouette_score(X,y_pred)  #0.5882004012129721
silhouette_samples(X,y_pred)
- silhouette_score