- Standardization and normalization are data preprocessing methods. Because translation problems are often confused in China, here is a special clarification.
1.Four Feature Scaling methods
- Reference resources Wikipedia In fact, standardization and normalization belong to four Feature scaling methods
1.1 Rescaling (min-max normalization)
- Rescaling (min-max normalization) is sometimes referred to as normalization, which is often referred to as normalization.
x ′ = x − min ( x ) max ( x ) − min ( x ) x' = \frac{x-\min(x)}{\max(x)-\min(x)} x′=max(x)−min(x)x−min(x) - After processing in this way, all data values can be compressed in [ 0 , 1 ] [0,1] Eliminate dimension effects while maintaining relative distances between samples within [0,1]
- Here is an extension of compressing data to a specified
[
a
,
b
]
[a,b]
Within [a,b]
x ′ = a + ( b − a ) x − min ( x ) max ( x ) − min ( x ) x' = a+(b-a)\frac{x-\min(x)}{\max(x)-\min(x)} x′=a+(b−a)max(x)−min(x)x−min(x)
1.2 Mean normalization
- Mean normalization, often translated as mean normalization
x ′ = x − mean ( x ) max ( x ) − min ( x ) x' = \frac{x-\text{mean} (x)}{\max(x)-\min(x)} x′=max(x)−min(x)x−mean(x) - This moves all samples near zero, eliminates the dimension effect, and maintains the relative distance between samples.
1.3 Standardization (Z-score normalization)
- Standardization (Z-score normalization), commonly referred to as standardization refers to this
x ′ = x − mean ( x ) σ ( x ) x' = \frac{x-\text{mean}(x)}{\sigma(x)} x′=σ(x)x−mean(x) - This operation adjusts all samples to mean 0, variance 1, and normalized normal distribution to obtain standard normal distribution, but this does not mean that only normal distribution can be standardized, nor does it mean that all normalized distributions are standard normal distribution. In fact, any distribution can be standardized. The normalized distribution has changed, but the distribution type has not changed. Just pan and zoom
Note: For multidimensional normal distribution, only when the features are independent (isotropic), will the normalized distribution present a positive circle/sphere, otherwise the normalized distribution is not a positive circle/sphere.
1.4 Scaling to unit length
- Scaling to unit length, often translated as unitary
x ′ = x ∣ ∣ x ∣ ∣ x' = \frac{x}{||x||} x′=∣∣x∣∣x - This operation changes all samples to the unit hypersphere around zero
2. Examples
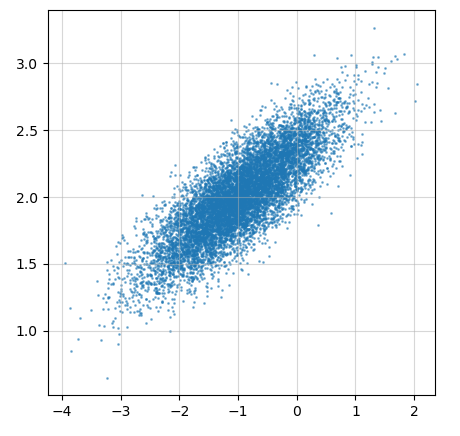
- Generate a two-dimensional normal distribution with expectations set to μ = [ − 1 2 ] \pmb{\mu} = \begin{bmatrix}-1\\2 \end{bmatrix} μ ( μ * μ= [12], the covariance matrix is B = [ 0.6 0.2 0.2 0.1 ] \pmb{B} = \begin{bmatrix}0.6 &0.2\\0.2 &0.1 \end{bmatrix} BBB=[0.60.20.20.1]
- Draw this distribution as follows, noting that the two dimensions are not independent
%matplotlib notebook
import numpy as np
import scipy.stats as st
import matplotlib.pylab as plt
from matplotlib.ticker import MultipleLocator, FormatStrFormatter

fig = plt.figure(figsize = (5,5))
mu = np.array([-1, 2])
sigma = np.array([[0.6,0.2],[0.2,0.1]])
points = np.random.multivariate_normal(mu,sigma,10000)

a0 = fig.add_subplot(1,1,1,label='a0')
a0.grid(which='minor',alpha=0.5)
a0.scatter(points[:,0], points[:,1],s=1,alpha=0.5,cmap="rainbow")
a0.grid(which='major',alpha=0.5)
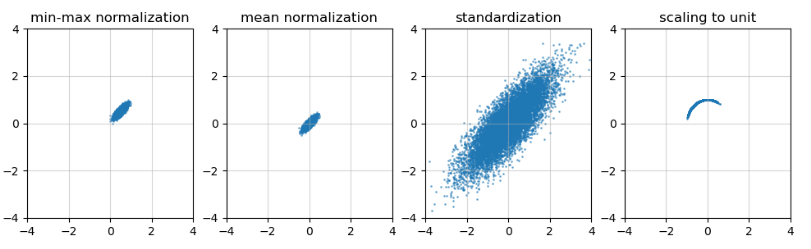
- Processed and visualized using four Feature scaling methods, with the following results
%matplotlib notebook
import numpy as np
import scipy.stats as st
import matplotlib.pylab as plt
from matplotlib.ticker import MultipleLocator, FormatStrFormatter

def MinMaxNormalization(px):
    for i in range(px.shape[1]):
        t = px[:,i]
        tmin,tmax = np.min(t),np.max(t)
        t[:] = (t-tmin)/(tmax-tmin)

def MeanNormalization(px):
    for i in range(px.shape[1]):
        t = px[:,i]
        tmin,tmax,tmean = np.min(t),np.max(t),np.mean(t)
        t[:] = (t-tmean)/(tmax-tmin)

def Standardization(px):
    for i in range(px.shape[1]):
        t = px[:,i]
        tmean,tstd = np.mean(t),np.std(t.copy())
        t[:] = (t-tmean)/tstd

def Scaling2Unit(px):
    norm = np.linalg.norm(px,axis=1)
    for i in range(px.shape[1]):
        t = px[:,i]
        t[:] = t/norm

majorLocator = MultipleLocator(2) # Major scale label set to multiple of 1
p1 = points.copy()
p2 = points.copy()
p3 = points.copy()
p4 = points.copy()

MinMaxNormalization(p1)
MeanNormalization(p2)
Standardization(p3)
Scaling2Unit(p4)

fig = plt.figure(figsize = (12,3))
a1 = fig.add_subplot(1,4,1,label='a1')
a2 = fig.add_subplot(1,4,2,label='a2')
a3 = fig.add_subplot(1,4,3,label='a3')
a4 = fig.add_subplot(1,4,4,label='a4')

subplot = {a1:(p1,'min-max normalization'),
           a2:(p2,'mean normalization'),
           a3:(p3,'standardization'),
           a4:(p4,'scaling to unit')}

for ax in subplot:
    px,title = subplot[ax]
    ax.scatter(px[:,0], px[:,1],s=1,alpha=0.5,cmap="rainbow")
    ax.axis([-4,4,-4,4])
    ax.xaxis.set_major_locator(majorLocator)
    ax.yaxis.set_major_locator(majorLocator)
    ax.grid(which='major',alpha=0.5)
    ax.set_title(title)