Memory bottleneck
free
free is to view memory usage, including physical memory, swap memory, and kernel buffer memory.
free -h -s 3 means to output the memory every three seconds. The command is as follows
[1014154@cc69dd4c5-4tdb5 ~]$ free
              total        used        free      shared  buff/cache   available
Mem:      119623656    43052220    45611364     4313760    30960072    70574408
Swap:             0           0           0
[1014154@cc69dd4c5-4tdb5 ~]$ free -h -s 3
              total        used        free      shared  buff/cache   available
Mem:           114G         41G         43G        4.1G         29G         67G
Swap:            0B          0B          0B

              total        used        free      shared  buff/cache   available
Mem:           114G         41G         43G        4.1G         29G         67G
Swap:            0B          0B          0B
- Mem: memory usage.
- Swap: is the usage of swap space.
- Total: total available physical memory and swap space of the system.
- Used: the physical memory and swap space that has been used.
- free: how much physical memory and swap space are available? It is the amount of physical memory that has not been used.
- shared: the size of physical memory used by the share.
- Buffer / cache: the amount of physical memory used by buffer and cache.
- Available: the physical memory size that can also be used by the application. It is the amount of available memory from the perspective of the application. Available ≈ free + buffer + cache.
Swap space
swap space is an area on the disk. When the physical memory of the system is tight, Linux will save the infrequently accessed data in the memory to swap, so that the system will have more physical memory to serve each process. When the system needs to access the content stored on the swap, it will load the data on the swap into the memory, which is often called swap out and swap in. swap space can alleviate the shortage of memory to a certain extent, but it needs to read and write disk data, so the performance is not very high.
vmstat (recommended)
vmstat (virtual memory statistics) is a common tool for monitoring memory in Linux. It can monitor the overall situation of virtual memory, process and CPU of the operating system. It is recommended to use.
vmstat 5 3 means statistics are made every 5 seconds, three times in total.
[1014154@cc69dd4c5-4tdb5 ~]$ vmstat 5 3
procs -----------memory---------- ---swap-- -----io---- -system-- ------cpu-----
 r  b   swpd   free   buff  cache   si   so    bi    bo   in   cs us sy id wa st
 8  0      0 45453212 374768 30763728    0    0    14    99    1    1 11 10 78  0  1
10  0      0 4548 ninety-two 32 374768 30763360    0    0     2  1275 95118 97908 13 11 75  0  1
 6  0      0 45452908 374768 30765148    0    0     0  3996 89 ninety-two 4 ninety-two 073 12 10 78  0  1
procs
r: Indicates the number of processes running and waiting for the CPU time slice (that is, how many processes are actually allocated to the CPU). If this value is greater than the number of system CPUs for a long time, it indicates that the CPU is insufficient and needs to be increased. b: Indicates the number of processes waiting for resources, such as I/O or memory exchange.
memory
swpd: indicates the size of memory switched to the memory swap area, that is, the size of virtual memory used (unit: KB). If it is greater than 0, it indicates that your machine is short of physical memory. If it is not the cause of program memory leakage, you should upgrade memory or migrate memory consuming tasks to other machines. Free: indicates the currently free physical memory. buff: indicates the buffer size, which is generally required for reading and writing to block devices. Cache: indicates the buffer size, which is generally used as a file system buffer, and frequently accessed files will be cached. If the cache value is very large, it indicates that there are more cached files. If the bi ratio in io is small, it indicates that the file system efficiency is relatively good.
swap
si: indicates that the data is read from the disk into the memory; Generally speaking, it is the size of virtual memory read from the disk every second. If this value is greater than 0, it means that the physical memory is not enough or the memory is leaked. Find the memory consuming process and solve it. so: indicates the size of data written from memory to disk, that is, the data entered into memory from the memory swap area.
Note: generally, the values of si and so are 0. If the values of si and so are not 0 for a long time, it indicates that the system memory is insufficient and needs to be increased
io
bi: refers to the total amount of data read from the block device, i.e. read disk, unit kb/s bo: refers to the total amount of data written to the block device, i.e. write disk, unit kb/s
Note: if the value of bi+bo is too large and the value of wa is too large, it indicates that the system disk IO bottleneck.
system
In: indicates the number of device terminals per second observed in a certain time interval. cs: indicates the number of context switches per second. The smaller the value, the better. If it is too large, consider reducing the number of threads or processes. For example, in web servers such as apache and nginx, we generally conduct thousands or even tens of thousands of concurrent tests when we do performance tests. The process of selecting Web server can be reduced by the peak value of process or thread until cs reaches a relatively small value, and the number of processes and threads is a more appropriate value. System call is the same. Every time we call the system function, our code will enter the kernel space, resulting in context switching. This is very resource consuming. We should also try to avoid calling the system function frequently. Too many context switches means that most of your CPU is wasted on context switching, resulting in less time for the CPU to do serious things, and it is not advisable to make full use of the CPU.
Note: the larger these two values, the more CPU consumed by the kernel.
CPU
us: indicates the percentage of CPU time consumed by the user process. The higher the us value, the more CPU time consumed by the user process. If it is greater than 50% for a long time, the optimization program or algorithm needs to be considered. SY: indicates the percentage of CPU time consumed by the system kernel process. Generally speaking, us+sy should be less than 80%. If it is greater than 80%, it indicates that there may be a CPU bottleneck. id: indicates the percentage of time the CPU is in the space state. wa: indicates the percentage of CPU time occupied by IP waiting. The higher the value of wa, the more serious the I/O waiting is. According to experience, the reference value of wa is 20%. If it exceeds 20%, it indicates that the I/O waiting is serious. The reason for I/O waiting may be caused by a large number of random reads and writes on the disk, or by the loan bottleneck of the disk or monitor (mainly block operation).
sar
sar and free are similar. sar -r 3 outputs memory information every three seconds:
[root@localhost ~]# sar -r 3
Linux 3.10.0-1062.el7.x86_64 (localhost.localdomain)    2020 April 28  _x86_64_        (2 CPU)

15 Hour 40 minutes 10 seconds kbmemfree kbmemused  %memused kbbuffers  kbcached  kbcommit   %commit  kbactive   kbinact   kbdirty
15 Hour 40 minutes 13 seconds    106800   1314960     92.49      2144    573248   4110864    116.82    563664    498888        36
15 Hour 40 minutes 16 seconds    106816   1314944     92.49      2144    573248   4110864    116.82    563668    498888        36
15 : 40:19    106816   1314944     92.49      2144    573248   4110864    116.82    563668    498888        36
CPU bottleneck
View the number of cpu cores of the machine
CPU Total number of cores = Physics CPU number * Each physical CPU Kernel number of
General logic CPU number = Physics CPU number * Each physical CPU Kernel number of * Number of hyper threads
View CPU information (model)
[1014154@cc69dd4c5-4tdb5 ~]$ cat /proc/cpuinfo | grep name | cut -f2 -d: | uniq -c
     32  Intel(R) Xeon(R) CPU E5-2650 v4 @ 2.20GHz
View the number of physical CPU s
[1014154@cc69dd4c5-4tdb5 ~]$ cat /proc/cpuinfo| grep "physical id"| sort| uniq| wc -l
16
View the number of cores in each physical CPU (i.e. the number of cores)
[1014154@cc69dd4c5-4tdb5 ~]$ cat /proc/cpuinfo| grep "cpu cores"| uniq
cpu cores       : 2
View the number of logical CPU s
[1014154@cc69dd4c5-4tdb5 ~]$ cat /proc/cpuinfo| grep "processor"| wc -l
32
top
In the operating system of Linux kernel, the process is dynamically scheduled according to the virtual running time (dynamically calculated by the process priority, nice value and the actual CPU time). When executing a process, you need to switch from user state to kernel state. User space cannot directly operate functions in kernel space. System calls are usually used to complete process scheduling, and the conversion from user space to kernel space is usually completed through soft interrupts. The CPU consumed by the user through the disk kernel, and the CPU consumed by the user through the disk operation. When executing a process, it needs to go through a series of operations. Firstly, the process is executed in the user state. During the execution process, the process priority will be adjusted (NICE), which is called to the kernel through the system, and then called by the kernel, hard interrupt and soft interrupt, so that the hardware can execute the task. After execution, it returns to the system call from the kernel state, and finally the system call returns the result to the user state process.
Top can view the overall CPU consumption, including itemized consumption, such as User, System, Idle, nice, etc. Shift + H displays java threads; Shift + M sort by memory usage; Shift + P sort by CPU usage time (utilization); Shift + T sort by CPU cumulative usage time; For multi-core CPUs, enter top view 1 to see the load of each CPU.
top - 15:24:11 up 8 days,  7:52,  1 user,  load average: 5.73, 6.85, 7.33
Tasks:  17 total,   1 running,  16 sleeping,   0 stopped,   0 zombie
%Cpu(s): 13.9 us,  9.2 sy,  0.0 ni, 76.1 id,  0.1 wa,  0.0 hi,  0.1 si,  0.7 st
KiB Mem : 11962365+total, 50086832 free, 38312808 used, 31224016 buff/cache
KiB Swap:        0 total,        0 free,        0 used. 75402760 avail Mem

   PID USER      PR  NI    VIRT    RES    SHR S  %CPU %MEM     TIME+ COMMAND
   300 ymmapp    20   0 17.242g 1.234g  14732 S   2.3  1.1   9:40.38 java
     1 root      20   0   15376   1988   1392 S   0.0  0.0   0:00.06 sh
    11 root      20   0  120660  11416   1132 S   0.0  0.0   0:04.94 python
    54 root      20   0   85328   2240   1652 S   0.0  0.0   0:00.00 su
    55 ymmapp    20   0   17432   1808   1232 S   0.0  0.0   0:00.00 bash
    56 ymmapp    20   0   17556   2156   1460 S   0.0  0.0   0:00.03 control.sh
    57 ymmapp    20   0   11880    740    576 S   0.0  0.0   0:00.00 tee
   115 ymmapp    20   0   17556   2112   1464 S   0.0  0.0   0:00.02 control_new_war
   133 root      20   0  106032   4240   3160 S   0.0  0.0   0:00.03 sshd
   134 ymmapp    20   0   17080   6872   3180 S   0.0  0.0   0:01.82 ops-updater
   147 ymmapp    20   0   17956   2636   1544 S   0.0  0.0   0:00.07 control.sh
  6538 ymmapp    20   0  115656  10532   3408 S   0.0  0.0   0:00.46 beidou-agent
  6785 ymmapp    20   0 2572996  22512   2788 S   0.0  0.0   0:03.44 gatherinfo4dock
 29241 root      20   0  142148   5712   4340 S   0.0  0.0   0:00.04 sshd
 29243 1014154   20   0  142148   2296    924 S   0.0  0.0   0:00.00 sshd
 29244 1014154   20   0   15208   2020   1640 S   0.0  0.0   0:00.00 bash
 32641 1014154   20   0   57364   2020   1480 R   0.0  0.0   0:00.00 top
The first line: 15:24:11, up 8 days, 7:52, 1 user, load average: 5.73, 6.85, 7.33:15:24:11 system time, up 8 days running time, 1 user's current login users, load average load balancing, respectively, indicating 1 minute, 5 minutes and 15 minutes of load.
The second line: Tasks: 17 total, 1 running, 16 sleeping, 0 stopped, 0 zombie: total processes 17, running 1, sleep 16, stop 0, zombie process 0.
The third line:% Cpu(s): 13.9 us, 9.2 sy, 0.0 ni, 76.1 id, 0.1 wa, 0.0 hi, 0.1 si, 0.7 st: 13.9% of cpu in user space, 9.2% of cpu in kernel space, 0% of cpu in processes that have changed priority, 76.1% of cpu in idle state, 0.1% of cpu in IO waiting state, 0% of cpu in hard interrupt state, 0.1% of cpu in soft interrupt state, 0.7% of the current VM's cpu is stolen by virtualization.
The fourth and fifth lines show the usage of memory and swap area.
The seventh line indicates:
- PID: process id
- USER: process owner
- PR: process priority
- NI:nice value. Negative values indicate high priority and positive values indicate low priority
- Virt: virtual memory, the total amount of virtual memory used by the process, in kb. VIRT=SWAP+RES
- Res: resident memory, the size of physical memory used by the process and not swapped out, in kb. RES=CODE+DATA
- SHR: shared memory, shared memory size, unit: kb
- S: Process status. D = non interruptible sleep state R = running s = sleep T = tracking / stopping Z = zombie process
- %CPU: percentage of CPU time used since the last update
- %MEM: percentage of physical memory used by the process
- TIME +: total CPU TIME used by the process, unit: 1 / 100 second
- COMMAND: process name (COMMAND name / COMMAND line)
Calculate the number of uninterrupted sleep tasks in cpu load
top -b -n 1 | awk '{if (NR<=7)print;else if($8=="D"){print;count++}}END{print "Total status D:"count}'
[root@localhost ~]# top -b -n 1 | awk '{if (NR<=7)print;else if($8=="D"){print;count++}}END{print "Total status D:"count}'
top - 15:35:05 up 1 day, 26 min,  3 users,  load average: 0.00, 0.01, 0.05
Tasks: 225 total,   1 running, 224 sleeping,   0 stopped,   0 zombie
%Cpu(s):  2.5 us, 10.0 sy,  0.0 ni, 87.5 id,  0.0 wa,  0.0 hi,  0.0 si,  0.0 st
KiB Mem :  1421760 total,   104516 free,   777344 used,   539900 buff/cache
KiB Swap:  2097148 total,  2071152 free,    25996 used.   456028 avail Mem

   PID USER      PR  NI    VIRT    RES    SHR S  %CPU %MEM     TIME+ COMMAND
Total status D:
sar
Through sar -u 3, you can view the proportion of total CUP consumption:
[root@localhost ~]# sar -u 3
Linux 3.10.0-1062.el7.x86_64 (localhost.localdomain)    2020 May 1  _x86_64_        (2 CPU)

15 18:03     CPU     %user     %nice   %system   %iowait    %steal     %idle
15 18:06     all      0.00      0.00      0.17      0.00      0.00     99.83
15 18:09     all      0.00      0.00      0.17      0.00      0.00     99.83
15 18:12     all      0.17      0.00      0.17      0.00      0.00     99.66
15 18:15     all      0.00      0.00      0.00      0.00      0.00    100.00
15 18:18     all      0.00      0.00      0.00      0.00      0.00    100.00
- %User: CPU usage of user space.
- %nice: CPU utilization of processes that have changed their priority.
- %system: CPU utilization of kernel space.
- %iowait: the percentage of CPU waiting for IO.
- %Steel: the CPU used by the virtual machine CPU of the virtual machine.
- %Idle: idle CPU.
In the above display, we mainly look at% iowait and% idle:
- If the value of% iowait is too high, it indicates that there is an I/O bottleneck in the hard disk;
- If the value of% idle is high but the system response is slow, the CPU may be waiting for memory allocation, and the memory capacity should be increased at this time;
- If the value of% idle continues to be lower than 10, the CPU processing capacity of the system is relatively low, indicating that the most needed resource in the system is CPU;
Locate the most CPU consuming thread on the line
preparation
Start a program. Arthas demo is a simple program that generates a random number every second, performs prime factor decomposition, and prints the decomposition results.
curl -O https://alibaba.github.io/arthas/arthas-demo.jar
java -jar arthas-demo.jar
[root@localhost ~]# curl -O https://alibaba.github.io/arthas/arthas-demo.jar
  % Total    % Received % Xferd  Average Speed   Time    Time     Time  Current
                                 Dload  Upload   Total   Spent    Left  Speed
100  3743  100  3743    0     0   3022      0  0:00:01  0:00:01 --:--:--  3023
[root@localhost ~]# java -jar arthas-demo.jar
1813=7*7*37
illegalArgumentCount:  1, number is: -180005, need >= 2
illegalArgumentCount:  2, number is: -111175, need >= 2
18505=5*3701
166691=7*23813
105787=11*59*163
60148=2*2*11*1367
196983=3*3*43*509
illegalArgumentCount:  3, number is: -173479, need >= 2
illegalArgumentCount:  4, number is: -112840, need >= 2
39502=2*19751
....
Find the most time-consuming process through the top command
[root@localhost ~]# top
top - 11:11:05 up 20:02,  3 users,  load average: 0.09, 0.07, 0.05
Tasks: 225 total,   1 running, 224 sleeping,   0 stopped,   0 zombie
%Cpu(s):  0.0 us,  0.7 sy,  0.0 ni, 99.3 id,  0.0 wa,  0.0 hi,  0.0 si,  0.0 st
KiB Mem :  1421760 total,   135868 free,   758508 used,   527384 buff/cache
KiB Swap:  2097148 total,  2070640 free,    26508 used.   475852 avail Mem
Change delay from 3.0 to
   PID USER      PR  NI    VIRT    RES    SHR S  %CPU %MEM     TIME+ COMMAND
 98344 root      20   0 2422552  23508  12108 S   0.7  1.7   0:00.32 java
     1 root      20   0  194100   6244   3184 S   0.0  0.4   0:20.41 systemd
     2 root      20   0       0      0      0 S   0.0  0.0   0:00.12 kthreadd
     4 root       0 -20       0      0      0 S   0.0  0.0   0:00.00 kworker/0:0H
     6 root      20   0       0      0      0 S   0.0  0.0   0:20.25 ksoftirqd/0
The process number found is 98344.
Find the thread that consumes the most CUP in the process
Use the ps -Lp #pid cu command to view the sorting of thread CPU consumption in a process:
[root@localhost ~]# ps -Lp 98344 cu
USER        PID    LWP %CPU NLWP %MEM    VSZ   RSS TTY      STAT START   TIME COMMAND
root      98344  98344  0.0   10  4.1 2422552 59060 pts/0   Sl+  11:09   0:00 java
root      98344  98345  0.0   10  4.1 2422552 59060 pts/0   Sl+  11:09   0:04 java
root      98344  98346  0.0   10  4.1 2422552 59060 pts/0   Sl+  11:09   0:01 VM Thread
root      98344  98347  0.0   10  4.1 2422552 59060 pts/0   Sl+  11:09   0:00 Reference Handl
root      98344  98348  0.0   10  4.1 2422552 59060 pts/0   Sl+  11:09   0:00 Finalizer
root      98344  98349  0.0   10  4.1 2422552 59060 pts/0   Sl+  11:09   0:00 Signal Dispatch
root      98344  98350  0.0   10  4.1 2422552 59060 pts/0   Sl+  11:09   0:05 C2 CompilerThre
root      98344  98351  0.0   10  4.1 2422552 59060 pts/0   Sl+  11:09   0:00 C1 CompilerThre
root      98344  98352  0.0   10  4.1 2422552 59060 pts/0   Sl+  11:09   0:00 Service Thread
root      98344  98353  0.1   10  4.1 2422552 59060 pts/0   Sl+  11:09   0:19 VM Periodic Tas
Looking at the TIME column, we can see that the thread consumes more CUP. According to the LWP column, we can see the ID number of the thread, but it needs to be converted to hexadecimal to query the thread stack information.
Gets the hexadecimal code of the thread id
Use printf '%x\n' 98345 command for binary conversion:
[root@localhost ~]# printf '%x\n' 98345
18029
View thread stack information
Use jstack to get stack information. jstack 98344 | grep -A 10 18029:
[root@localhost ~]# jstack 98344 | grep -A 10 18029
"main" #1 prio=5 os_prio=0 tid=0x00007fb88404b800 nid=0x18029 waiting on condition [0x00007fb88caab000]
   java.lang.Thread.State: TIMED_WAITING (sleeping)
        at java.lang.Thread.sleep(Native Method)
        at java.lang.Thread.sleep(Thread.java:340)
        at java.util.concurrent.TimeUnit.sleep(TimeUnit.java:386)
        at demo.MathGame.main(MathGame.java:17)

"VM Thread" os_prio=0 tid=0x00007fb8840f2800 nid=0x1802a runnable

"VM Periodic Task Thread" os_prio=0 tid=0x00007fb884154000 nid=0x18031 waiting on condition
Through the command, we can see that the corresponding time-consuming code of this thread is in demo MathGame. main(MathGame.java:17)
grep -C 5 foo file display file Match in file foo The line of the string and the top and bottom five lines
grep -B 5 foo file display foo And the first five lines
grep -A 5 foo file display foo And the last 5 lines
Network bottleneck
Locate packet loss and error
watch more /proc/net/dev is used to locate packet loss and error, so as to see the network bottleneck. Focus on drop and the total amount of network packet transmission, and do not exceed the upper limit of the network:
[root@localhost ~]# watch -n 2 more /proc/net/dev
Every 2.0s: more /proc/net/dev                                                                                                                                                   Fri May  1 17:16:55 2020

Inter-|   Receive                                                |  Transmit
 face |bytes    packets errs drop fifo frame compressed multicast|bytes    packets errs drop fifo colls carrier compressed
    lo:   10025     130    0    0    0     0          0         0    10025     130    0    0    0     0       0          0
 ens33: 759098071  569661    0    0    0     0          0         0 19335572  225551    0    0    0     0       0          0
- The leftmost indicates the name of the interface, Receive indicates receiving packets, and Transmit indicates sending packets;
- Bytes: indicates the number of bytes sent and received;
- Packets: indicates the correct number of packets sent and received;
- errs: indicates the number of packets sent and received incorrectly;
- drop: indicates the amount of packets discarded during receiving and sending;
View routing addresses
traceroute ip can view the address through which the route passes. It is often used to count the time consumption of the network in each route section, such as:
[root@localhost ~]# traceroute 14.215.177.38
traceroute to 14.215.177.38 (14.215.177.38), 30 hops max, 60 byte packets
 1  CD-HZTK5H2.mshome.net (192.168.137.1)  0.126 ms * *
 2  * * *
 3  10.250.112.3 (10.250.112.3)  12.587 ms  12.408 ms  12.317 ms
 4  172.16.227.230 (172.16.227.230)  2.152 ms  2.040 ms  1.956 ms
 5  172.16.227.202 (172.16.227.202)  11.884 ms  11.746 ms  12.692 ms
 6  172.16.227.65 (172.16.227.65)  2.665 ms  3.143 ms  2.923 ms
 7  171.223.206.217 (171.223.206.217)  2.834 ms  2.752 ms  2.654 ms
 8  182.150.18.205 (182.150.18.205)  5.145 ms  5.815 ms  5.542 ms
 9  110.188.6.33 (110.188.6.33)  3.514 ms 171.208.199.185 (171.208.199.185)  3.431 ms 171.208.199.181 (171.208.199.181)  10.768 ms
10  202.97.29.17 (202.97.29.17)  29.574 ms 202.97.30.146 (202.97.30.146)  32.619 ms *
11  113.96.5.126 (113.96.5.126)  36.062 ms 113.96.5.70 (113.96.5.70)  35.940 ms 113.96.4.42 (113.96.4.42)  45.859 ms
12  90.96.135.219.broad.fs.gd.dynamic.163data.com.cn (219.135.96.90)  35.680 ms  35.468 ms  35.304 ms
13  14.215.32.102 (14.215.32.102)  35.135 ms 14.215.32.110 (14.215.32.110)  35.613 ms 14.29.117.242 (14.29.117.242)  54.712 ms
14  * 14.215.32.134 (14.215.32.134)  49.518 ms 14.215.32.122 (14.215.32.122)  47.652 ms
15  * * *
...
View network errors
netstat -i to view network errors:
[root@localhost ~]# netstat -i
Kernel Interface table
Iface             MTU    RX-OK RX-ERR RX-DRP RX-OVR    TX-OK TX-ERR TX-DRP TX-OVR Flg
ens33            1500   570291      0      0 0        225897      0      0      0 BMRU
lo              65536      130      0      0 0           130      0      0      0 LRU
- Iface: network interface name;
- MTU: maximum transmission unit, which limits the maximum length of data frame. Different network types have an upper limit value. For example, the MTU of Ethernet is 1500;
- RX-OK: the correct number of packets when received.
- RX-ERR: the number of packets with errors when receiving.
- RX-DRP: the number of packets discarded when receiving.
- RX-OVR: the number of data packets lost due to over speed (in data transmission, the data is lost because the receiving device cannot receive the data transmitted according to the transmission rate).
- TX-OK: the correct number of packets when sending.
- TX-ERR: the number of packets with errors when sending.
- TX-DRP: the number of packets discarded when sending.
- TX-OVR: the number of packets lost due to over speed during transmission.
- Flg: flag, B has set a broadcast address. L this interface is a loopback device. M receives all packets (chaotic mode). N avoid tracking. O on this interface, disable ARP. P this is a point-to-point link. The R interface is running. The U interface is in the "active" state.
Packet retransmission rate
cat /proc/net/snmp is used to view and analyze the network packet volume, traffic, packet error and packet loss within 240 seconds. The retransmission rate tcpetr=RetransSegs/OutSegs is calculated through RetransSegs and OutSegs.
[root@localhost ~]# cat /proc/net/snmp
Ip: Forwarding DefaultTTL InReceives InHdrErrors InAddrErrors ForwDatagrams InUnknownProtos InDiscards InDelivers OutRequests OutDiscards OutNoRoutes ReasmTimeout ReasmReqds ReasmOKs ReasmFails FragOKs FragFails FragCreates
Ip: 1 64 241708 0 0 0 0 0 238724 225517 15 0 0 0 0 0 0 0 0
Icmp: InMsgs InErrors InCsumErrors InDestUnreachs InTimeExcds InParmProbs InSrcQuenchs InRedirects InEchos InEchoReps InTimestamps InTimestampReps InAddrMasks InAddrMaskReps OutMsgs OutErrors OutDestUnreachs OutTimeExcds OutParmProbs OutSrcQuenchs OutRedirects OutEchos OutEchoReps OutTimestamps OutTimestampReps OutAddrMasks OutAddrMaskReps
Icmp: 149 0 0 50 99 0 0 0 0 0 0 0 0 0 147 0 147 0 0 0 0 0 0 0 0 0 0
IcmpMsg: InType3 InType11 OutType3
IcmpMsg: 50 99 147
Tcp: RtoAlgorithm RtoMin RtoMax MaxConn ActiveOpens PassiveOpens AttemptFails EstabResets CurrEstab InSegs OutSegs RetransSegs InErrs OutRsts InCsumErrors
Tcp: 1 200 120000 -1 376 6 0 0 4 236711 223186 292 0 4 0
Udp: InDatagrams NoPorts InErrors OutDatagrams RcvbufErrors SndbufErrors InCsumErrors
Udp: 1405 438 0 1896 0 0 0
UdpLite: InDatagrams NoPorts InErrors OutDatagrams RcvbufErrors SndbufErrors InCsumErrors
UdpLite: 0 0 0 0 0 0 0
Retransmission rate = 292 / 223186 ≈ 0.13%
- Average number of new TCP connections per second: get the increment of PassiveOpens in the last 240 seconds through / proc/net/snmp file, and divide by 240 to get the average increment per second;
- Number of TCP connections of the machine: get the number of TCP connections through CurrEstab in / proc/net/snmp file;
- Average UDP received datagrams per second: get the increment of InDatagrams in the last 240 seconds through / proc/net/snmp file, and divide by 240 to get the average UDP received datagrams per second;
- UDP sending datagrams per second on average: get the increment of OutDatagrams in the last 240 seconds through / proc/net/snmp file, and divide by 240 to get UDP sending datagrams per second on average;
Disk bottleneck
Check disk space
View remaining disk space
To view the remaining disk space, use the df -hl command:
[root@localhost ~]# df -hl
 file system                       Capacity used available used% Mount point
devtmpfs                       678M     0  678M    0% /dev
tmpfs                          695M     0  695M    0% /dev/shm
tmpfs                          695M   28M  667M    4% /run
tmpfs                          695M     0  695M    0% /sys/fs/cgroup
/dev/mapper/centos_aubin-root   27G  5.6G   22G   21% /
/dev/sda1                     1014M  211M  804M   21% /boot
View disk used space
The du -sh command is used to check the disk used space. The "used disk space" here means the space used by the whole file hierarchy under the specified file. Without giving parameters, du reports the disk space used by the current directory. In fact, it shows the disk space occupied by files or directories:
[root@localhost ~]# du -sh
64K
- -h: Output the usage of file system partitions, such as 10KB, 10MB, 10GB, etc.
- -s: Displays the size of the file or the entire directory. The default unit is KB.
The details of du can be viewed through man du.
View disk read and write
View the overall read and write status of the disk
Check the overall read and write status of the disk through iostat:
[root@localhost ~]# iostat
Linux 3.10.0-1062.el7.x86_64 (localhost.localdomain)    2020 May 2  _x86_64_        (2 CPU)

avg-cpu:  %user   %nice %system %iowait  %steal   %idle
           0.17    0.00    0.20    0.46    0.00   99.17

Device:            tps    kB_read/s    kB_wrtn/s    kB_read    kB_wrtn
sda               1.56        30.45        39.61    4659620    6060644
scd0              0.00         0.02         0.00       3102          0
dm-0              1.96        30.01        38.42    4591998    5878155
dm-1              0.09         0.09         0.30      13840      45328
- tps: the number of transfers per second of the device.
- kB_read/s: the amount of data read from the device (drive expressed) per second;
- kB_wrtn/s: the amount of data written to the device (drive expressed) per second;
- kB_read: the total amount of data read;
- kB_wrtn: total number of data written;
View the detailed read and write status of the disk
Through iostat -x 1 3, you can see the detailed read-write status of the disk. It is output every second for a total of three times. When you see that the I/O waiting time accounts for a high proportion of CPU time, the first thing to check is whether the machine is using a lot of swap space, and pay attention to whether iowait accounts for a large proportion of CPU consumption. If it is large, it indicates that there is a large bottleneck in the disk. At the same time, pay attention to await, Indicates the response time of the disk in order to be less than 5ms:
[root@localhost ~]# iostat -x 1 3
Linux 3.10.0-1062.el7.x86_64 (localhost.localdomain)    2020 May 2  _x86_64_        (2 CPU)

avg-cpu:  %user   %nice %system %iowait  %steal   %idle
           0.17    0.00    0.20    0.46    0.00   99.16

Device:         rrqm/s   wrqm/s     r/s     w/s    rkB/s    wkB/s avgrq-sz avgqu-sz   await r_await w_await  svctm  %util
sda               0.01     0.49    0.63    0.95    30.59    39.78    89.58     0.34  214.23   49.16  323.48   8.55   1.34
scd0              0.00     0.00    0.00    0.00     0.02     0.00    98.48     0.00    1.21    1.21    0.00   0.95   0.00
dm-0              0.00     0.00    0.62    1.35    30.15    38.59    69.70     0.91  460.67   49.12  648.54   6.66   1.31
dm-1              0.00     0.00    0.02    0.07     0.09     0.30     8.52     0.04  442.74   95.43  521.17   6.91   0.06
AVG cpu represents the statistics of overall cpu usage. For multi-core CPUs, here is the average value of all CPUs:
- %User: the percentage of time the CPU is in user mode.
- %NICE: the percentage of time the CPU is in user mode with NICE value.
- %System: the percentage of time the CPU is in system mode.
- %Iowait: the percentage of time the CPU waits for input and output to complete. If the value of% iowait is too high, it indicates that there is an I/O bottleneck in the hard disk.
- %Steel: the percentage of unconscious wait time of the virtual CPU when the hypervisor maintains another virtual processor.
- %Idle: the percentage of CPU idle time. If the% idle value is high, it indicates that the CPU is idle; If the% idle value is high but the system response is slow, the CPU may be waiting for memory allocation, and the memory capacity should be increased; If the% idle value continues to be lower than 10, it indicates that the CPU processing capacity is relatively low, and the most resource to be solved in the system is CPU..
Device indicates device information:
- rrqm/s: the number of times read requests to the device are merged per second. The file system will merge requests to read the same block
- wrqm/s: the number of times write requests to the device are merged per second
- r/s: number of reads completed per second
- w/s: number of writes completed per second
- rkB/s: data read per second (in kB)
- wkB/s: amount of data written per second (in kB)
- avgrq-sz: average amount of data per IO operation (in sectors)
- avgqu-sz: average IO request queue length waiting to be processed
- await: average waiting time of each IO request (including waiting time and processing time, in milliseconds)
- svctm: average processing time of each IO request (in milliseconds)
- %Util: what percentage of a second is spent on I/O. if% util is close to 100%, it indicates that there are too many I/O requests and the I/O system is fully loaded. When the idle is less than 70%, the IO pressure is large. Generally, the reading speed has more wait.
The output unit of - xmiod can be - XMM.
View the processes that consume the most IO
Generally, first check whether there is an IO bottleneck through iostat, and then use the iotop command to locate the process that consumes the most IO:
[root@localhost ~]# iotop
Total DISK READ :       0.00 B/s | Total DISK WRITE :       0.00 B/s
Actual DISK READ:       0.00 B/s | Actual DISK WRITE:       0.00 B/s
   TID  PRIO  USER     DISK READ  DISK WRITE  SWAPIN     IO>    COMMAND
123931 be/4 root        0.00 B/s    0.00 B/s  0.00 %  0.02 % [kworker/1:30]
 94208 be/4 xiaolyuh    0.00 B/s    0.00 B/s  0.00 %  0.00 % nautilus-desktop --force [gmain]
     1 be/4 root        0.00 B/s    0.00 B/s  0.00 %  0.00 % systemd --system --deserialize 62
     2 be/4 root        0.00 B/s    0.00 B/s  0.00 %  0.00 % [kthreadd]
 94211 be/4 xiaolyuh    0.00 B/s    0.00 B/s  0.00 %  0.00 % gvfsd-trash --spawner :1.4 /org/gtk/gvfs/exec_spaw/0
     4 be/0 root        0.00 B/s    0.00 B/s  0.00 %  0.00 % [kworker/0:0H]
     6 be/4 root        0.00 B/s    0.00 B/s  0.00 %  0.00 % [ksoftirqd/0]
     7 rt/4 root        0.00 B/s    0.00 B/s  0.00 %  0.00 % [migration/0]
     8 be/4 root        0.00 B/s    0.00 B/s  0.00 %  0.00 % [rcu_bh]
     9 be/4 root        0.00 B/s    0.00 B/s  0.00 %  0.00 % [rcu_sched]
    10 be/0 root        0.00 B/s    0.00 B/s  0.00 %  0.00 % [lru-add-drain]
...
You can view the IO status of a single process through iotop -p pid:
[root@localhost ~]# iotop -p 124146
Total DISK READ :       0.00 B/s | Total DISK WRITE :       0.00 B/s
Actual DISK READ:       0.00 B/s | Actual DISK WRITE:       0.00 B/s
   TID  PRIO  USER     DISK READ  DISK WRITE  SWAPIN     IO>    COMMAND
124146 be/4 root        0.00 B/s    0.00 B/s  0.00 %  0.00 % java -jar arthas-demo.jar
Application bottleneck
View the PID of a process
For example, check the pid of java process, ps -ef | grep java:
[root@localhost ~]# ps -ef | grep java
root     124146   1984  0 09:13 pts/0    00:00:06 java -jar arthas-demo.jar
root     125210  98378  0 10:07 pts/1    00:00:00 grep --color=auto java
View the number of specific processes
To view the number of java processes, ps -ef | grep java| wc -l:
[root@localhost ~]# ps -ef | grep java| wc -l
2
Check whether the thread has deadlock
Check whether the thread has deadlock. jstack -l pid:
[root@localhost ~]# jstack -l 124146
2020-05-02 10:13:38
Full thread dump OpenJDK 64-Bit Server VM (25.252-b09 mixed mode):

"C1 CompilerThread1" #6 daemon prio=9 os_prio=0 tid=0x00007f27f013c000 nid=0x1e4f9 waiting on condition [0x0000000000000000]
   java.lang.Thread.State: RUNNABLE

   Locked ownable synchronizers:
        - None

"C2 CompilerThread0" #5 daemon prio=9 os_prio=0 tid=0x00007f27f012d000 nid=0x1e4f8 waiting on condition [0x0000000000000000]
   java.lang.Thread.State: RUNNABLE

   Locked ownable synchronizers:
        - None

"main" #1 prio=5 os_prio=0 tid=0x00007f27f004b800 nid=0x1e4f3 waiting on condition [0x00007f27f7274000]
   java.lang.Thread.State: TIMED_WAITING (sleeping)
        at java.lang.Thread.sleep(Native Method)
        at java.lang.Thread.sleep(Thread.java:340)
        at java.util.concurrent.TimeUnit.sleep(TimeUnit.java:386)
        at demo.MathGame.main(MathGame.java:17)

   Locked ownable synchronizers:
        - None
...
View the number of threads in a process
ps -efL | grep [PID] | wc -l, such as:
[root@localhost ~]# ps -efL | grep 124146 | wc -l
12
Check which threads use ps -Lp [pid] cu:
[root@localhost ~]# ps -Lp 124146 cu
USER        PID    LWP %CPU NLWP %MEM    VSZ   RSS TTY      STAT START   TIME COMMAND
root     124146 124146  0.0   11  2.5 2489116 35724 pts/0   Sl+  09:13   0:00 java
root     124146 124147  0.0   11  2.5 2489116 35724 pts/0   Sl+  09:13   0:01 java
root     124146 124148  0.0   11  2.5 2489116 35724 pts/0   Sl+  09:13   0:00 VM Thread
root     124146 124149  0.0   11  2.5 2489116 35724 pts/0   Sl+  09:13   0:00 Reference Handl
root     124146 124150  0.0   11  2.5 2489116 35724 pts/0   Sl+  09:13   0:00 Finalizer
root     124146 124151  0.0   11  2.5 2489116 35724 pts/0   Sl+  09:13   0:00 Signal Dispatch
root     124146 124152  0.0   11  2.5 2489116 35724 pts/0   Sl+  09:13   0:00 C2 CompilerThre
root     124146 124153  0.0   11  2.5 2489116 35724 pts/0   Sl+  09:13   0:00 C1 CompilerThre
root     124146 124154  0.0   11  2.5 2489116 35724 pts/0   Sl+  09:13   0:00 Service Thread
root     124146 124155  0.1   11  2.5 2489116 35724 pts/0   Sl+  09:13   0:05 VM Periodic Tas
root     124146 125362  0.0   11  2.5 2489116 35724 pts/0   Sl+  10:13   0:00 Attach Listener
Count the lines containing Error characters in all log files
find / -type f -name "*.log" | xargs grep "ERROR", which is useful in troubleshooting:
[root@localhost ~]# find / -type f -name "*.log" | xargs grep "ERROR"
/var/log/tuned/tuned.log:2020-03-13 18:05:59,145 ERROR    tuned.utils.commands: Writing to file '/sys/devices/system/cpu/cpu0/cpufreq/scaling_governor' error: '[Errno 19] No such device'
/var/log/tuned/tuned.log:2020-03-13 18:05:59,145 ERROR    tuned.utils.commands: Writing to file '/sys/devices/system/cpu/cpu1/cpufreq/scaling_governor' error: '[Errno 19] No such device'
/var/log/tuned/tuned.log:2020-04-28 14:55:34,857 ERROR    tuned.utils.commands: Writing to file '/sys/devices/system/cpu/cpu0/cpufreq/scaling_governor' error: '[Errno 19] No such device'
/var/log/tuned/tuned.log:2020-04-28 14:55:34,859 ERROR    tuned.utils.commands: Writing to file '/sys/devices/system/cpu/cpu1/cpufreq/scaling_governor' error: '[Errno 19] No such device'
/var/log/tuned/tuned.log:2020-04-28 15:23:19,037 ERROR    tuned.utils.commands: Writing to file '/sys/devices/system/cpu/cpu0/cpufreq/scaling_governor' error: '[Errno 19] No such device'
...
Specify JVM parameters when the application starts
java -jar -Xms128m -Xmx1024m -Xss512k -XX:PermSize=128m -XX:MaxPermSize=64m -XX:NewSize=64m -XX:MaxNewSize=256m arthas-demo.jar, such as:
[root@localhost ~]# java -jar -Xms128m -Xmx1024m -Xss512k -XX:PermSize=128m -XX:MaxPermSize=64m -XX:NewSize=64m -XX:MaxNewSize=256m  arthas-demo.jar
OpenJDK 64-Bit Server VM warning: ignoring option PermSize=128m; support was removed in 8.0
OpenJDK 64-Bit Server VM warning: ignoring option MaxPermSize=64m; support was removed in 8.0
157518=2*3*3*3*2917
illegalArgumentCount:  1, number is: -187733, need >= 2
illegalArgumentCount:  2, number is: -102156, need >= 2
173379=3*57793
summary
When using linux commands, if you want to see help, you can use -- help or man to view help information:
[root@localhost ~]# grep --help
 usage: grep [option]... PATTERN [FILE]...
In each FILE Or search in standard input PATTERN.
default PATTERN Is a basic regular expression(Abbreviated as BRE).
for example: grep -i 'hello world' menu.h main.c
...
[root@localhost ~]# man grep

GREP(1)                                                        General Commands Manual                                                        GREP(1)

NAME
       grep, egrep, fgrep - Print lines that match the given pattern

Overview SYNOPSIS
       grep [options] PATTERN [FILE...]
       grep [options] [-e PATTERN | -f FILE] [FILE...]

describe DESCRIPTION
       Grep    Search to    FILE    Named file import   (Or standard input, if no file name is specified, or the given file name is   -   Words),Look for patterns with given   PATTERN
...
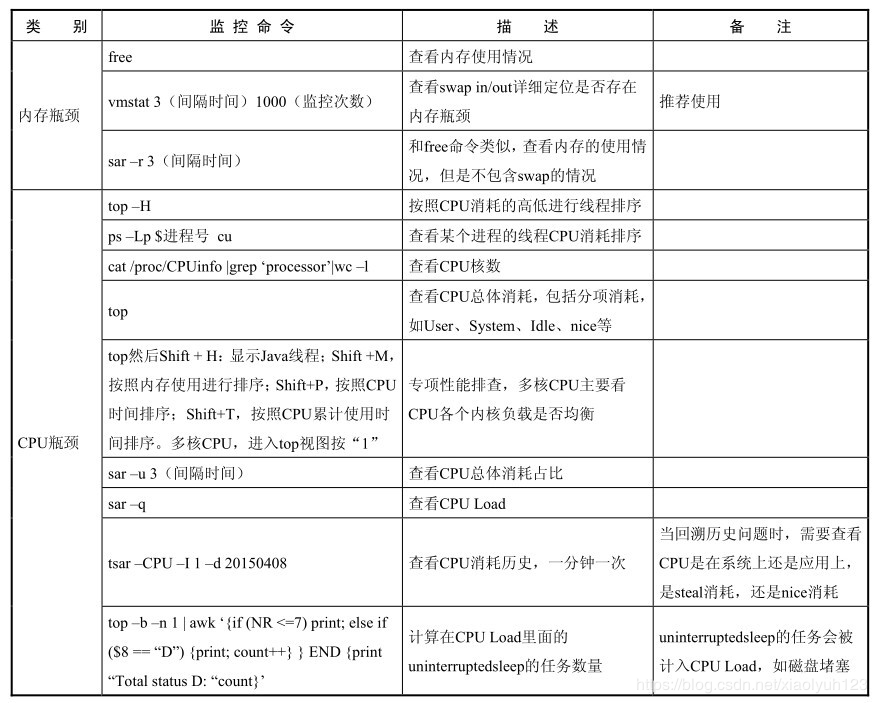
| category | Monitoring command | describe | remarks |
|---|---|---|---|
| Memory bottleneck | free | View memory usage | |
| Vmstat 3 (interval time) 100 (monitoring times) | Check whether there are performance bottlenecks in the detailed positioning of swap in/out | Recommended use | |
| sar -r 3 | Similar to the free command, check the memory usage, but not swap | ||
| cpu bottleneck | top -H | Sort by cpu consumption | |
| ps -Lp process number cu | View the ranking of cpu consumption of a process | ||
| cat /proc/cpuinfo |grep 'processor'|wc -l | View cpu cores | ||
| top | Check the overall cpu consumption, including itemized consumption, such as user,system,idle,nice and so on | ||
| Top + H: display java threads, and then shift+M: sort by memory usage; shift+P: sort by cpu time; shift+T: sort multi-core CPUs according to the cumulative cpu usage time, and press "1" to enter the top view | For special performance troubleshooting, multi-core CPU mainly depends on the load of each core of CUP | ||
| SAR -u 3 (interval time) | View the proportion of total cpu consumption | ||
| sar -q | View cpu load | ||
| top -b -n 1 | awk '{if (NR<=7)print;else if($8=="D"){print;count++}}END{print "Total status D:"count}' | Calculate the number of uninterrupted sleep tasks in cpu load. Uninterrupted sleep tasks will be included in cpu load, such as disk congestion | ||
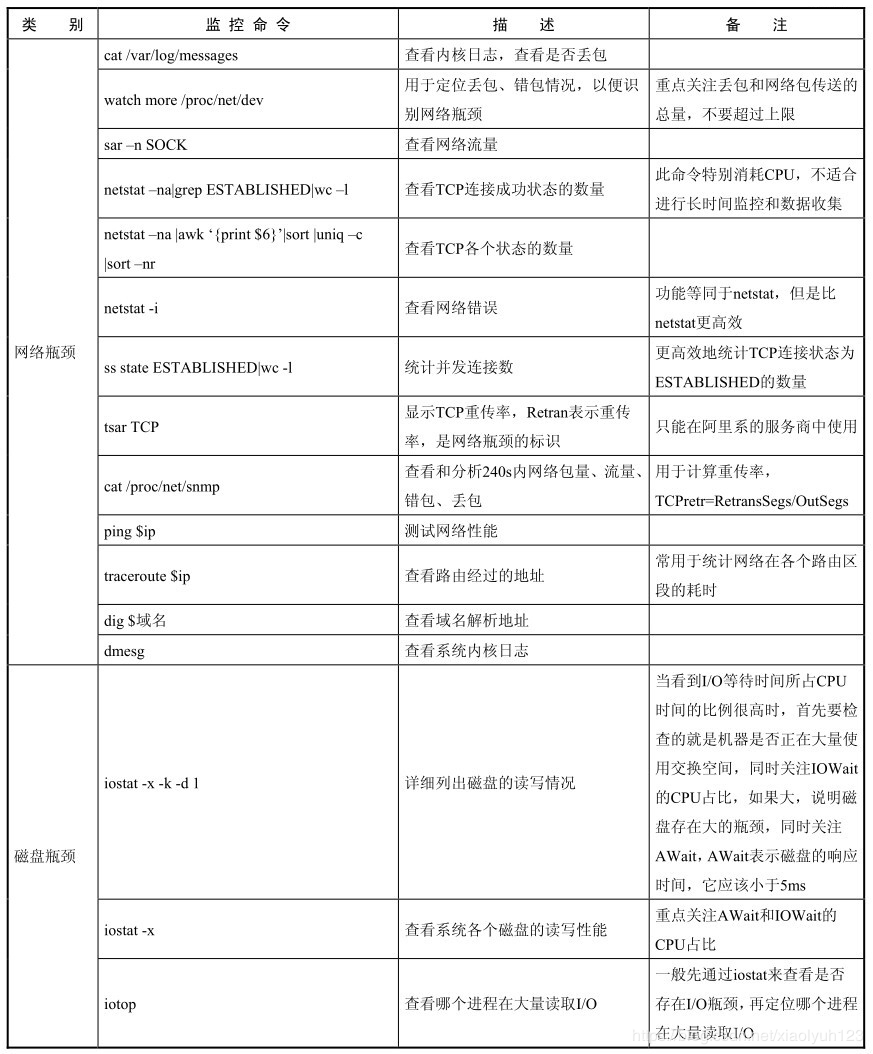
| Network bottleneck | cat /var/log/messages | Check the kernel log to see if there is packet loss | |
| watch more /proc/net/dev | It is used to locate packet loss and error, so as to see the network bottleneck | Focus on the total amount of drop (packet discarded) and network packet transmission, and do not exceed the network limit | |
| sar -n SOCK | View network traffic | ||
| netstat -na|grep ESTABLISHED|wc -l | View the number of tcp connection success status | This command consumes cpu and is not suitable for long-time monitoring data collection | |
| netstat -na|awk'{print $6}'|sort |uniq -c |sort -nr | Look at the number of tcp states | ||
| netstat -i | View network errors | ||
| ss state ESTABLISHED| wc -l | More efficiently count the number of tcp connections whose status is ESTABLISHED | ||
| cat /proc/net/snmp | View and analyze the network packet volume, traffic, packet error and packet loss in 240 seconds | Used to calculate retransmission rate tcpetr=RetransSegs/OutSegs | |
| ping $ip | Test network performance | ||
| traceroute $ip | View routing addresses | It is often used to locate the time consumption of the network in each routing section | |
| dig $domain name | View domain name resolution address | ||
| dmesg | View the system kernel log | ||
| Disk bottleneck | iostat -x -k -d 1 | List the read and write status of the disk in detail | When you see that the I/O waiting time accounts for a high proportion of CPU time, the first thing to check is whether the machine is using a lot of switching space. At the same time, pay attention to whether iowait accounts for a large proportion of CPU consumption. If it is large, it indicates that there is a large bottleneck in the disk. At the same time, pay attention to await, which indicates that the response time of the disk is less than 5ms |
| iostat -x | Check the read-write performance of each disk in the system | Focus on the cpu proportion of await and iowait | |
| iotop | See which process is reading a lot of IO | Generally, first check whether there is an IO bottleneck through iostat, and then locate which process is reading a lot of Io | |
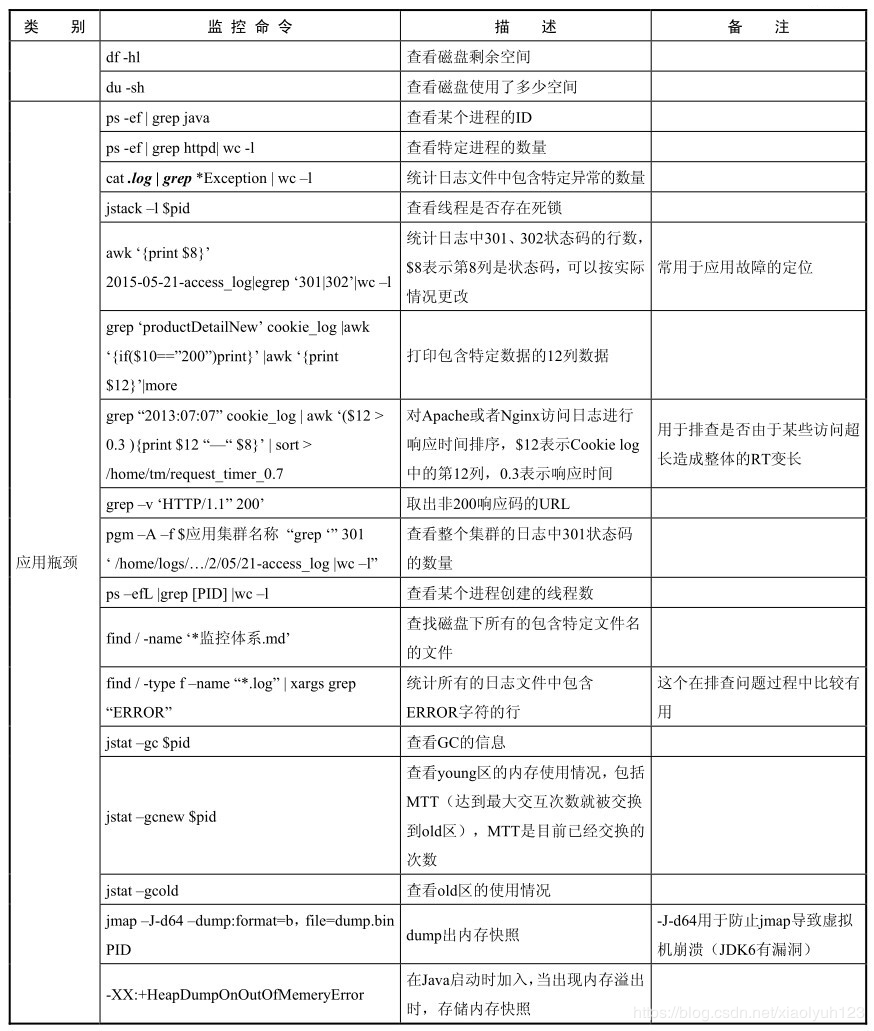
| df -hl | View remaining disk space | ||
| du -sh | See how much disk space is used | ||
| Application bottleneck | ps -ef | grep java | View the id number of a process |
| ps -ef | grep httpd| wc -l | View the number of specific processes | ||
| cat ***.log | grep ***Exception| wc -l | Count the number of specific exceptions contained in the log file | ||
| jstack -l pid | Used to check whether the thread has deadlock | ||
| awk'{print $8}' 2017-05-22-access_log|egrep '301|302'| wc -l | Count the number of rows of 301 and 302 status codes in the log, $8 indicates that the eighth column is the status code, which can be changed according to the actual situation | Commonly used for fault location | |
| grep 'wholesaleProductDetailNew' cookie_log | awk '{if($10=="200")}'print}' | awk 'print $12' | more | Print 12 columns of data containing specific data | |
| grep "2017:05:22" cookielog | awk '($12 > 0.3) {print $12 "–" $8}' | sort > directory address | Sort the response time of apache or nginx access logs, $12 indicates that the 12 columns in the cookie log indicate that the response time is used to check whether the overall RT becomes longer due to the excessive length of some accesses | ||
| grep -v 'HTTP/1.1" 200' | Take out the URL of non-200 response code | ||
| pgm -A -f $application cluster name "grep" '301' log file address | wc -l " | View the number of 301 status codes in the log of the whole cluster | ||
| ps -efL | grep [PID] | wc -l | View the number of threads created by a process | ||
| find / -type f -name "*.log" | xargs grep "ERROR" | Count the lines containing Error characters in all log files | This is useful in troubleshooting | |
| jstat -gc [pid] | View gc status | ||
| jstat -gcnew [pid] | Check the memory usage of the young area, including MTT (the maximum number of interactions is exchanged to the old area). TT is the number of times that have been exchanged so far | ||
| jstat -gcold | Check the memory usage of the old area | ||
| jmap -J-d64 -dump:format=b,file=dump.bin PID | dump out memory snapshot | -J-d64 prevents jmap from causing virtual machine crash(jdk6 has a bug) | |
| -XX:+HeapDumpOnOutOfMemeryError | It is added when java starts. When memory overflow occurs, memory snapshot is stored | ||
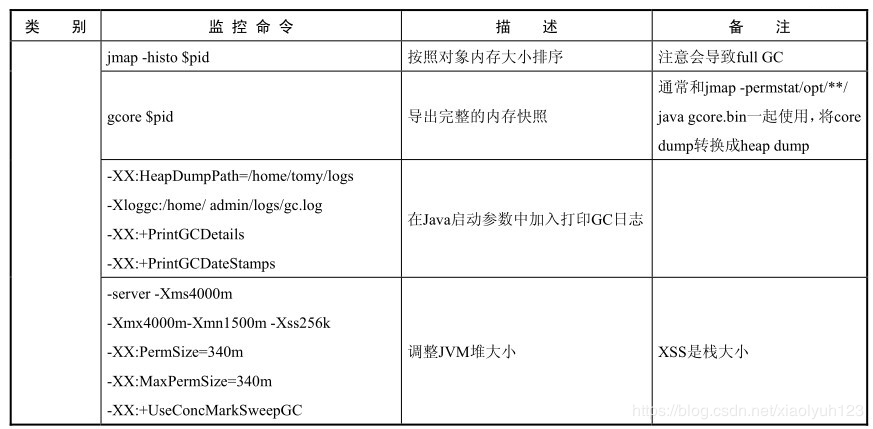
| jmap -histo [pid] | Sort by object memory size | Note that it will cause full gc | |
| gcore [pid] | Export completed memory snapshot | Usually with jmap - permstat / opt / * * / Java gcore Bin is used together to convert core dump into heap dump | |
| -XX:HeapDumpPath=/home/logs -Xloggc:/home/log/gc.log -XX:+PrintGCDetails -XX:+PrintGCDateStamps | Add in the Java startup parameters and print the gc log | ||
| -server -Xms4000m -Xmx4000m -Xmn1500m -Xss256k -XX:PermSize=340m -XX:MaxPermSize=340m -XX:+UseConcMarkSweepGC | Resize JVM heap | xss is the stack size |