Arthas online analysis, diagnosis and tuning tool
In the past, we used to troubleshoot online problems, usually using the jdk's own tuning tools and commands. The most common is the dump online log, which is then downloaded locally and imported into the jvisual VM tool. There are many changes in this operation. The Arhtas tool developed by Ali team now has very powerful functions and is just needed online. Especially in case of emergency, it is not convenient to release the version immediately. It is suitable for temporary handling of emergencies. The JVM performance tuning tool is studied in two parts:
1.JDK's own performance tuning tool
Although you have Arthas, don't forget the JDK's own performance tuning tool, which is still very useful in some scenarios. Moreover, there are many functions in Arthas, which basically encapsulate these tuning commands provided by JDK.
2. Use of Arthas online analysis tool
This part mainly introduces several common methods for troubleshooting online problems. The function is really powerful. The ape Yuan who is just interested can study its basic principle. I discussed with my colleagues before. It feels like a virus. It can modify things in memory. It's really powerful.
There is no difference between the above two methods for troubleshooting online problems. If you can't install Arthas online, it is the jdk's own command. If the jdk's own command can't meet some requirements and you can install Arthas, use Arthas. They are just tools for troubleshooting problems. What is important is the idea of troubleshooting problems. Whether black or white, a good cat is one that can catch mice.
1, JDK's own tuning tool
This is not a flow like introduction to how to use the function. Let's talk about the problems encountered online, how we usually check and several cases of troubleshooting.
- Memory overflows and OutOfMemoryError occurs. How to troubleshoot this problem
- CPU usage soars. How to troubleshoot this problem?
- The process has deadlock. How to troubleshoot this problem?
- JVM parameter tuning
Let's solve it one by one
1. Processing memory overflow and reporting OutOfMemoryError error
Step 1: check the system memory usage through the jmap -histo command
Commands used:
jmap -histo Process number
Operation results:
num     #instances         #bytes  class name
----------------------------------------------
	 1:       1101980      372161752  [B
   2:        551394      186807240  [Ljava.lang.Object;
   3:       1235341      181685128  [C
   4:         76692      170306096  [I
   5:        459168       14693376  java.util.concurrent.locks.AbstractQueuedSynchronizer$Node
   6:        543699       13048776  java.lang.String
   7:        497636       11943264  java.util.ArrayList
   8:        124271       10935848  java.lang.reflect.Method
   9:        348582        7057632  [Ljava.lang.Class;
  10:        186244        5959808  java.util.concurrent.ConcurrentHashMap$Node
  8671:      1             16  zipkin2.reporter.Reporter$1
  8672:      1             16  zipkin2.reporter.Reporter$2

Total       8601492      923719424


num: Serial number
instances: Number of instances
bytes: Occupied space size
class name: Class name,[C is a char[],[S is a short[],[I is a int[],[B is a byte[],[[I is a int[][]
Through this command, we can see which object consumes the most memory at present.
The above running result is the result of starting a local project and running [jmap -histro process No.] and directly going to part of it. Here we can see if there are any custom instance objects in the large instance objects. Through this, you can find out which instance object caused the memory overflow.
In addition, the Total summary data shows how many objects are currently in Total and how much memory space is temporarily used. There are about 860w objects here, occupying about 923M of space.
Step 2: analyze the memory overflow and check the occupation of heap space
Use command
jhsdb jmap --heap --pid Process number
For example, I started a project locally and wanted to check the memory usage of the project:
[root@iZ2pl8Z ~]# jhsdb jmap --heap --pid 28692

Attaching to process ID 28692, please wait...
Debugger attached successfully.
Server compiler detected.
JVM version is 11.0.13+10-LTS-370

using thread-local object allocation.
Garbage-First (G1) GC with 4 thread(s)

Heap Configuration:
   MinHeapFreeRatio         = 40
   MaxHeapFreeRatio         = 70
   MaxHeapSize              = 2065694720 (1970.0MB)
   NewSize                  = 1363144 (1.2999954223632812MB)
   MaxNewSize               = 1239416832 (1182.0MB)
   OldSize                  = 5452592 (5.1999969482421875MB)
   NewRatio                 = 2
   SurvivorRatio            = 8
   MetaspaceSize            = 21807104 (20.796875MB)
   CompressedClassSpaceSize = 1073741824 (1024.0MB)
   MaxMetaspaceSize         = 17592186044415 MB
   G1HeapRegionSize         = 1048576 (1.0MB)

Heap Usage:
G1 Heap:
   regions  = 1970
   capacity = 2065694720 (1970.0MB)
   used     = 467303384 (445.65523529052734MB)
   free     = 1598391336 (1524.3447647094727MB)
   22.622093161955704% used
G1 Young Generation:
Eden Space:
   regions  = 263
   capacity = 464519168 (443.0MB)
   used     = 275775488 (263.0MB)
   free     = 188743680 (180.0MB)
   59.36794582392776% used
Survivor Space:
   regions  = 6
   capacity = 6291456 (6.0MB)
   used     = 6291456 (6.0MB)
   free     = 0 (0.0MB)
   100.0% used
G1 Old Generation:
   regions  = 179
   capacity = 275775488 (263.0MB)
   used     = 186285016 (177.65523529052734MB)
   free     = 89490472 (85.34476470947266MB)
   67.54951912187352% used
Let's take a look at the meaning of parameters
Heap space configuration information
Heap Configuration:
  /**
   * The minimum percentage of free heap space. The calculation formula is: HeapFreeRatio =(CurrentFreeHeapSize/CurrentTotalHeapSize) * 100. The range of values is 0 	  *  To 100, the default value is 40. If heapfreeratio < minheapfreeratio, heap expansion is required, and the expansion time should be after each garbage collection.
   */
	MinHeapFreeRatio = 40
  /**
   * The maximum percentage of free heap space. The calculation formula is: HeapFreeRatio =(CurrentFreeHeapSize/CurrentTotalHeapSize) * 100. The range of values is 0
   * To 100, the default value is 70. If heapfreeratio > maxheapfreeratio, it is necessary to shrink the heap. The time of shrinking should be after each garbage collection
   */
  MaxHeapFreeRatio         = 70
  /**JVM Maximum allowed heap space*/
  MaxHeapSize              = 2065694720 (1970.0MB)
  /** JVM Default value for Cenozoic heap space*/
  NewSize                  = 1363144 (1.2999954223632812MB)
  /** JVM Maximum allowable Cenozoic heap space */
  MaxNewSize               = 1239416832 (1182.0MB)
  /** JVM Default value for heap space */
  OldSize                  = 5452592 (5.1999969482421875MB)
  /** The ratio of heap space between Cenozoic (2 Survivor areas and Eden areas) and old generation (excluding permanent area), indicating Cenozoic: old age = 1:2*/
  NewRatio                 = 2
  /** The heap space ratio of two Survivor areas and Eden area is 8, indicating S0: S1: Eden = 1:1:8 */
  SurvivorRatio            = 8
  /** JVM Default values for meta spaces */
  MetaspaceSize            = 21807104 (20.796875MB)
  CompressedClassSpaceSize = 1073741824 (1024.0MB)
  /** JVM Maximum allowed in meta space */
  MaxMetaspaceSize         = 17592186044415 MB
  /** When using G1 garbage collection algorithm, the JVM will separate the Heap space into several regions. This parameter is used to specify the size of each Region space */
  G1HeapRegionSize         = 1048576 (1.0MB)
Usage of G1 reactor
Heap Usage:
G1 Heap:
   regions  = 1970
   capacity = 2065694720 (1970.0MB)
   used     = 467303384 (445.65523529052734MB)
   free     = 1598391336 (1524.3447647094727MB)
   22.622093161955704% used

G1 of Heap Usage, the Heap Including 1970 Region,Combined with each of the above RegionSize=1M,therefore Capacity = Regions * RegionSize = 1970 * 1M = 1970M,The used space is 445.65M,The free space is 1524.34M,The utilization rate is 22.62%.
Use of G1 young generation Eden District
G1 Young Generation:
Eden Space:
   regions  = 263
   capacity = 464519168 (443.0MB)
   used     = 275775488 (263.0MB)
   free     = 188743680 (180.0MB)
   59.36794582392776% used


G1 of Eden A total of 263 were used Region,Combined with each of the above RegionSize=1M,therefore Used = Regions * RegionSize = 263 * 1M = 263M,Capacity=443M Indicate current Eden 443 spaces were allocated Region,The utilization rate is 59.37%.
Usage of the younger generation Survivor area of G1 and that of the older generation of G1: similar to Eden area
Survivor Space:
   regions  = 6
   capacity = 6291456 (6.0MB)
   used     = 6291456 (6.0MB)
   free     = 0 (0.0MB)
   100.0% used

G1 Old Generation:
   regions  = 179
   capacity = 275775488 (263.0MB)
   used     = 186285016 (177.65523529052734MB)
   free     = 89490472 (85.34476470947266MB)
   67.54951912187352% used

Survivor Area usage and Eden The area is similar. Old age parameter meaning and Eden The area is similar.
Through the above command, we can know the current system's use of space. Is there a problem in the old age or in the new generation.
Step 3: export the dump memory overflow file and import it into jvisualvm for viewing
If the first two methods still fail to find the problem, we can export the memory overflow log and analyze it on the import client
The commands used are:
jmap -dump:file=a.dump Process number
Or set JVM parameters directly
-XX:+HeapDumpOnOutOfMemoryError
-XX:HeapDumpPath=./ ((path)
Then import it into the jvisual VM for analysis. The method is: click file - > load, import the file, and view the operation of the system.
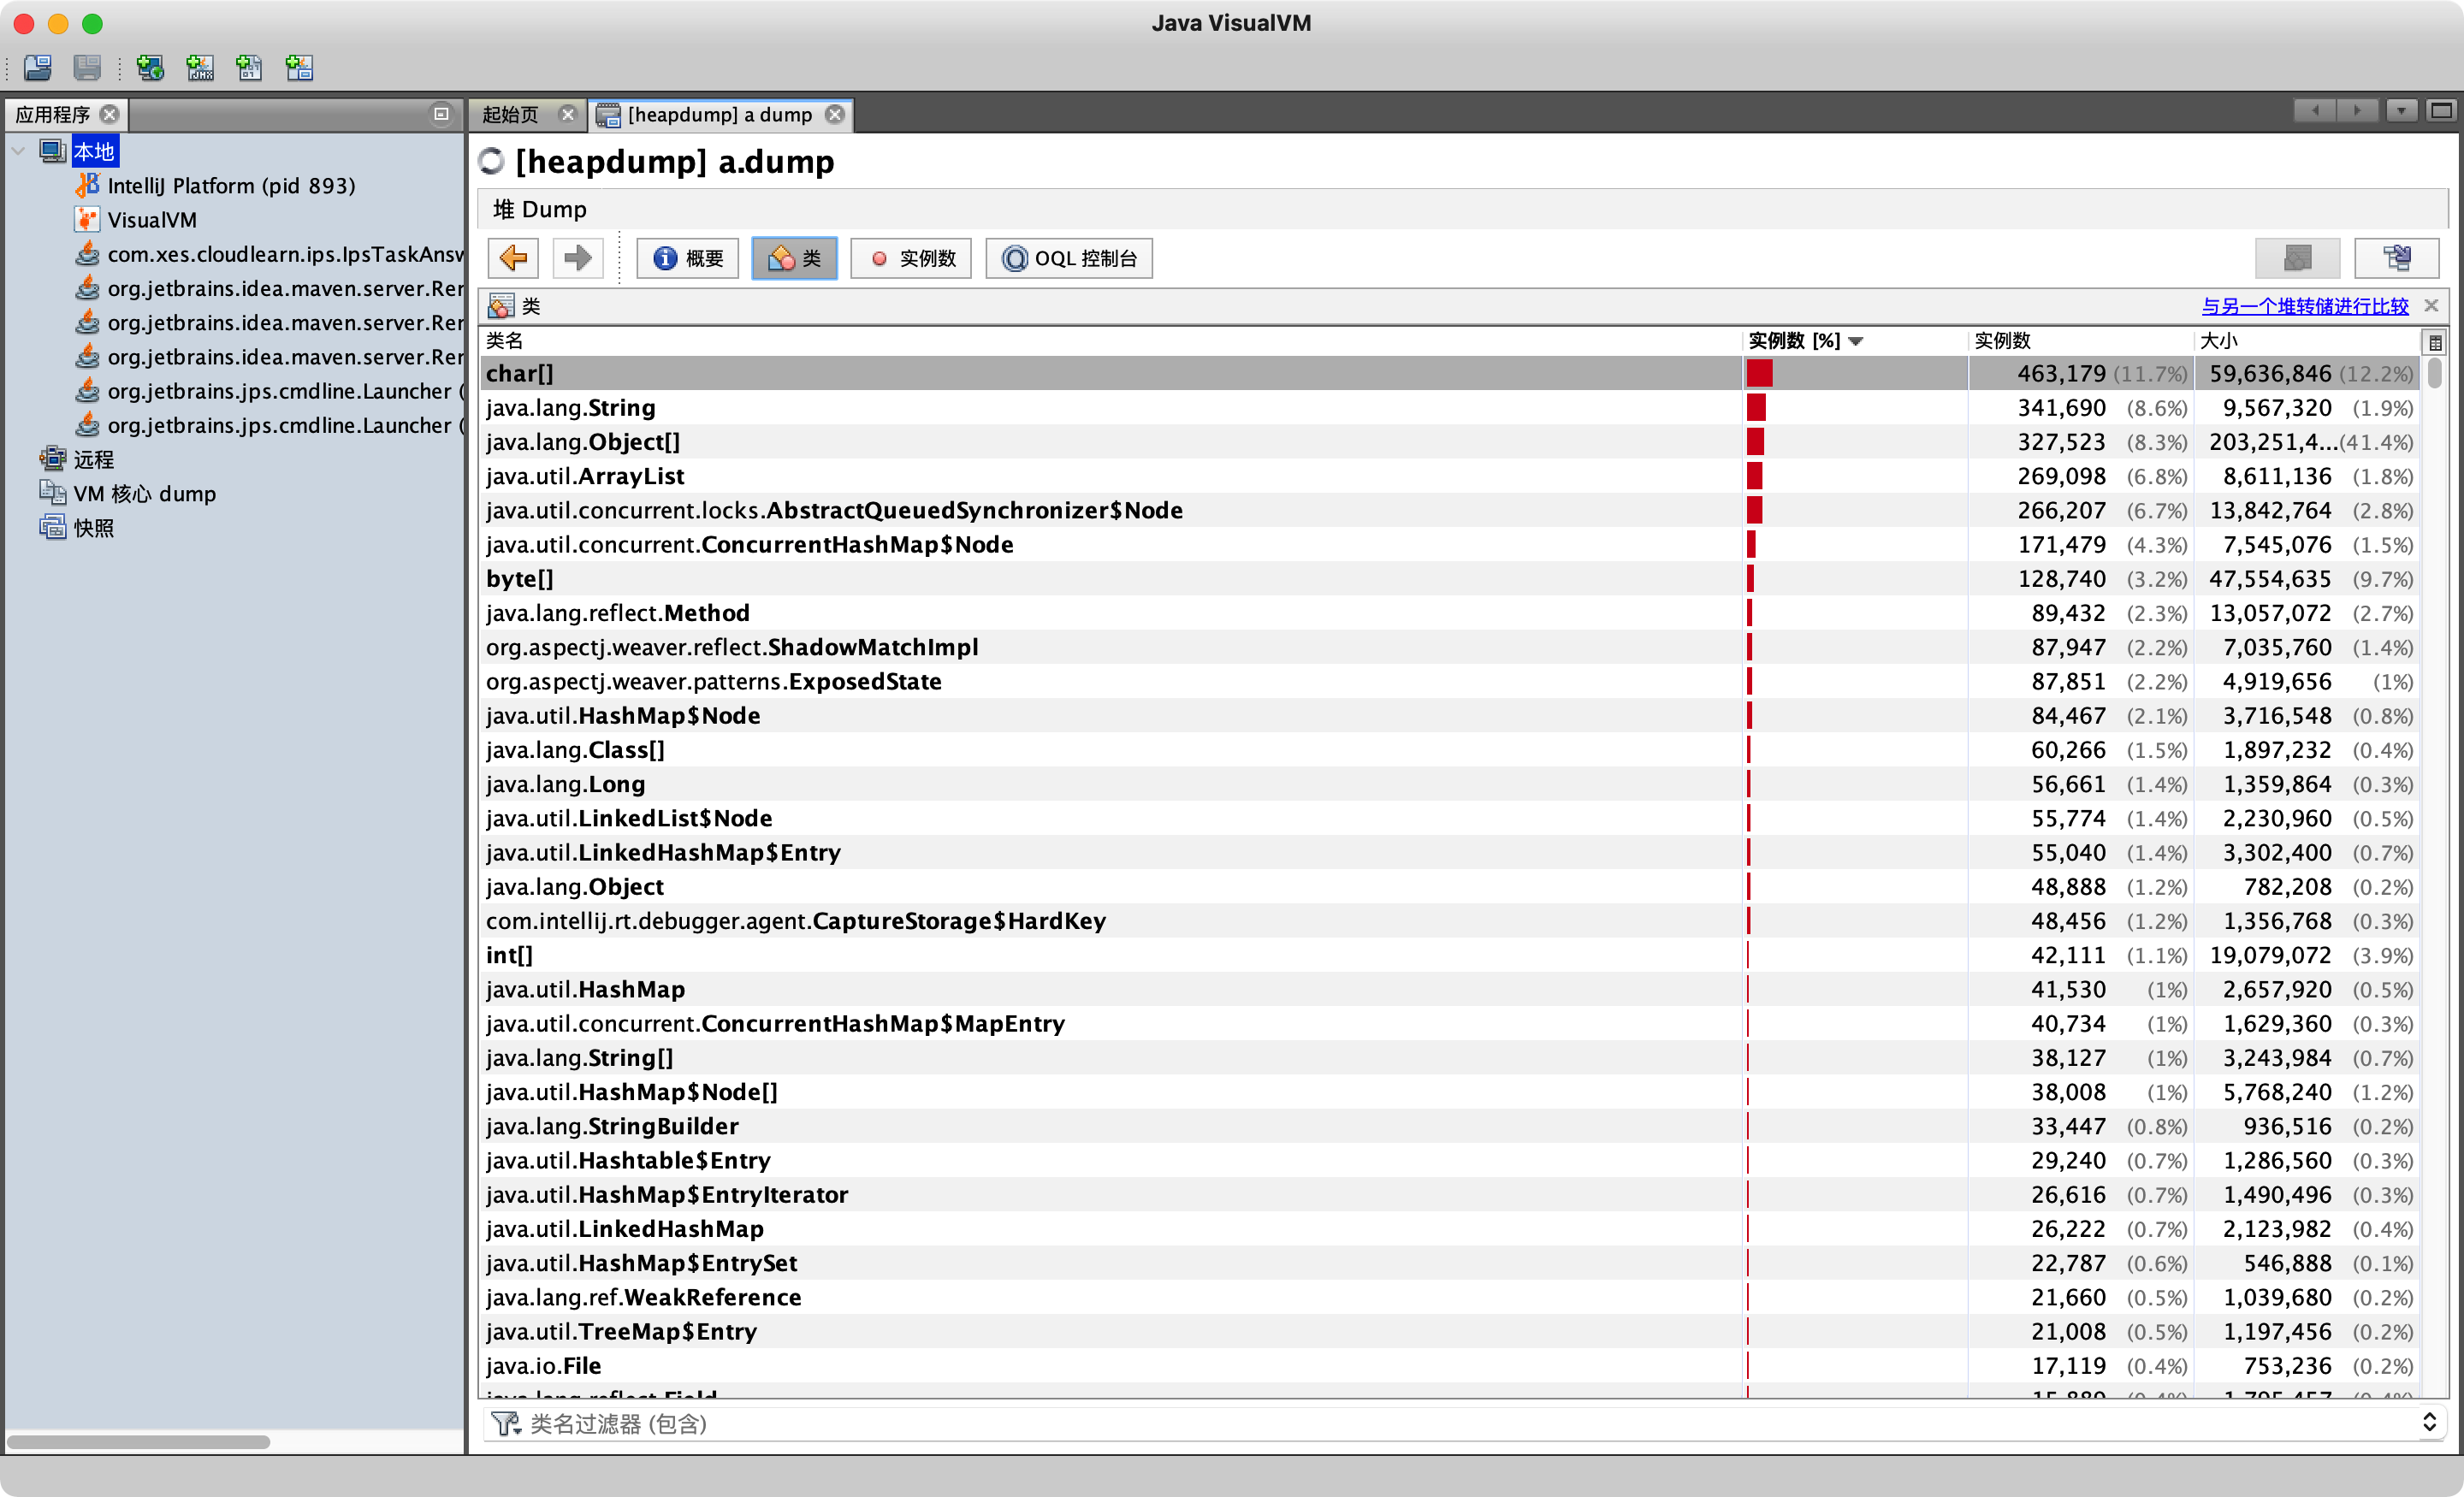
By analyzing the number of instances, we can see which object instance accounts for the highest proportion. Here we focus on our custom class, and then analyze whether there are large objects in this object, so as to find out the root cause of memory overflow.
2. CPU usage soars. How to troubleshoot this problem?
We can use Jstack to find the stack information of the thread that occupies the highest cpu. Let's analyze it step by step.
Suppose we have an endless loop in which method calls are executed continuously, and the thread runs all the time without releasing, which will lead to high CPU. The example code is as follows:
package com.lxl.jvm;

public class Math {
    public static int initData = 666;
    public static User user = new User();
    public User user1;

    public int compute() {
        int a = 1;
        int b = 2;
        int c = (a + b) * 10;
        return c;
    }

    public static void main(String[] args) {
        Math math = new Math();
        while(true){
            math.compute();

        }
    }
}
Step 1: run the code and use the top command to check the cpu usage
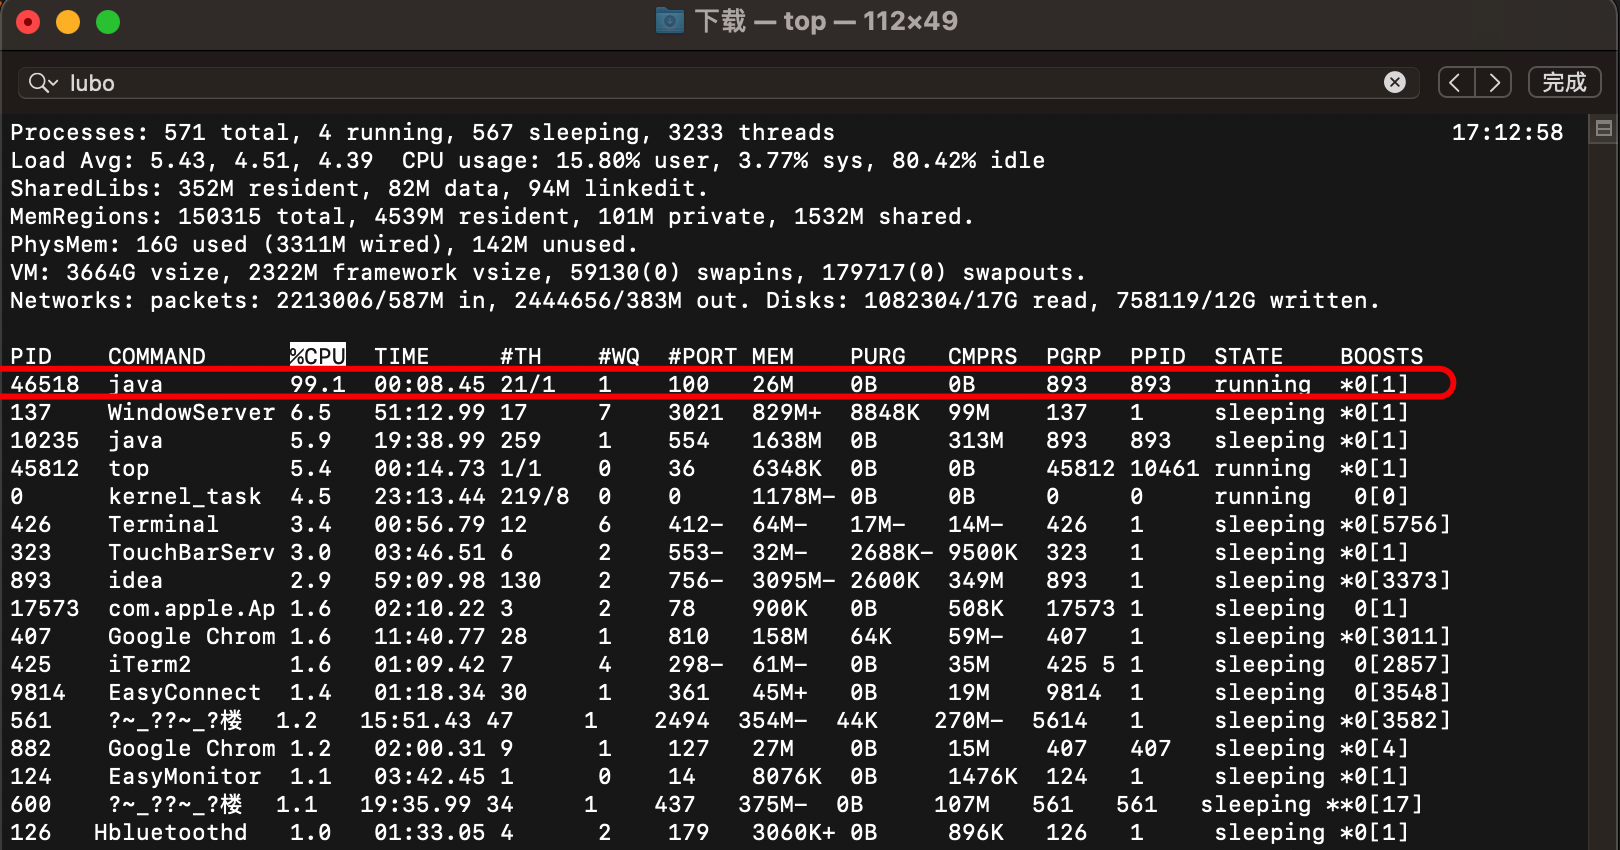
As mentioned above, now there is a java process, and the cpu has soared seriously. What should we do next?
Step 2: use the top -p command to view the soaring process
top -p 46518
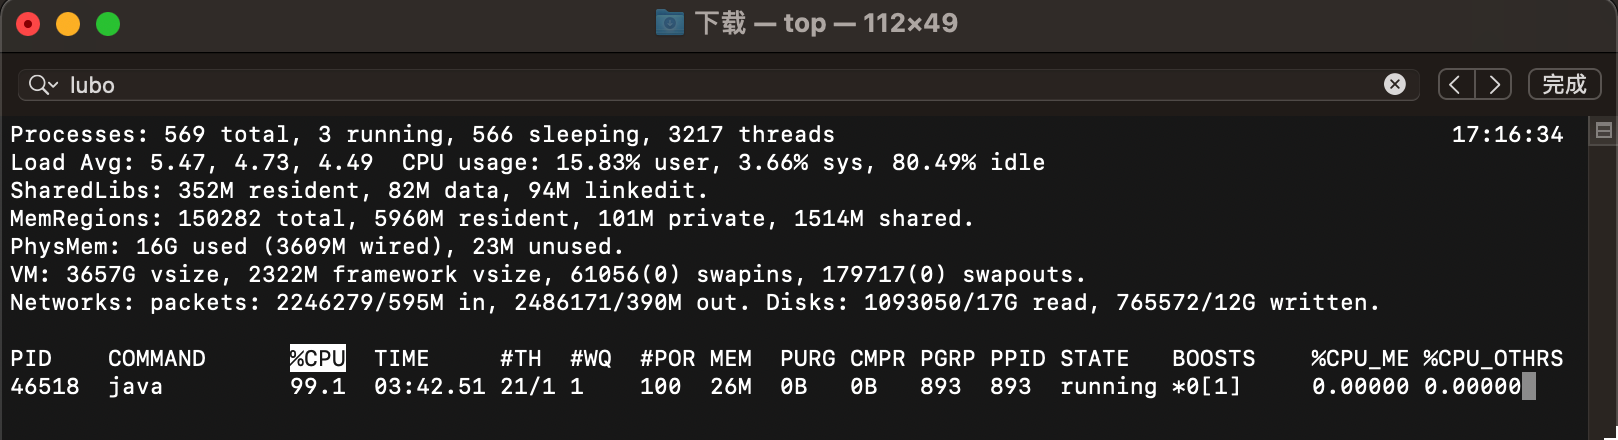
We see the details of this thread in a separate 46518
Step 3: press H to get the memory of each thread
It should be noted that h here is capital H.
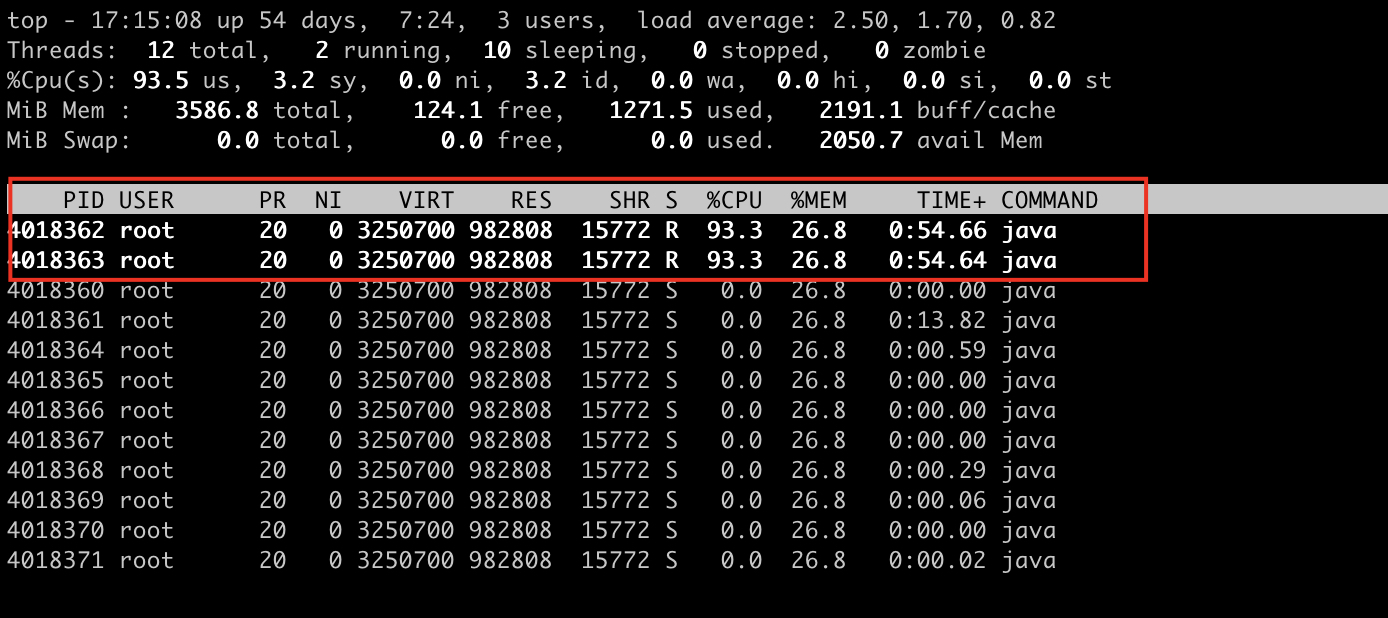
We can see that the thread numbers of thread 0 and thread 1 are soaring.
Step 4: find the thread tid with the highest memory and cpu consumption
From the above figure, we can see that there are two threads that occupy the highest cpu resources. The thread numbers are 40183624018363 respectively. Let's take the first example to illustrate how to query which thread this thread is and where there is a problem with this thread, resulting in a high cpu.
Step 5: convert thread tid to hexadecimal
67187778 is a hexadecimal number with thread number 4013442. For specific conversion, you can use online query tools.
Step 6: execute [jstack 4018360|grep -A 10 67187778] to query the stack information of the soaring thread
Next, query the stack information of the soaring thread
jstack 4013440|grep -A 10 67190882
- 4013440: indicates the process number
- 67187778: indicates the hexadecimal number corresponding to the thread number
In this way, you can query the stack information corresponding to this thread
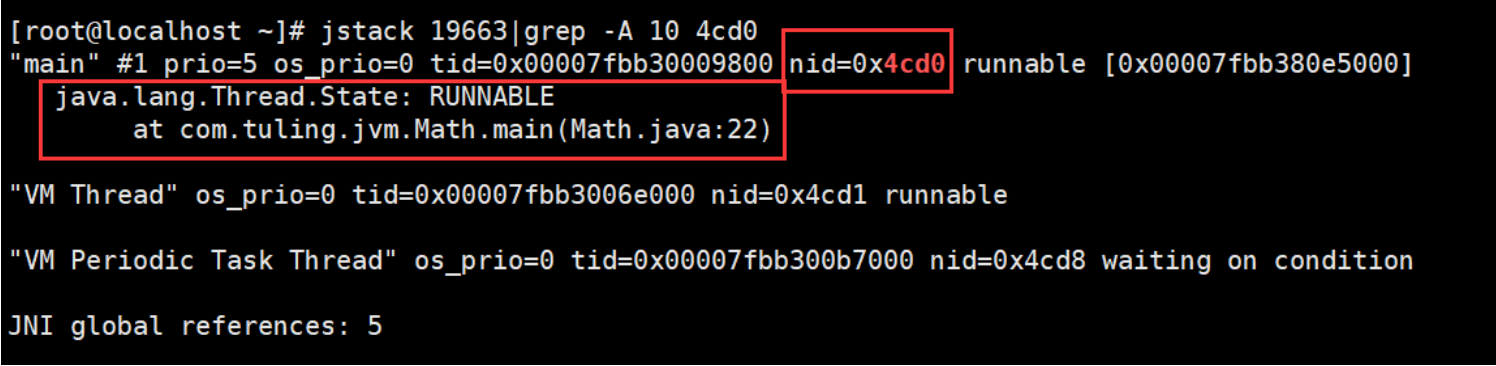
From here, we can see that the thread id in question is 0x4cd0. Which code is in question? Line 22 of Math class.
Step 7: check the corresponding stack information to find out the code with possible problems
The above method has been very accurate in locating problems. The next step is to check why there are problems in the area code.
Note: the above process id may not correspond to the process id. during the test, you need to write the process id and thread id
3. The process has deadlock. How to troubleshoot this problem?
Jstack can be used to view stack usage and process deadlock. Let's take a look at how to troubleshoot process deadlock
Or through case analysis
package com.lxl.jvm;

public class DeadLockTest {
    private static Object lock1 = new Object();
    private static Object lock2 = new Object();

    public static void main(String[] args) {
        new Thread(() -> {
            synchronized (lock1) {
                try {
                    System.out.println("thread1 begin");
                    Thread.sleep(5000);
                } catch (InterruptedException e) {

                }
                synchronized (lock2) {
                    System.out.println("thread1 end");
                }
            }
        }).start();

        new Thread(() -> {
            synchronized (lock2) {
                try {
                    System.out.println("thread2 begin");
                    Thread.sleep(5000);
                } catch (InterruptedException e) {

                }
                synchronized (lock1) {
                    System.out.println("thread2 end");
                }
            }
        }).start();
    }
}
Above are two locks that call each other.
- Two member variables lock1 and lock2 are defined
- Two threads are defined in the main method.
- Thread 1 uses synchronous execution -- lock, which is lock1. After sleeping for 5 seconds, he wants to obtain the second lock and execute the second piece of code.
- Thread 2 is similar to thread 1 in that phase locking is reversed.
- Problem: at the beginning, it is like a thread executing in parallel. Thread 1 obtains lock1 and thread 2 obtains lock2 Then thread 1 continues to execute. After sleeping for 5s, it obtains and starts the second synchronous execution. The lock is lock2. However, it is likely that thread 2 has not finished executing, so it has not released lock2, so wait. Thread 2 just started to acquire lock2 lock. After sleeping for five seconds, it wants to acquire lock1 lock. At this time, lock1 lock has not been released, so it waits. The two threads are waiting for each other, causing a deadlock.
Step 1: check whether the current deadlock can be detected through the Jstack command.
jstack 51789
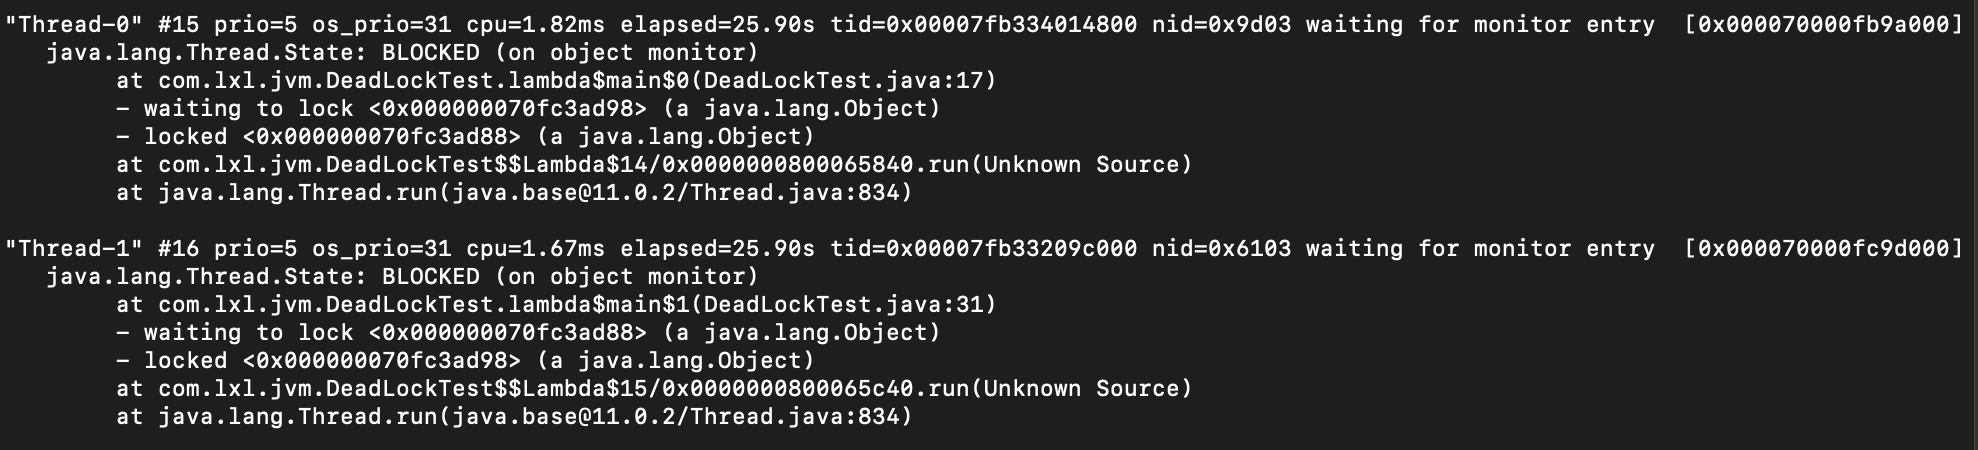
As can be seen from this exception,
- prio: priority of the current thread
- cpu: cpu time consuming
- os_prio: operating system level priority
- tid: thread id
- nid: id of the system kernel
- State: the current state, BLOCKED, indicates blocking. The normal state is Running. We can see that the state of Thread-0 and Thread-1 threads is BLOCKED
From the above information, we can judge that the status of the two threads is BLOCKED. There may be a problem, and then continue to look down.
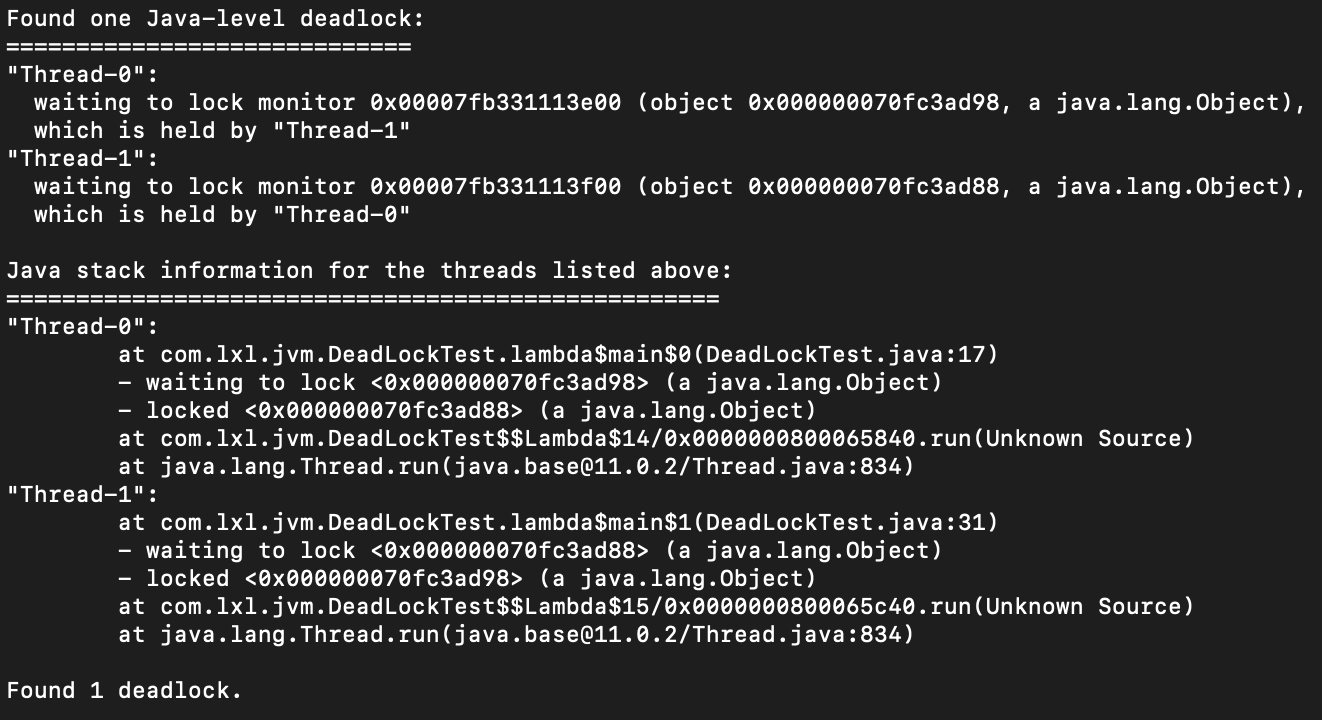
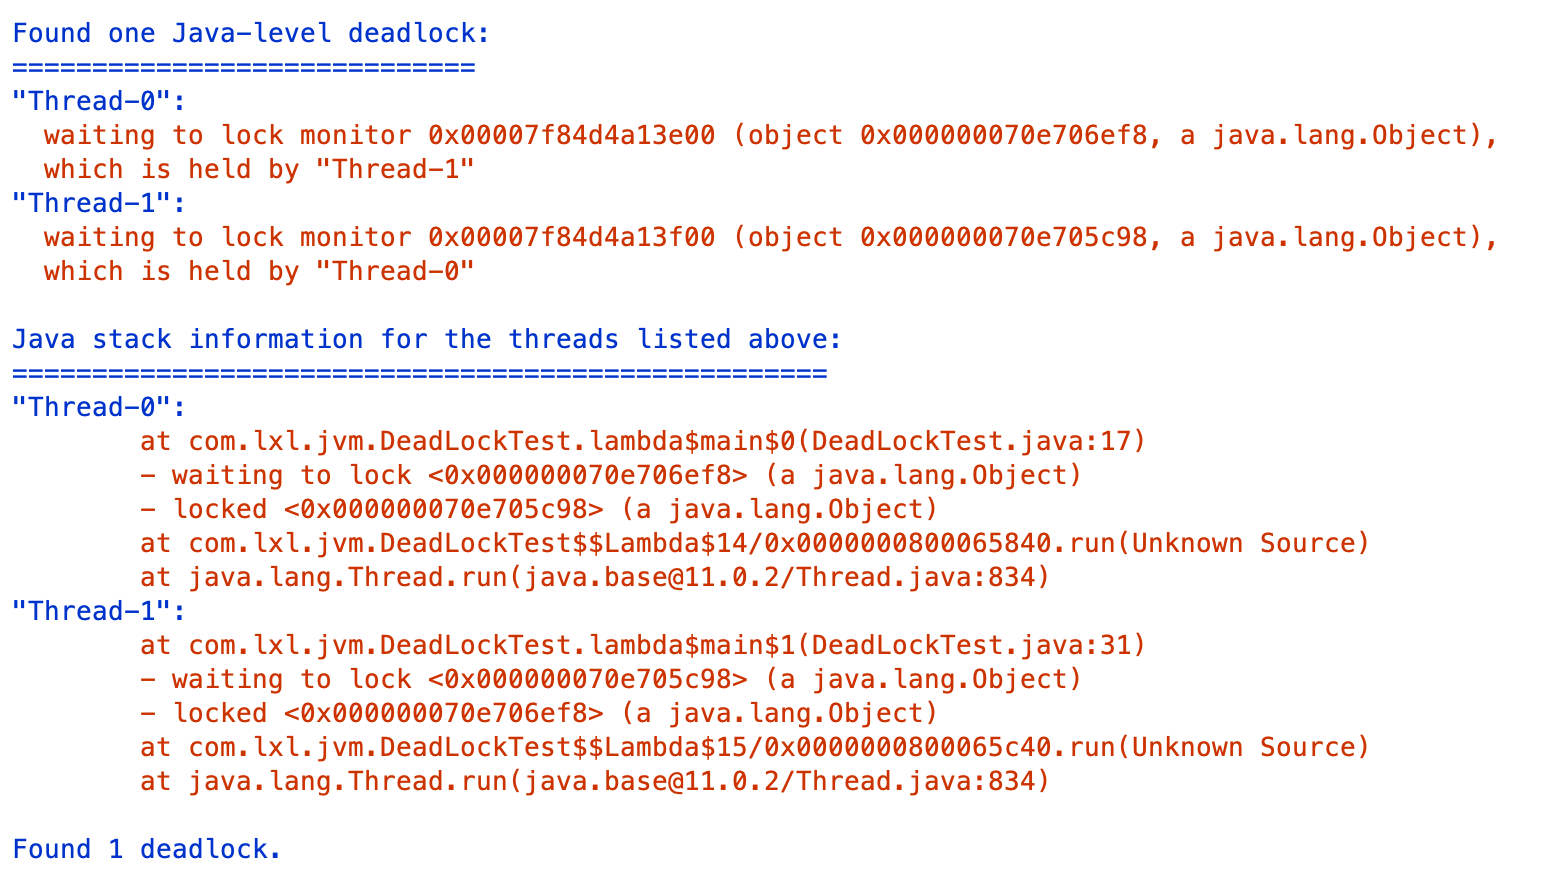
We can see this sentence from the last paragraph: found one Java level deadlock; It means finding a deadlock. The thread numbers of deadlock are Thread-0 and Thread-1.
Thread-0: waiting for lock of 0x000000070e706ef8 object, which is now held by Thread-1.
Thread-1: waiting for the lock of 0x000000070e705c98 object, which is now held by Thread-0.
At the bottom is the stack information of deadlock. Deadlocks can occur on lines 17 and 31 of DeadLockTest. Through this prompt, we can find out where the deadlock is.
Step 2: use jvisualvm to view deadlocks
If it is inconvenient to use jstack, you can also use jvisualvm to view it through the interface, which is more intuitive.
During program code startup, open the jvisualvm tool.
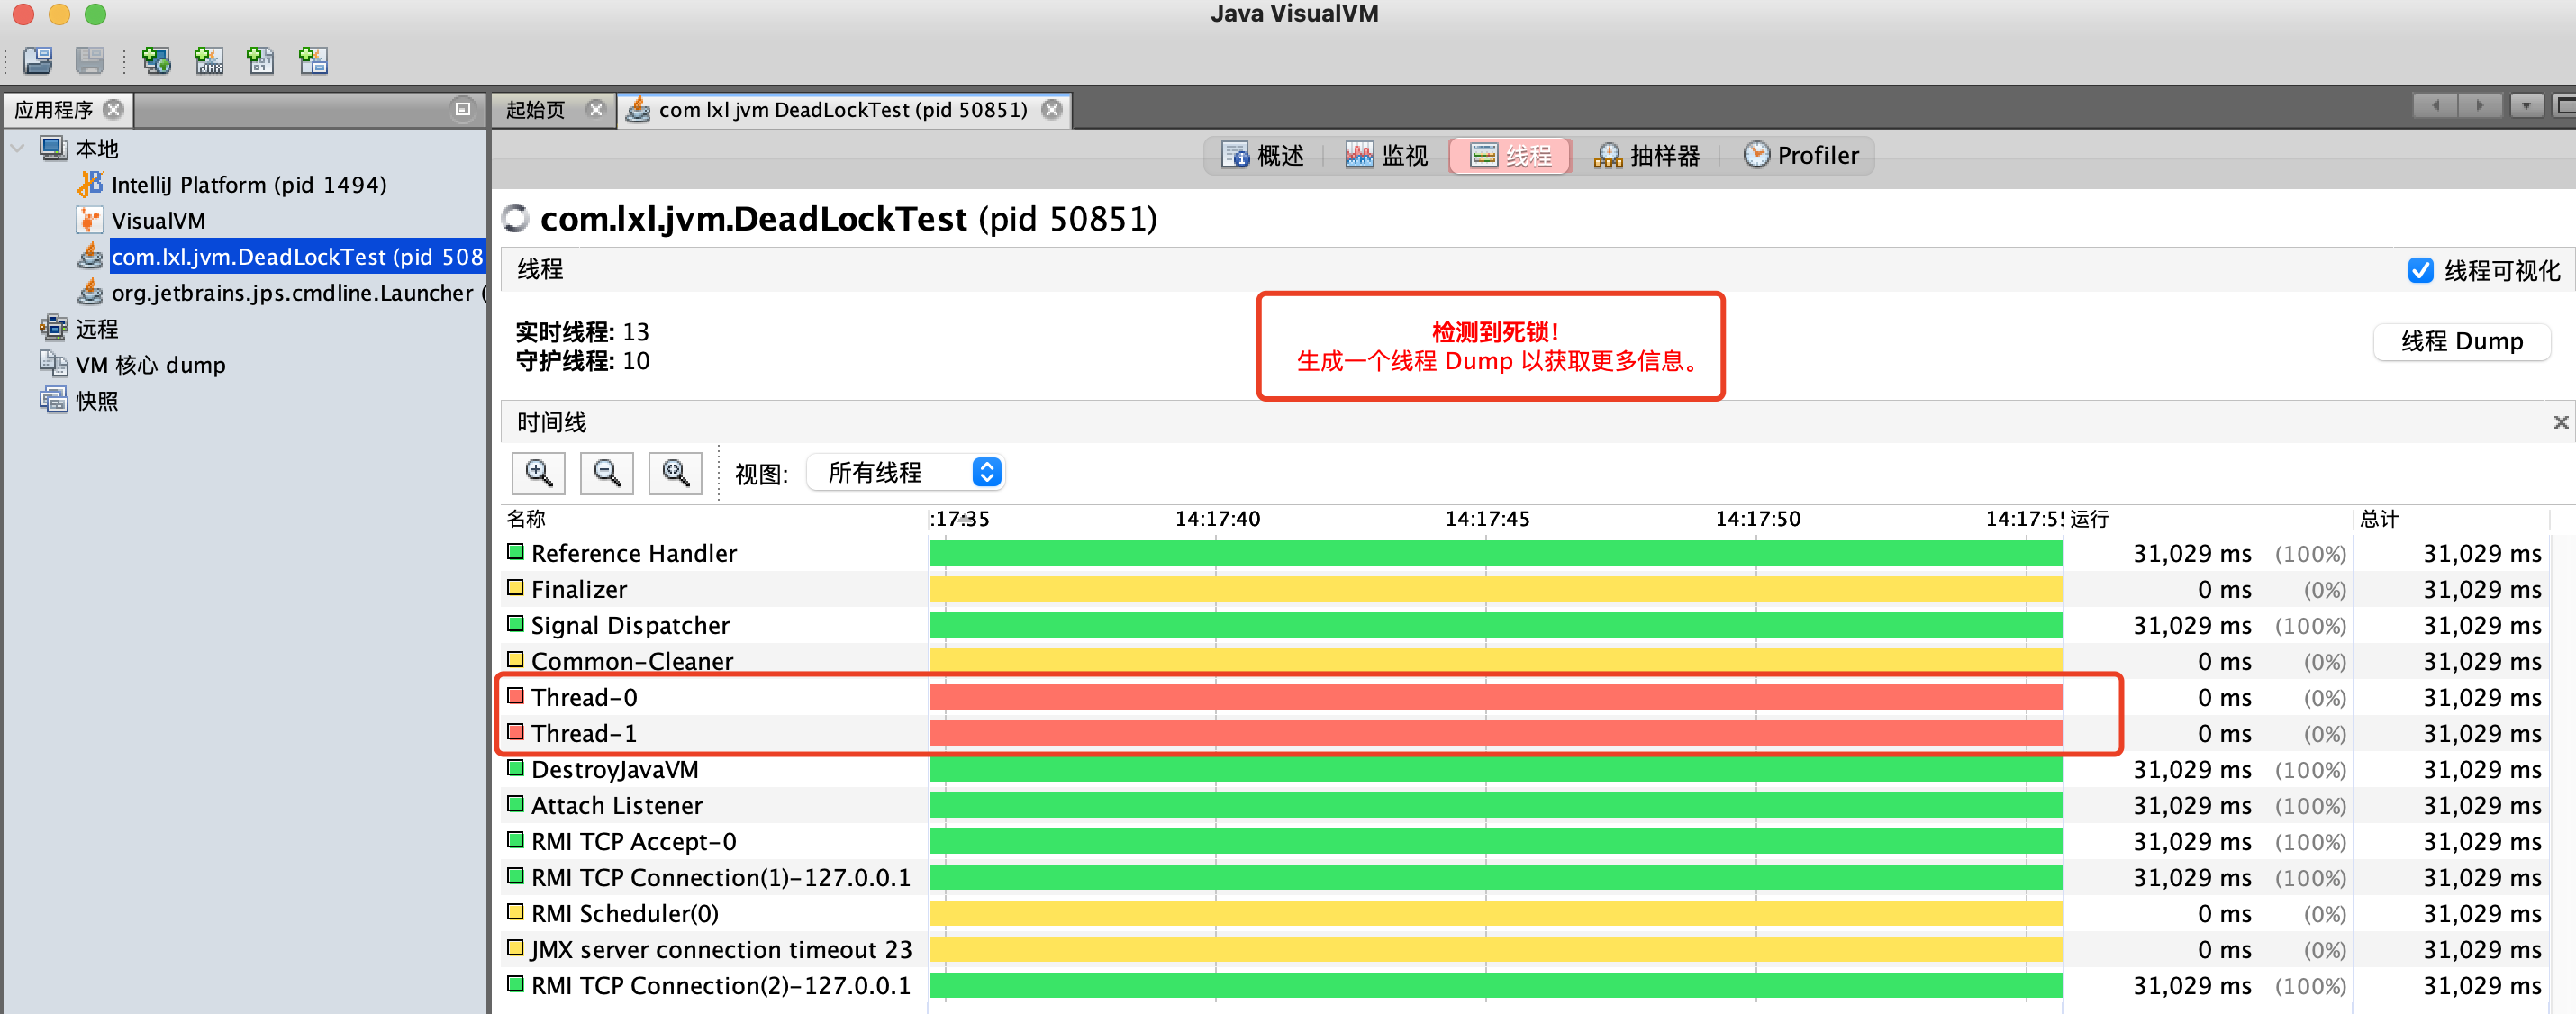
Find the currently running class, check the thread, and you will see a row of red letters at the top: deadlock detected. Then click the "thread Dump" button to view the trusted thread deadlock information.
Here you can find the details of the thread private lock. The specific content is the same as the query result using the Jstack command above. The utility here is more convenient.
4. JVM parameter tuning
jvm tuning usually uses the Jstat command.
1. Garbage collection statistics jstat -gc
jstat -gc process id
This command is very commonly used. When there is a problem online, you can use this command to analyze the problem.
Let's test it. Start a project, and then enter the jstat -gc process id at the terminal. The results are as follows:

What do the above parameters mean? First identify the meaning of parameters, and then analyze them according to parameters
- S0C: capacity of the first Survivor area
- S1C: capacity of the second Survivor area
- S0U: used capacity of the first Survivor area
- S1U: used capacity of the second Survivor area
- EC: capacity of Cenozoic Eden area
- EU: capacity used in Cenozoic Eden District
- OC: elderly generation capacity
- OU: capacity used in old age
- MC: method area size (meta space)
- MU: the size of the method area that has been used
- CCSC: space occupied by compressed pointer
- CCU: compress the space already used by the pointer
- YGC: the number of times younggc has occurred
- YGCT: this time, YoungGC takes a long time
- FGC: number of full GC occurrences
- FGCT: Full GC time consuming
- GCT: total GC time, equal to YGCT+FGCT
Command to continuously observe GC changes
jstat -gc process ID Interval printing times
For example: I want to print gc information 10 times with an interval of 1 second
jstat -gc process ID 1000 10
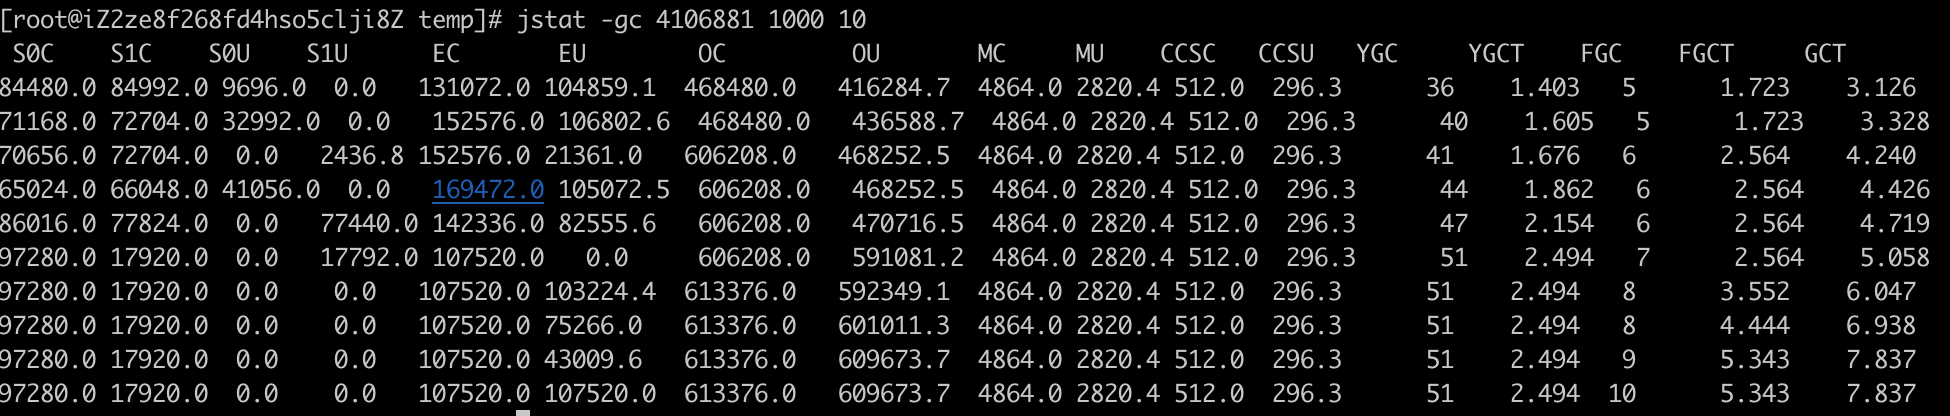
In this way, 10 gc changes are printed continuously, one second at a time.
This command is the statistics of the overall garbage collection. The following will be differential processing.
2. Heap memory statistics
This command prints the heap memory usage.
jstat -gccapacity process ID

- NGCMN: Cenozoic minimum capacity
- NGCMX: Cenozoic maximum capacity
- NGC: current Cenozoic capacity
- S0C: size of the first Survivor area
- S1C: size of the second Survivor area
- EC: size of Eden area
- OGCMN: minimum capacity in old age
- OGCMX: maximum capacity in old age
- OGC: current generation size
- OC: current generation size
- MCMN: minimum metadata capacity
- MCMX: maximum metadata capacity
- MC: current metadata space size
- CCSMN: minimum compressed class space size
- CCSMX: maximum compressed class space size
- CCSC: current compressed class space size
- YGC: number of young generation gc
- FGC: GC frequency of elderly generation
3. Statistics of new generation garbage collection
Command:
jstat -gcnew process ID [ Interval printing times]
This refers to the memory of the current GC

- S0C: size of the first Survivor
- S1C: size of the second Survivor
- S0U: used size of the first Survivor
- S1U: second Survivor used size
- TT: the number of times the object survived in the Cenozoic
- MTT: the maximum number of times an object survives in the Cenozoic
- DSS: expected Survivor size
- EC: size of Eden zone
- EU: used size of Eden area
- YGC: garbage collection times of the younger generation
- YGCT: waste collection time of young generation
4. New generation memory statistics
jstat -gcnewcapacity process ID

Parameter meaning:
- NGCMN: Cenozoic minimum capacity
- NGCMX: Cenozoic maximum capacity
- NGC: current Cenozoic capacity
- S0CMX: maximum size of survivor zone 1
- S0C: current Survivor 1 area size
- S1CMX: maximum size of survivor zone 2
- S1C: current Survivor 2 area size
- ECMX: maximum Eden area size
- EC: current Eden area size
- YGC: garbage collection times of the younger generation
- FGC: recycling times of the elderly generation
5. Garbage collection statistics in old age
Command:
jstat -gcold process ID

Parameter meaning:
- MC: method area size
- MU: used size of method area
- CCSC: compressed pointer class space size
- CCU: compressed class space used size
- OC: old age size
- OU: used size of older generation
- YGC: garbage collection times of the younger generation
- FGC: garbage collection times in old age
- FGCT: waste collection time in old age
- GCT: total waste collection time, new generation + old age
6. Old memory statistics
Command:
jstat -gcoldcapacity process ID

Parameter meaning:
- OGCMN: minimum capacity in old age
- OGCMX: maximum capacity in old age
- OGC: current generation size
- OC: old age size
- YGC: garbage collection times of the younger generation
- FGC: garbage collection times in old age
- FGCT: waste collection time in old age
- GCT: total time consumed by garbage collection
7. Metadata and spatial statistics
command
jstat -gcmetacapacity process ID

- MCMN: minimum metadata capacity
- MCMX: maximum metadata capacity
- MC: current metadata space size
- CCSMN: minimum pointer compression class space size
- CCSMX: maximum pointer compression class space size
- CCSC: current pointer compression class space size
- YGC: garbage collection times of the younger generation
- FGC: garbage collection times in old age
- FGCT: waste collection time in old age
- GCT: total time consumed by garbage collection
8. Overall operation
Command:
jstat -gcutil process ID

- S0: current usage ratio of survivor zone 1
- S1: current usage ratio of survivor zone 2
- E: Utilization ratio of Eden District
- O: Use proportion in old age
- M: Usage ratio of metadata area
- CCS: pointer compression usage ratio
- YGC: garbage collection times of the younger generation
- YGCT: waste collection time of young generation
- FGC: garbage collection times in old age
- FGCT: waste collection time in old age
- GCT: total time consumed by garbage collection
Analyze the entire heap space by querying the above parameters.
2, Use of Arthas online analysis tool
The function of Arthas is very powerful. The official documents are attached: https://arthas.aliyun.com/doc/
In fact, if you want to know about Arthas, just look at the official documents. The functions are full and detailed. Then why tidy it up? Here we are sorting out some common functions and functions that can help us a lot in case of emergency.
Arthas is divided into several parts. Let's take a look at our research ideas first
1. Installation and startup - this is a simple view. For programmers, so easy
2.dashboard dashboard function - jstat command similar to JDK,
3. The thread command queries the information similar to the jmap command
4. Decompile online code - this function is very good. After the version is changed and distributed, it doesn't take effect. Decompile and have a look.
5. Query the return value of a function
6. Query the jvm information and modify it -- in case of memory overflow, you can manually set the print heap log to the file
7.profiler flame diagram
Let's take a look at the usage of common functions of Arthas
1. Installation and startup of Arthas
In fact, when it comes to this fast, I have to mention that before, I had to start and operate the interface because Arthas is a software. At that time, I thought that if this was the case, the company would not agree to install a separate application online ~ ~ ~. After studying, I found that Arthas was a jar package. Just use Java jar to run.
1. Installation
You can download it directly on Linux through the command:
wget https://alibaba.github.io/arthas/arthas-boot.jar
It can also be accessed directly in the browser https://alibaba.github.io/arthas/arthas-boot.jar , wait for the download to succeed and upload it to the Linux server.
2. Start
Execute the command to start
java -jar arthas-boot.jar
After successful startup, you can see the following interface:
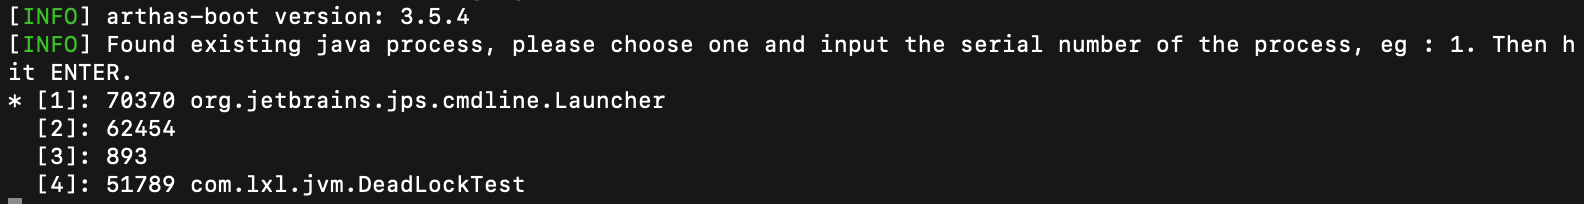
Then find the process you want to monitor, enter the corresponding number in front, and you can start the monitoring mode. For example, I want to see 4
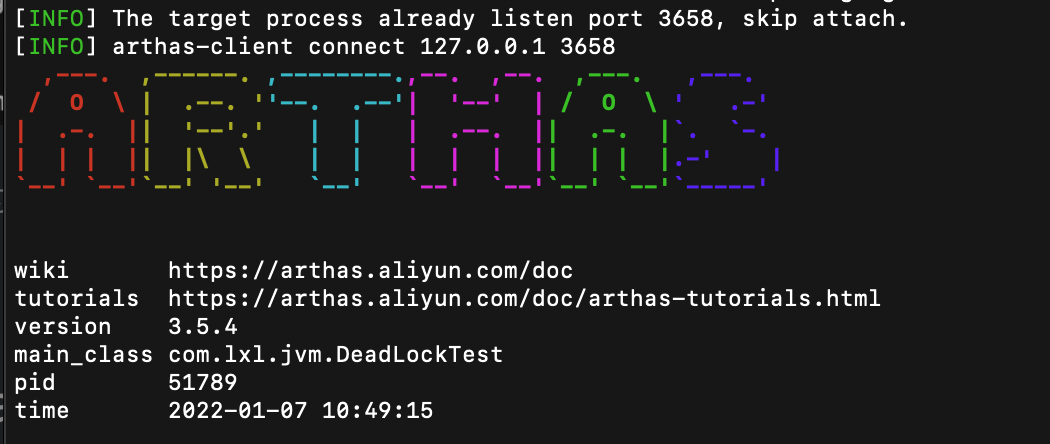
Seeing this indicates that the application monitoring is successful
2. dashboard -- query the overall project operation
Execute command
dashboard
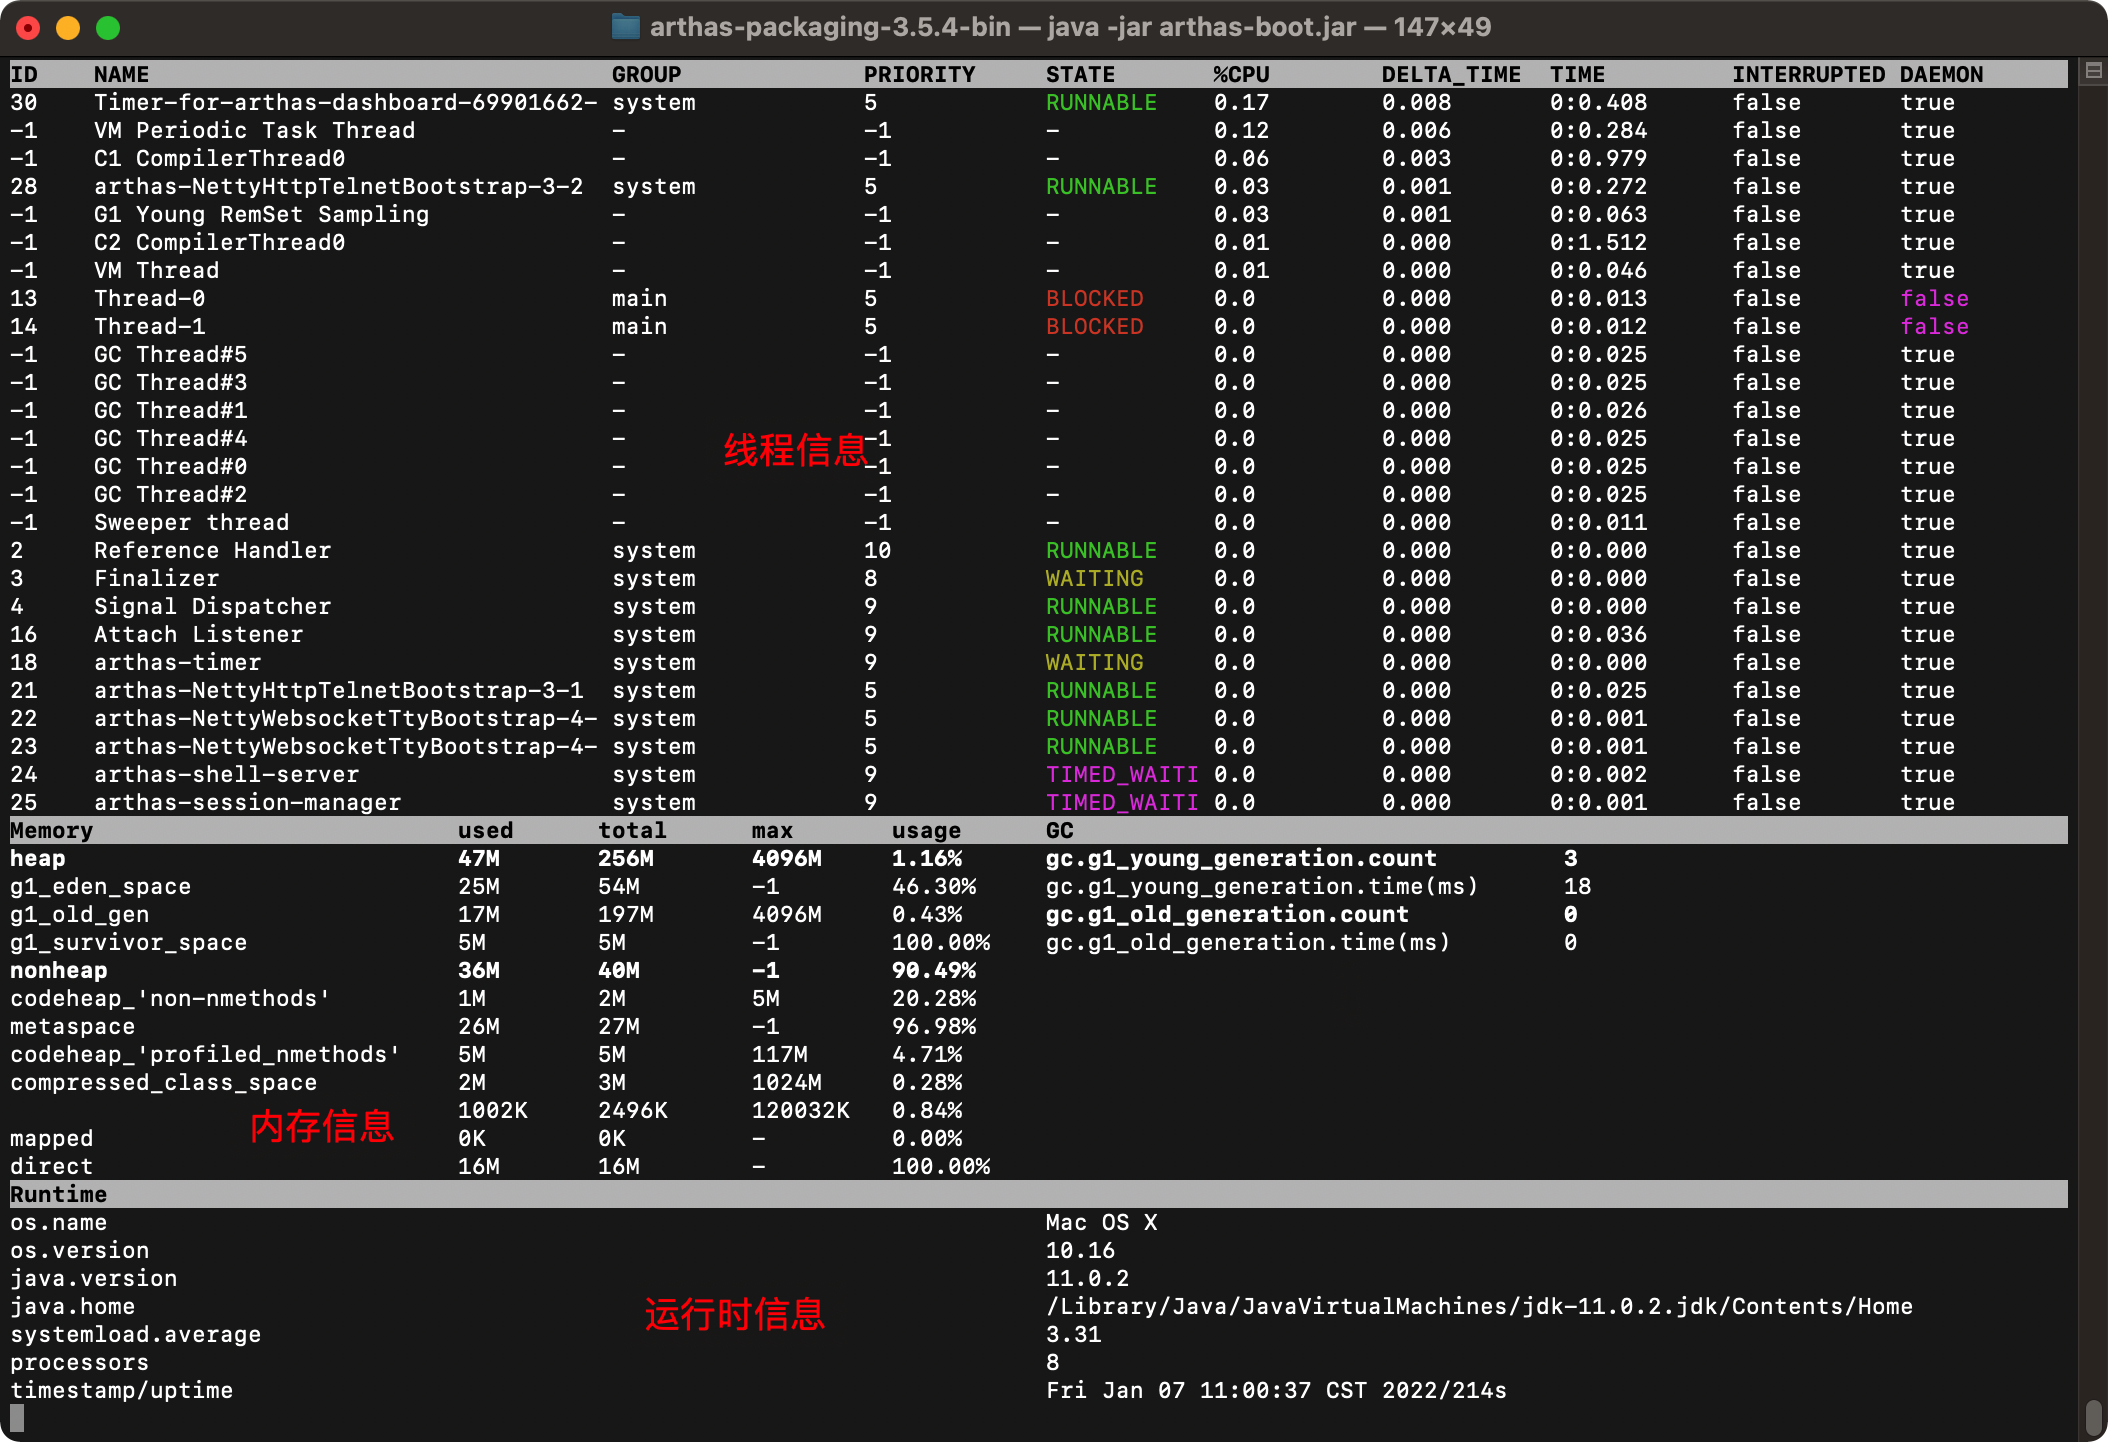
There are three pieces in it
1. Thread information
We can see all thread information under the current process. Threads 13 and 14 are currently BLOCKED, and the blocking time can also be seen. Through this, it is clear that there are two threads with problems, and there are six GC threads in blocking state.
2. Memory information
Memory information includes three parts: heap space information, non heap space information and GC garbage collection information
Heap space information
- g1_eden_space: Eden area space usage
- g1_ survivor_ Space: space usage of survivor area
- g1_ old_ Gen: space usage of old generation
Non heap space information
- codeheap_' Non nmethods': non method code heap size
- metaspace: metadata space usage
- codeheap_'profiled_nmethods':
- compressed_class_space: compressed class space usage
GC garbage collection information
- gc.g1_young_generation.count: number of Cenozoic GC
- gc.g1_young_generation.time(ms) the time-consuming of the Cenozoic GC
- gc.g1_old_generation.count: the number of GC in the elderly generation
- gc.g1_old_generation.time(ms): the time consumption of GC in the elderly generation
3. Runtime information
- os.name: current operating system Mac OS X
- os.version: the version number of the operating system is 10.16
- java.version: Java version number 11.0.2
- java.home: Java root directory / library / Java / javavirtualmachines / jdk-11.0.2 jdk/Contents/Home
- systemload.average: the average cpu load of the system is 4.43
Meaning of load average value
> Single core processor
Assuming that our system is single CPU and single core, we compare it to a one-way road and compare CPU tasks to cars. When there are few cars, load < 1; When the car occupies the whole road, load=1; When the road is full of stations and cars are piled outside the road, load > 1

Load < 1

Load = 1

Load >1
> multi core processor
We often find that the server load > 1, but it still works well because the server is a Multi-core processor.
Assuming that our server CPU is 2 cores, it will mean that we have 2 roads. When our Load = 2, all roads are full of vehicles.

When Load = 2, the roads are full
- Processors: number of processors 8
- timestamp/uptime: collected timestamp Fri Jan 07 11:36:12 CST 2022/2349s
Through the dashboard, we can understand the running health of the current thread as a whole
3. The thread command queries the threads with the highest CPU utilization and the cause of the problem
Through the dashboard, we can see all the threads running under the current process. If you want to check the running status of a thread, you can use the thread command
1. Count the n threads with the highest cpu utilization
Let's take a look at the common parameters.
Parameter description
| Parameter name | Parameter description |
| id | Thread id |
| [n:] | Specify the first N busiest threads and print the stack |
| [b] | Find the thread that is currently blocking another thread |
| [i <value>] | Specifies the sampling interval for cpu usage statistics, in milliseconds. The default value is 200 |
| [--all] | Show all matching threads |
Our goal is to find the n threads with the highest CPU utilization. Then you need to know how to calculate the CPU utilization before you can find the highest. The calculation rules are as follows:
First, sample for the first time to obtain the data of all threads CPU time(Called is java.lang.management.ThreadMXBean#getThreadCpuTime() and sun management. HotspotThreadMBean. Getinternalthreadcputimes() interface)

Then, sleep and wait for an interval (the default is 200) ms,Can pass-i (specify interval)

Sample again and for the second time to obtain the data of all threads CPU Time, compare the two sampling data, and calculate the increment of each thread CPU time
  thread  CPU Utilization rate = Thread increment CPU time / Sampling interval * 100%


Note: this statistic will also incur some overhead( JDK The interface itself is expensive), so you will see as Threads occupy a certain percentage. In order to reduce the impact of statistics overhead, you can lengthen the sampling interval, such as 5000 milliseconds.
Count the n threads with the highest cpu utilization in 1 second:
thread -n 3 -i 1000
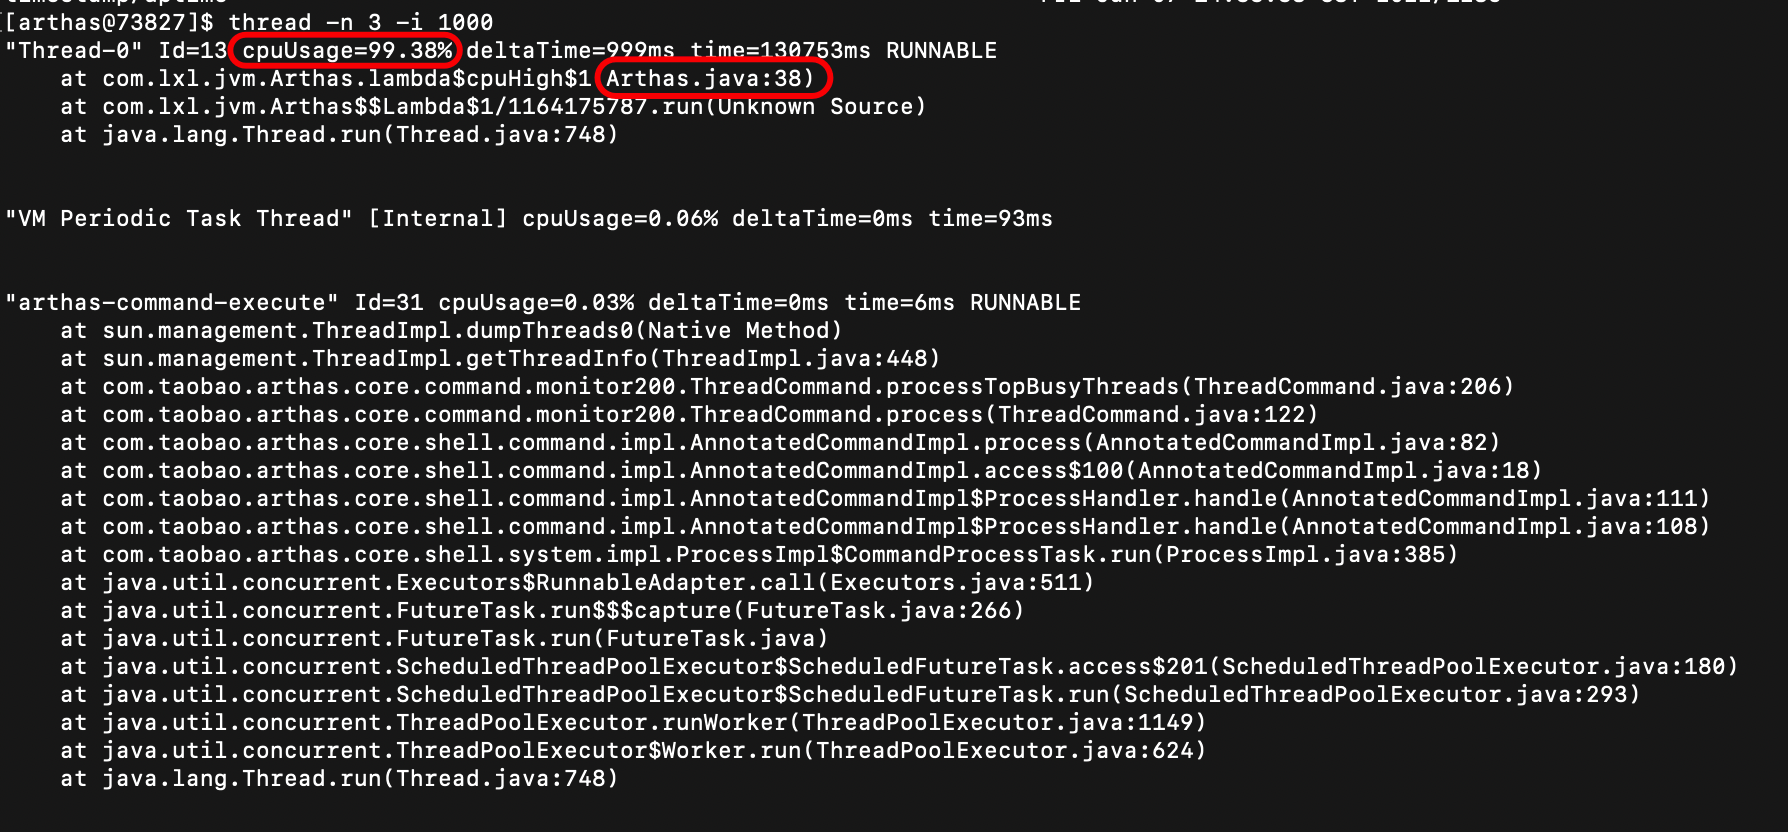
From the details of threads, it can be seen that the utilization rate of the first thread is the highest, and the cpu occupation reaches 99.38%. The second line tells us it's Arthas This is caused by line 38 of the Java class.
From this, we can see the problem at a glance, then locate the problem code, and then manually troubleshoot the problem.
2. Query the currently blocked threads
Command:
thread -b
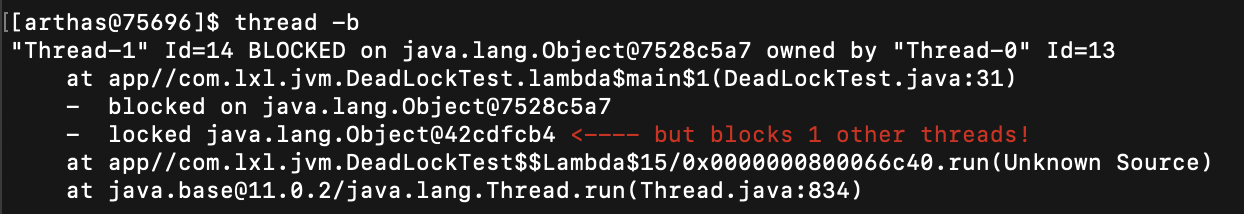
You can see the content prompt that Thread-1 is blocked by Thread-0. The corresponding number of lines of code is deadlocktest Line 31 of the Java class. Follow this prompt to find code problems.
3. Specify the sampling interval
command
thread -i 1000
The meaning of this is a 1s statistical sampling
4. Decompile online code - this function is very good. After the version is changed and distributed, it doesn't take effect. Decompile and have a look.
When it comes to Arthas, one function that must be mentioned is the function of online decompilation code. A common situation is that there is a problem online. After locating the problem, change the code immediately, but it is found that it does not take effect after publishing. It is impossible ~ ~ ~ it has just been submitted successfully. So the new version can only rely on luck. I don't know why it didn't take effect.
Decompilating online code can let us know at a glance whether the code driving part is effective. Decompile the code using Arthas's jad command
jad Command will JVM Actual operation in class of byte code Decompile into java code
Usage:
jad com.lxl.jvm.DeadLockTest
Operation results:
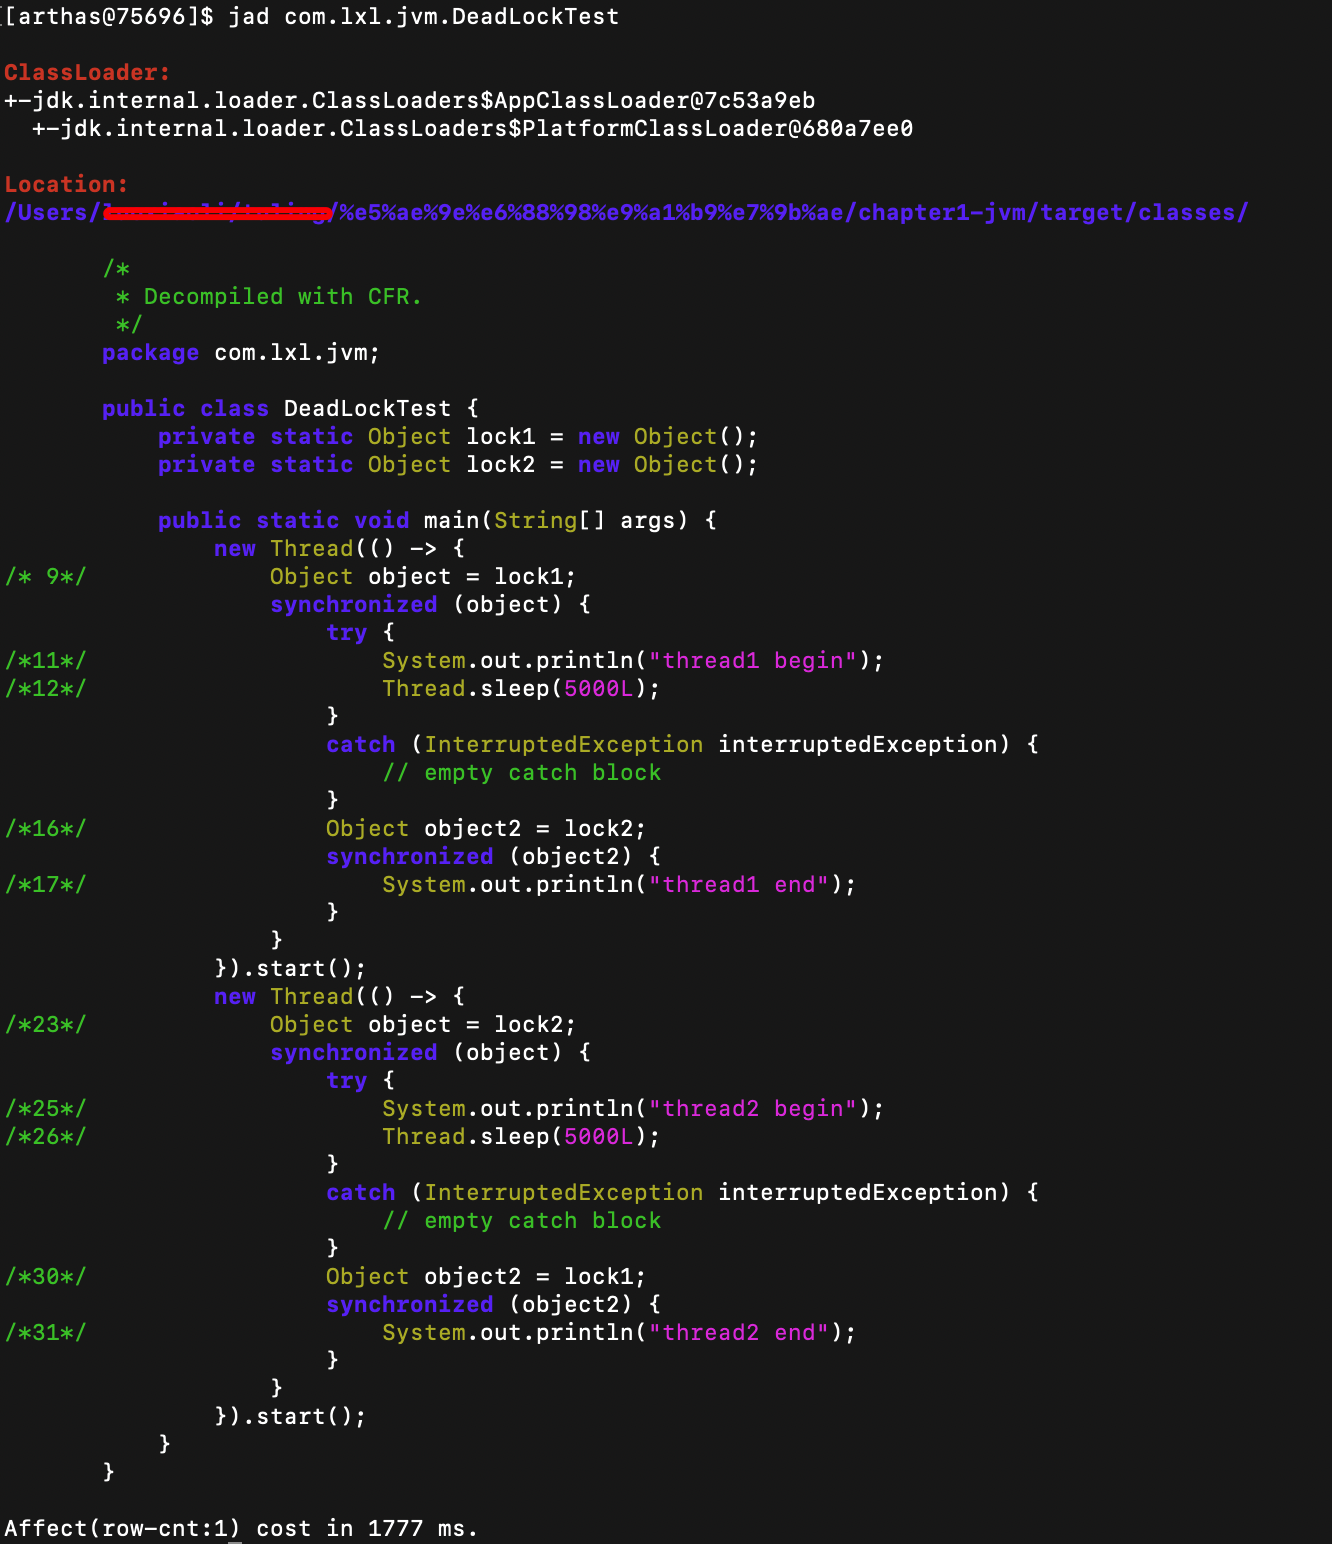
Operation result analysis: there are three parts
- ClassLoader: class loader is the class loader that loads the current class
- Location: the location where the class is saved locally
- Source code: class decompiled bytecode source code
If you don't think about class loading information and local location, just want to view class source code information, you can add the -- source only parameter
jad --source-only Class full name
6. ognl dynamically execute online code
Isn't it amazing to be able to call online code. If you feel that there is a problem with the execution of a piece of code, but there is no log, you can use this method to dynamically call the target method.
The following cases are executed based on this code, User class:
public class User {
    private int id;
    private String name;


    public User() {
    }

    public User(int id, String name) {
        this.id = id;
        this.name = name;
    }

    public int getId() {
        return id;
    }

    public void setId(int id) {
        this.id = id;
    }

    public String getName() {
        return name;
    }

    public void setName(String name) {
        this.name = name;
    }
}
DeadLockTest class:
public class DeadLockTest {
    private static Object lock1 = new Object();
    private static Object lock2 = new Object();
    private static List<String> names = new ArrayList<>();
    private List<String> citys = new ArrayList<>();


    public static String add() {
        names.add("zhangsan");
        names.add("lisi");
        names.add("wangwu");
        names.add("zhaoliu");

        return "123456";
    }
    public List<String> getCitys() {
        DeadLockTest deadLockTest = new DeadLockTest();
        deadLockTest.citys.add("Beijing");

        return deadLockTest.citys;
    }


    public static List<User> addUsers(Integer id, String name) {
        List<User> users = new ArrayList<>();
        User user = new User(id, name);
        users.add(user);
        return users;
    }


    public static void main(String[] args) {


        new Thread(() -> {
            synchronized (lock1) {
                try {
                    System.out.println("thread1 begin");
                    Thread.sleep(5000);
                } catch (InterruptedException e) {

                }
                synchronized (lock2) {
                    System.out.println("thread1 end");
                }
            }
        }).start();

        new Thread(() -> {
            synchronized (lock2) {
                try {
                    System.out.println("thread2 begin");
                    Thread.sleep(5000);
                } catch (InterruptedException e) {

                }
                synchronized (lock1) {
                    System.out.println("thread2 end");
                }
            }
        }).start();
    }
}
1) Get static function
>The return value is a string
ognl '@Full path class name@Static method name("parameter")'
Example 1: there is an add static method in the DeadLockTest class. Let's see how to execute this static method through ognl. Execute command
ognl '@com.lxl.jvm.DeadLockTest@add()'

Among them, the first@Followed by the full name of the class; the second@This is followed by the property or method name. If the property is an object and you want to obtain the property or method in the property, you can directly type.Attribute name/Just the method name.
Operation effect:

We see that the return value of this object is 123456
>The return value is an object
ognl '@Full path class name@Static method name("parameter")' -x 2
Here we can try to replace - x 2 with - x 1- x 3;
*Case 1: return the address of the object. No - X or - x 1
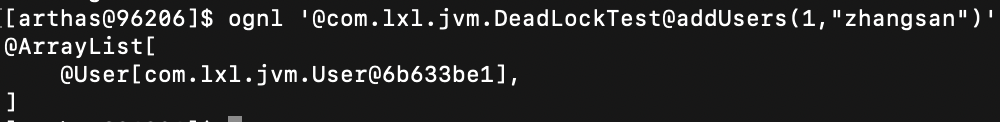
ognl '@com.lxl.jvm.DeadLockTest@addUsers(1,"zhangsan")'
or
ognl '@com.lxl.jvm.DeadLockTest@addUsers(1,"zhangsan")' -x 1
Return value
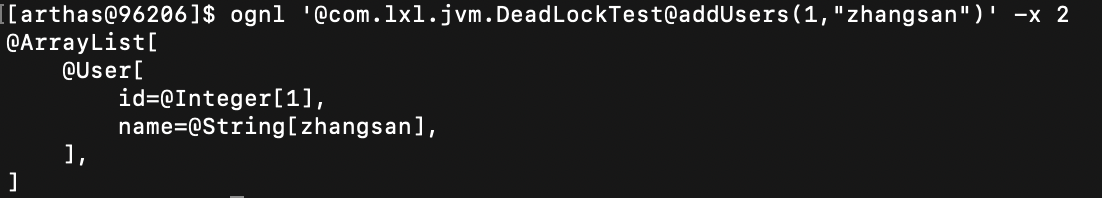
*Case 2: return the value of the specific parameter in the object. Plus - x 2
ognl '@com.lxl.jvm.DeadLockTest@addUsers(1,"zhangsan")' -x 2
Return value
*Case 3: there are other objects in the returned object
- Command:
ognl '@com.lxl.jvm.DeadLockTest@addUsers(1,"zhangsan")' -x 2
Execution results:
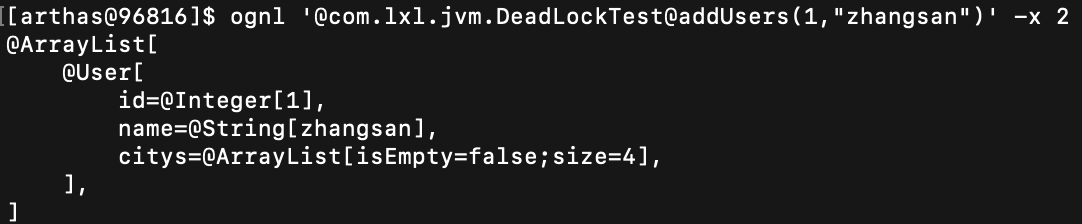
-x 2 gets the value of the object. List returns array information and array length.
- Command:
ognl '@com.lxl.jvm.DeadLockTest@addUsers(1,"zhangsan")' -x 3
Execution results:
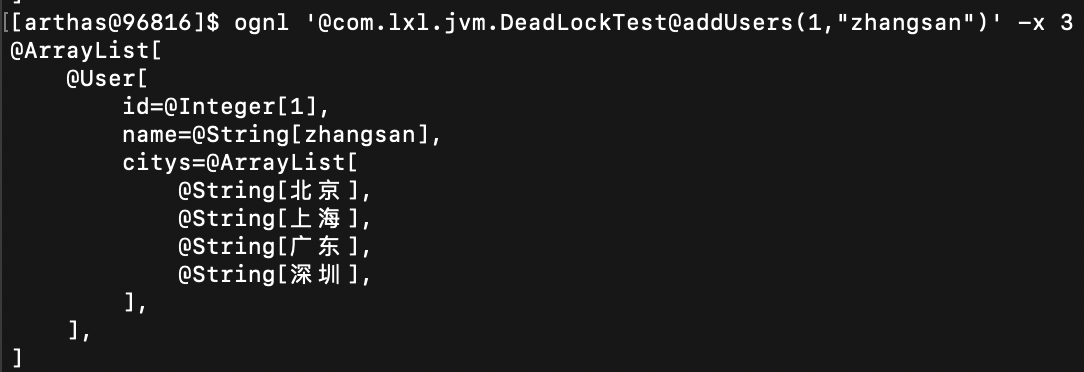
-x 3 print out the value of the object, the value in the List in the object.
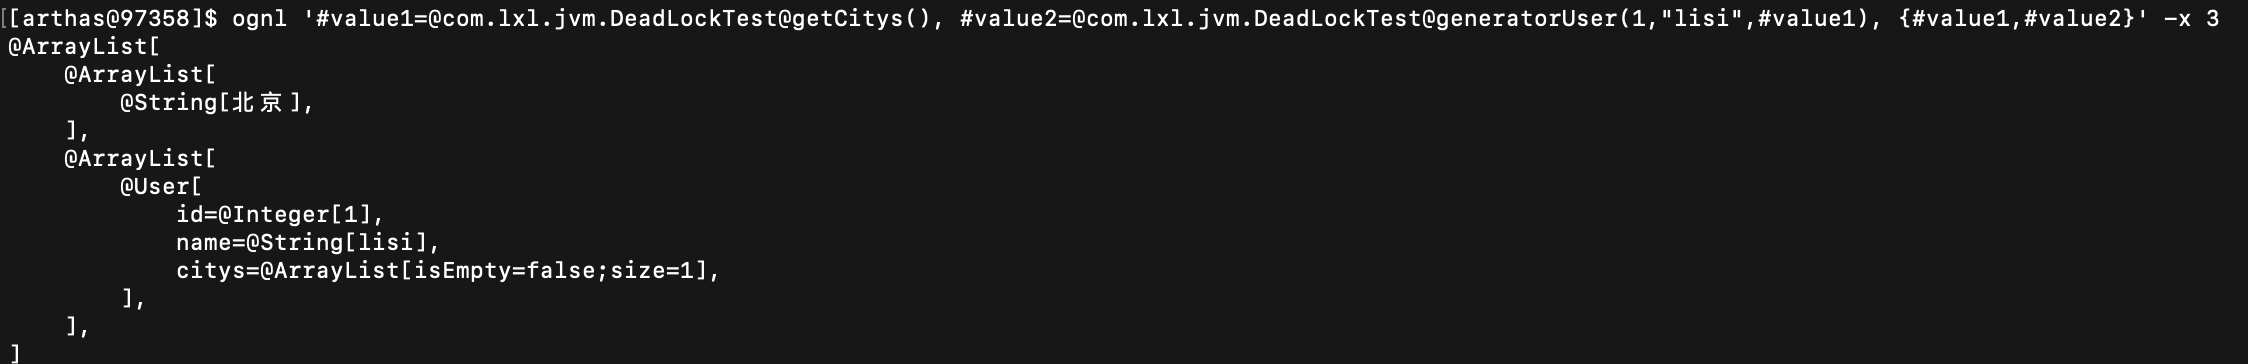
*Case 4: the return value of method A is used as the input parameter of method B
ognl '#value1=@com.lxl.jvm.DeadLockTest@getCitys(), #value2=@com.lxl.jvm.DeadLockTest@generatorUser(1,"lisi",#value1), {#value1,#value2}' -x 2
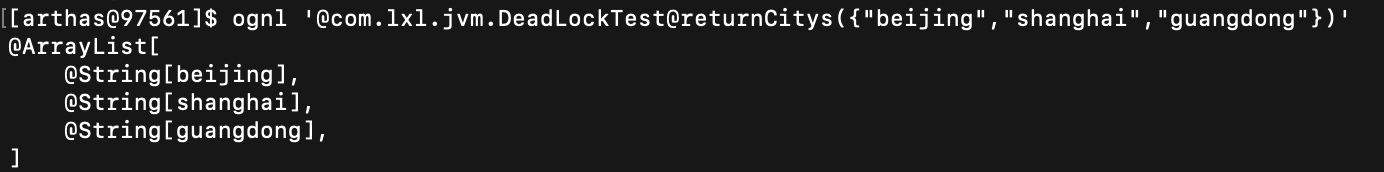
>Method arguments are lists of simple types
ognl '@com.lxl.jvm.DeadLockTest@returnCitys({"beijing","shanghai","guangdong"})'
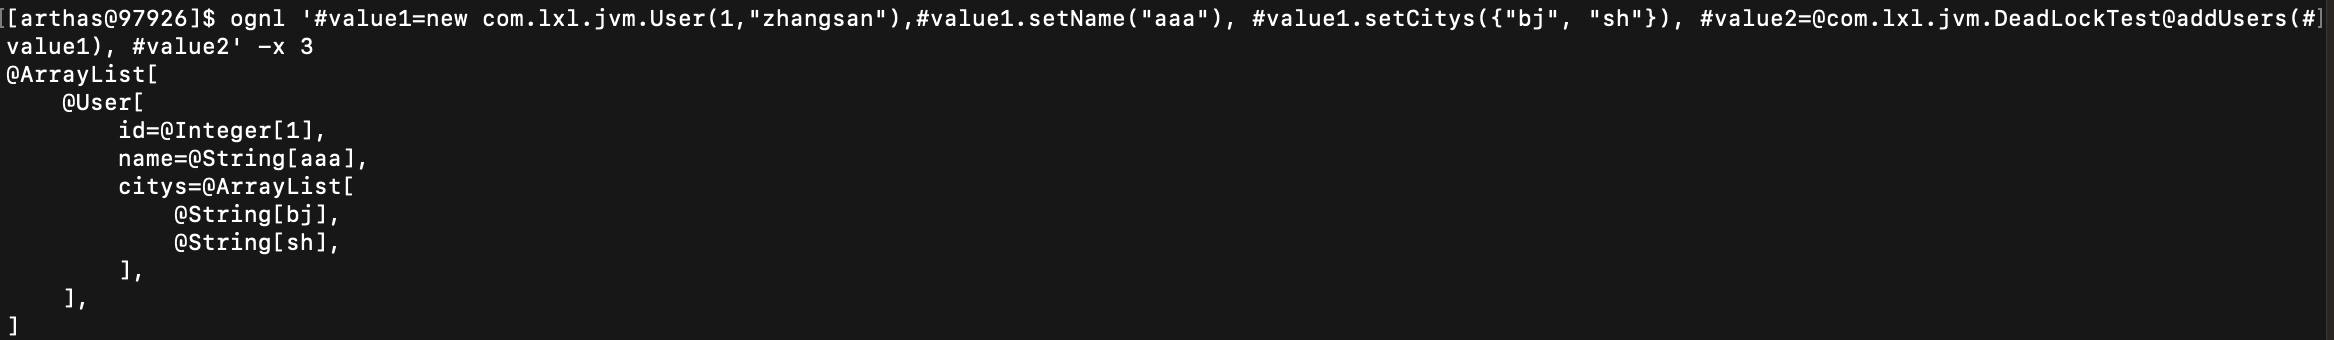
>Method input is a complex object
ognl '#value1=new com.lxl.jvm.User(1,"zhangsan"),#value1.setName("aaa"), #value1.setCitys({"bj", "sh"}), #value2=@com.lxl.jvm.DeadLockTest@addUsers(#value1), #value2' -x 3
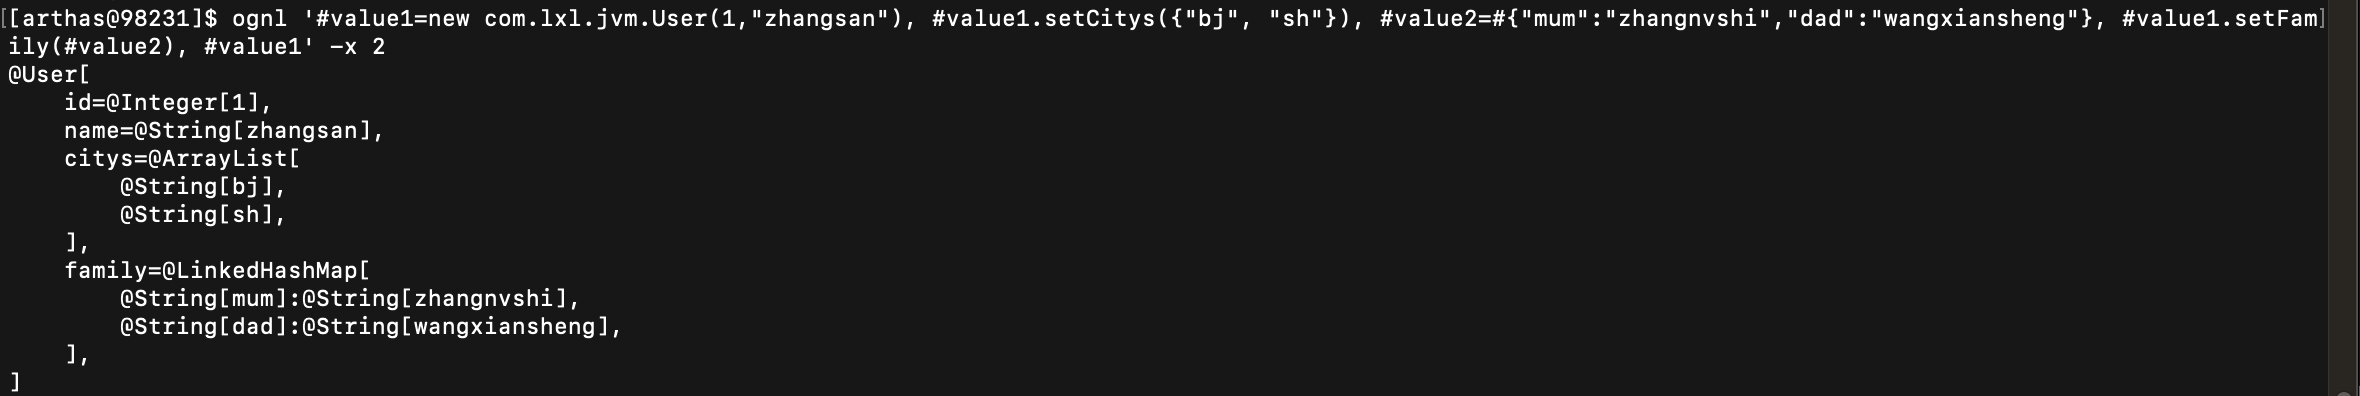
>The method input parameter is a map object
ognl '#value1=new com.lxl.jvm.User(1,"zhangsan"), #value1.setCitys({"bj", "sh"}), #value2=#{"mum":"zhangnvshi","dad":"wangxiansheng"}, #value1.setFamily(#value2), #value1' -x 2
2) Get static field
ognl '@Full path class name@Static property name'
Example: there is a names static attribute in the DeadLockTest class. Let's see how to get this static attribute. Execute command:
ognl '@com.lxl.jvm.DeadLockTest@names'

Among them, the first@Followed by the full name of the class; the second@This is followed by the property or method name. If the property is an object and you want to obtain the property or method in the property, you can directly type.Attribute name/Just the method name.
Operation effect:
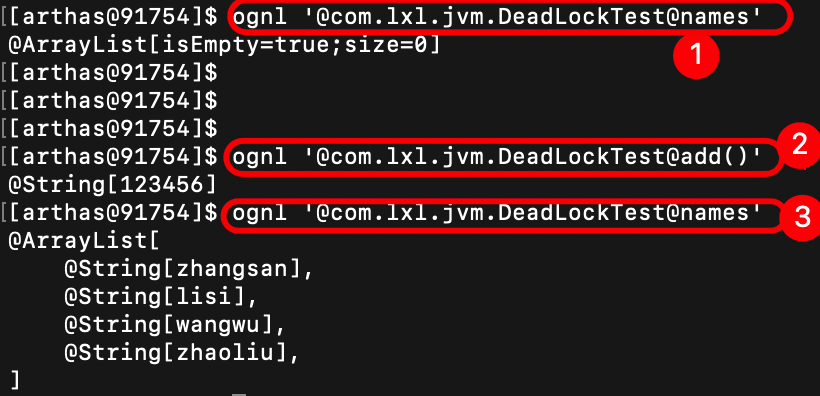
The first time you execute the get attribute command, the returned attribute is an empty set; Then execute the add method to add attributes to the names collection; The names collection is requested again, and it is found that four attributes are returned.
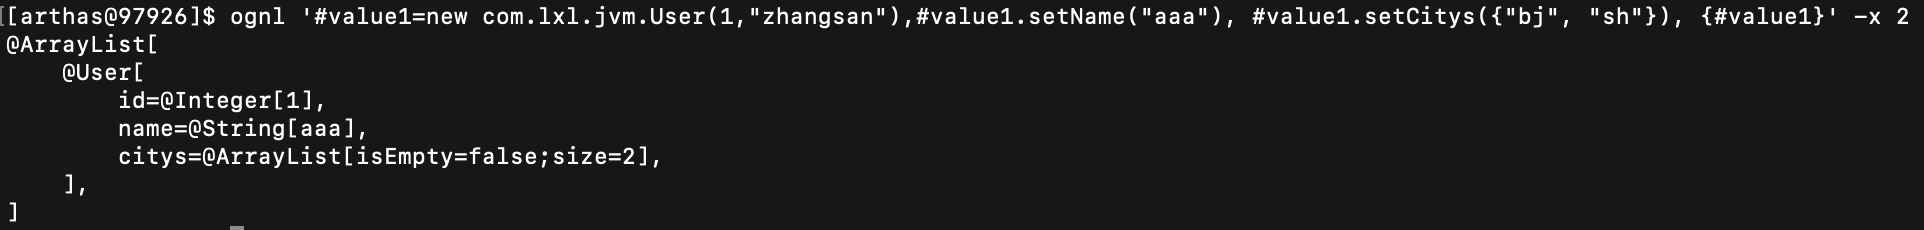
3) Get instance object
ognl '#value1=new com.lxl.jvm.User(1,"zhangsan"),#value1.setName("aaa"), #value1.setCitys({"bj", "sh"}), {#value1}' -x 2
Get the instance object, use the new keyword, and the execution result:
7. Online code modification
Sometimes the production environment will encounter very urgent problems or suddenly find a bug. At this time, it is inconvenient to re distribute the version, or the distribution does not take effect. You can use Arthas to temporarily modify the online code. The steps to modify through Arthas are as follows:
1. Read from.class file
2. Compile into.java file
3. modify.java file
4. The modified.java Compile the file into a new.class file
5. New.class Document adoption classloader Load in JVM within
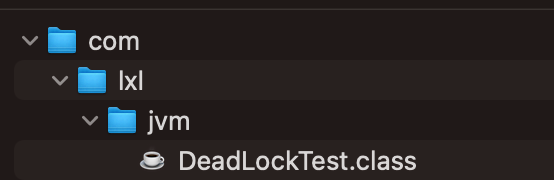
Step 1: read class file
sc -d *DeadLockTest*
Use the SC command to view the class information loaded by the JVM. For the SC command, see the official documentation: https://arthas.aliyun.com/doc/sc.html
- -d: Represents the details of the print class
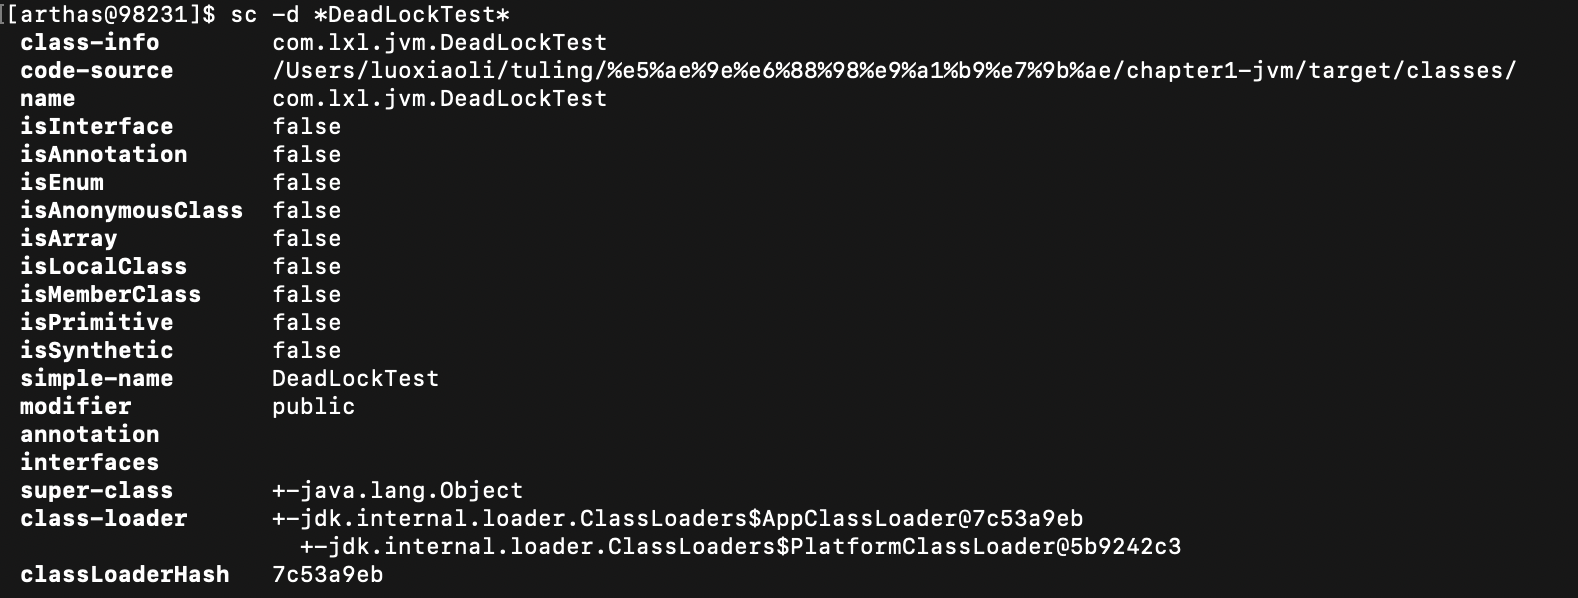
The last parameter, classLoaderHash, represents the hash value loaded by the class in the jvm, which is what we want to get.
Step 2: use the jad command to The class file is decompiled into java files
jad -c 7c53a9eb --source-only com.lxl.jvm.DeadLockTest > /Users/lxl/Downloads/DeadLockTest.java
- The jad command decompiles the source code of the specified loaded class
- -c: The hashcode of the ClassLoader to which the class belongs
- --Source only: by default, the decompilation result will contain ClassLoader information. Only the source code can be printed through the -- source only option.
- com.lxl.jvm.DeadLockTest: the full path of the target class
- /Users/lxl/Downloads/DeadLockTest.java: save path of decompiled file
       /*
        * Decompiled with CFR.
        *
        * Could not load the following classes:
        *  com.lxl.jvm.User
        */
       package com.lxl.jvm;

       import com.lxl.jvm.User;
       import java.util.ArrayList;
       import java.util.List;

       public class DeadLockTest {
           private static Object lock1 = new Object();
           private static Object lock2 = new Object();
           private static List<String> names = new ArrayList<String>();
           private List<String> citys = new ArrayList<String>();

           public static List<String> getCitys() {
               DeadLockTest deadLockTest = new DeadLockTest();
/*25*/         deadLockTest.citys.add("Beijing");
/*27*/         return deadLockTest.citys;
           }

          ......

           public static void main(String[] args) {
              ......
           }
       }
Part of the code is intercepted here.
Step 3: modify the java file
					public static List<String> getCitys() {
               System.out.println("-----A sentence of log printing is added here-----");
               DeadLockTest deadLockTest = new DeadLockTest();
/*25*/         deadLockTest.citys.add("Beijing");
/*27*/         return deadLockTest.citys;
           }
Step 4: use the mc command to set the java file compiled into class file
mc -c 512ddf17 -d /Users/luoxiaoli/Downloads /Users/luoxiaoli/Downloads/DeadLockTest.java
- MC: compile java file generation class file. Please refer to the official document for detailed usage https://arthas.aliyun.com/doc/mc.html
- -c: Specifies the hash value of the classloader
- -d: Specify output directory
- The last parameter is the java file path
This is the decompiled class bytecode file
Step 5: use the redefine command to The class file is reloaded into the JVM
redefine -c /Users/***/Downloads/com/lxl/jvm/DeadLockTest.class

Finally, you see redefine success, which means reload class file into JVM successfully.
matters needing attention
After the redefine command is used, using the jad command will reset the bytecode to its original state. Official instructions on the redefine command
Step 6: test the effect
Here, you can detect the effect, call the interface and execute the log.
8. Modify the log level of the production environment in real time
This function is also very easy to use. Usually, the log levels printed in the log are usually info, warn and error levels, and the debug log is generally invisible. When something goes wrong, some logs will be recorded in the debug log when writing code, and the log level is very high. Therefore, it is urgent to adjust the log level.
This function is very easy to use. We can set the logs that are not often printed to the debug level. Set the online log printing level to info. When there is a problem on the line, you can dynamically adjust the log level to debug. After troubleshooting, modify info. This is more effective for projects with a large number of visits and a lot of log content, and can effectively save the overhead caused by log output.
Step 1: use the logger command to view the log level
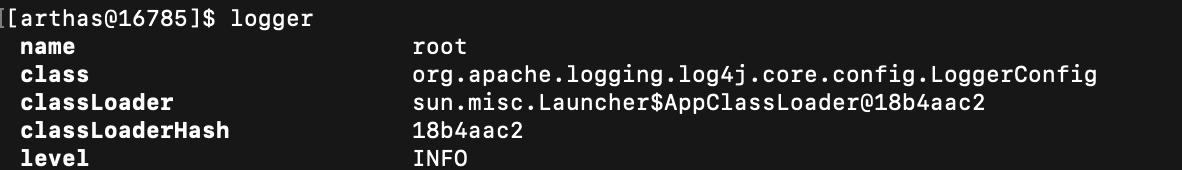
- The currently applied log level is info
- The hash value loaded by the class is 18b4aac2
We define an interface whose source code is as follows:
@PostMapping(value = "test")
    public String test() {
        log.debug("This is a debug Level log");
        log.info("This is a info Level log");
        log.error("This is a error Level log");
        log.warn("This is a warn Level log");
        return "complete";
    }
You can call the interface to view the log output code.
We can see that the log output is info and below.
Step 2: modify the level of the logger log
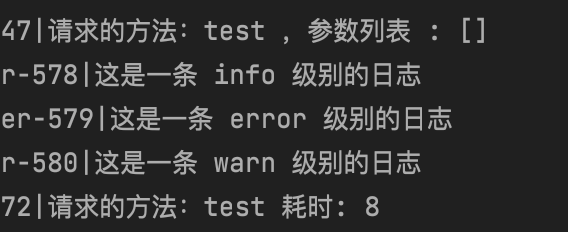
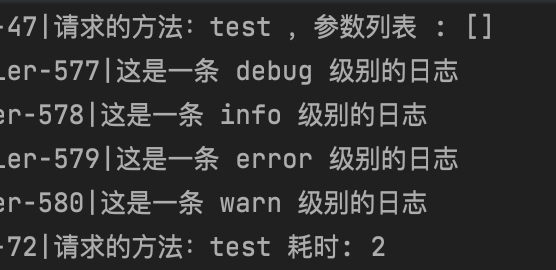
logger -c 18b4aac2 --name ROOT --level debug
After modifying the log level, the output log is the debug level.
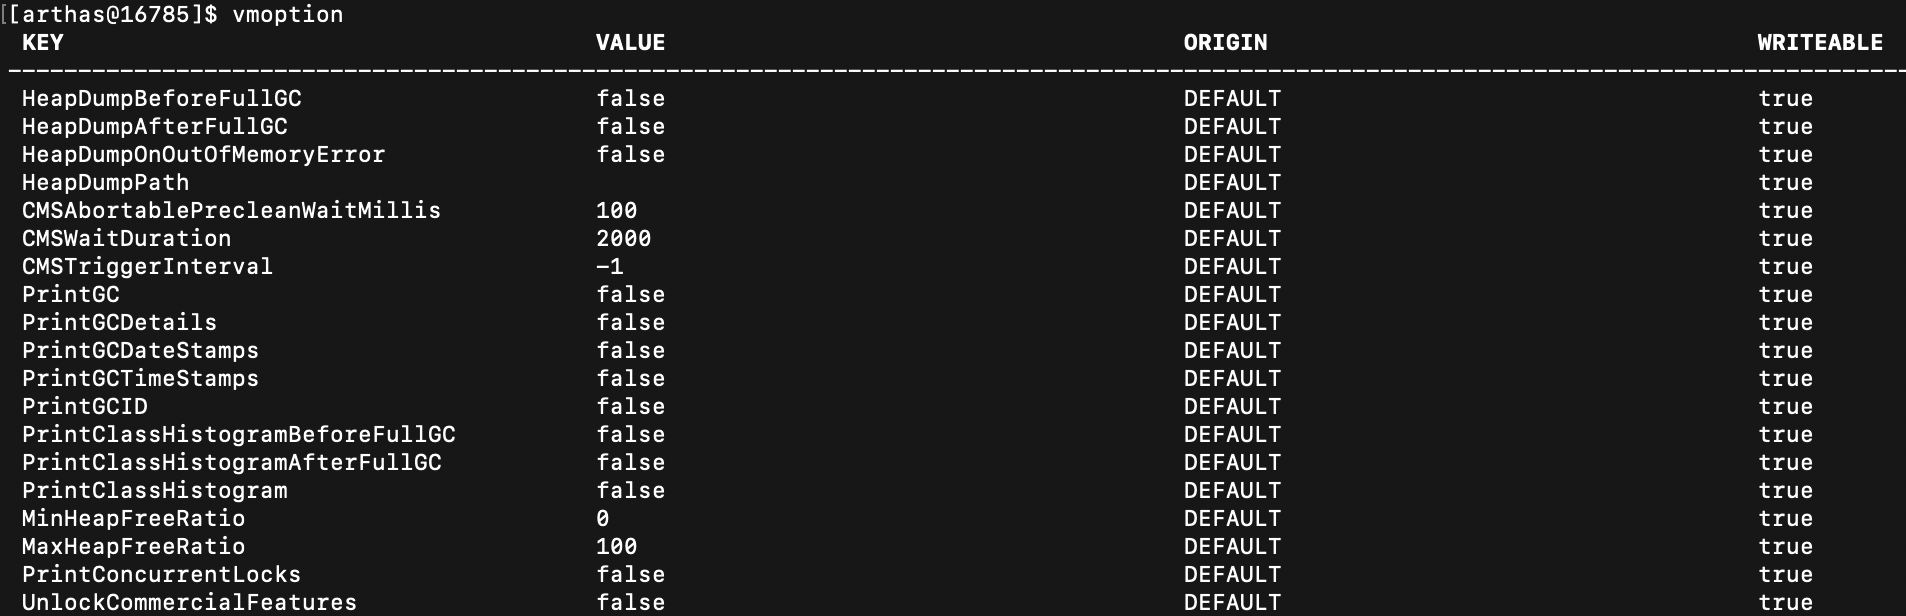
8. Query the jvm information and modify it -- when memory overflow occurs, you can manually set the print heap log to the file
Usually, the jvm parameters are queried using the tool [jinfo process number] that comes with Java. Get jvm parameters through vmoption in arthas:
Suppose we want to set the JVM to automatically dump the heap snapshot when OutOfMemoryError occurs
vmoption HeapDumpOnOutOfMemoryError true
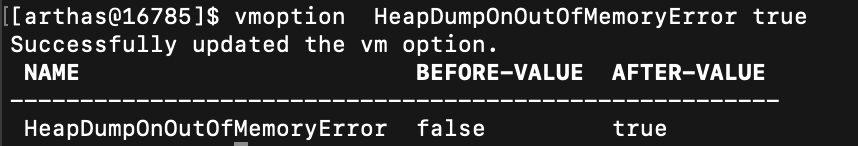
At this time, if heap memory overflow occurs, the log will be printed to the file
9. Time consuming monitoring function
trace Full class name of the method to be monitored method name to be monitored
trace com.lxl.jvm.DeadLockTest generatorUser
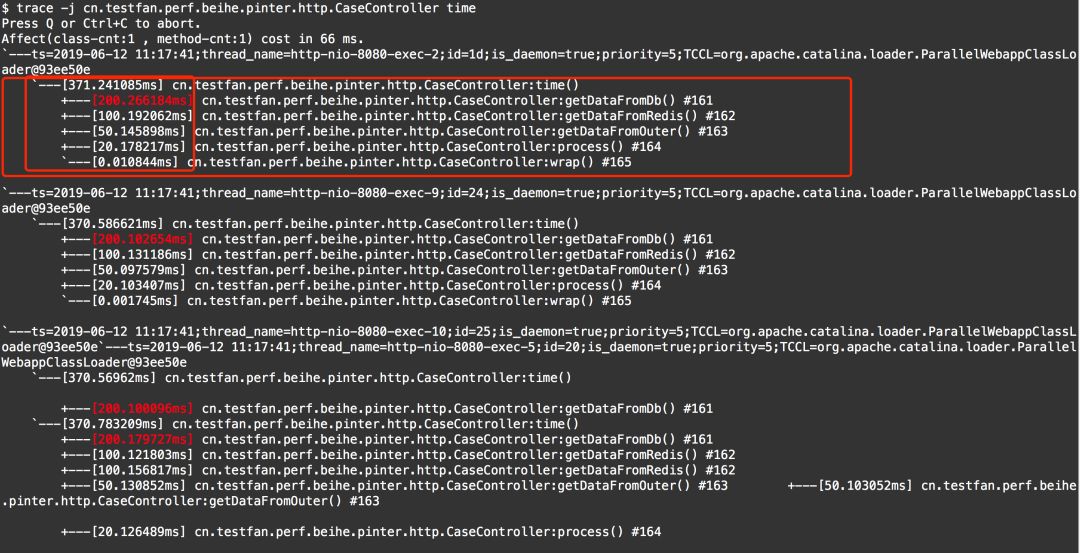
- You can see from the circled part that the total time of the interface entry function is 371ms
- The getDataFromDb function takes 200ms
- The getDataFromRedis function took 100ms
- The getDataFromOuter function takes 50ms
- The process function takes 20ms
Obviously, the slowest function has been found. Next, we need to further analyze the code and then optimize it
The above are common tools for JVM tuning. If you think this article is helpful, you can forward attention and support
Original link: https://www.cnblogs.com/ITPower/p/15785439.html
Author: the blooming sun