preface
This time is to optimize the code of crawler 1 a few days ago, add a table style to center, and finally read the data from the table in the form of tabulation
1, Foreword
. Beautiful Soup transforms a complex HTML document into a complex tree structure. Each node is a Python object. The parser extracts the tag < item > of the data, and then the regular expression accurately crawls the content of the item tag to get the required data, saves it in the list, writes it into the table, and then reads the data to the output window for viewing. Still crawling Douban movie data.
2, Use steps
1. Import and storage
Import the required library name. openpyxl is used for table processing and re is used for regular expression processing
# - * -coding:GBK - * -
from bs4 import BeautifulSoup
from openpyxl.styles import Alignment
from openpyxl import Workbook,load_workbook
import requests
import re
# Define regular expressions
findsort = re.compile(r'<em class="">(.*?)</em>') # ranking
findhref = re.compile(r'<a href="(.*?)">')# address
findname = re.compile(r'<img alt="(.*?)"')# name
findsrc = re.compile(r'src="(.*?)"')# poster
findinfo = re.compile(r'<p class="">(.*?)</p>',re.S)# Movie information
findring = re.compile(r'<span class="rating_num" property="v:average">(.*?)</span>')# score
findjudge = re.compile(r'<span>(\d*)')# Number of comments
findquote = re.compile(r'<span class="inq">(\w*)')#Movie theme
data=[]# Used to traverse the loop to save the movie
datalist = []# Used to save data at the end of the cycle
2. Code analysis
1. Traverse to get movie data
def GetData(s):
    for u in range(10):
        u = u*25
        url = s+str(u)
        headers = {
            'User-Agent': 'Mozilla/5.0 (Windows NT 10.0; WOW64) AppleWebKit/537.36 (KHTML, like Gecko) Chrome/58.0.3029.110 Safari/537.36'}
        html = requests.get(url = url, headers = headers).content
        soup = BeautifulSoup(html, 'html.parser')
        for item in soup.find_all('div', class_ = 'item'):# Return to list
            item = str(item)
            sort = re.findall(findsort,item)
            href = re.findall(findhref,item)
            name = re.findall(findname,item)
            src = re.findall(findsrc,item)
            rating = re.findall(findring,item)
            judge = re.findall(findjudge,item)
            quote = re.findall(findquote,item)
            info = re.findall(findinfo,item)
            info = ' '.join(info[0].split())
            info = info.replace("<br/>"," ")
            src.append(info)
            if len(quote)==0:
                quote.append('No data')
            list = sort+name+href+src+rating+judge+quote
            datalist.append(list)
    return datalist
Analysis: only 25 movie data are loaded on one page. You need to cycle through and splice the url to obtain the data of all movies. You need to cycle 10 times to obtain all the data. Judge the movie theme. If the data is empty, enter "no data", then add all the data lists to form a movie list, and finally append a movie data to the general table.
2. Save the summary table to the table
def SaveData(datalist):
    Save = Workbook()# Create table object
    sheet = Save.active# Get sheet object
    sheet.title=('Douban film')# Worksheet title
    sheet.append(['ranking','Movie name','Movie website','poster','Movie information','score','Number of evaluators','Movie theme'])
    # Set the table style for the corresponding column object of the instance table
    sheet.column_dimensions['A'].width='5'
    sheet.column_dimensions['B'].width='14'
    sheet.column_dimensions['E'].width='75'
    sheet.column_dimensions['F'].width='5'
    for data in datalist:
        sheet.append(data)
    # Center the data in columns A and F of the table
    colA = sheet['A']
    for cell in colA:
        cell.alignment = Alignment(horizontal='center',vertical='center')
    colF = sheet['F']
    for cell in colF:
        cell.alignment = Alignment(horizontal='center',vertical='center')
    Save.save('Douban film top250-2.0.xlsx')
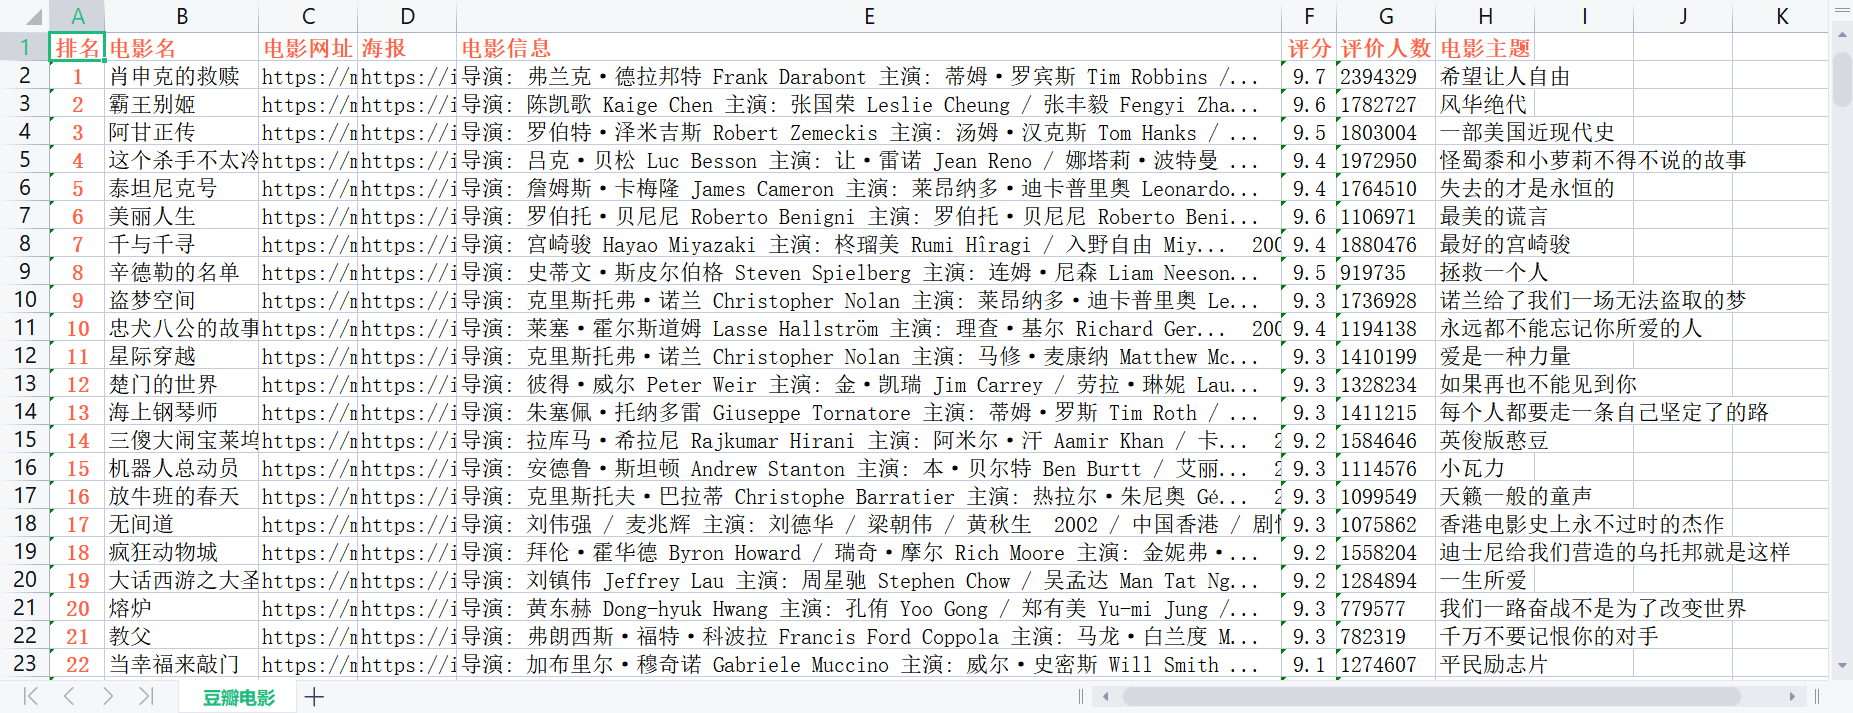
Analysis: set the width of the corresponding cells according to the data length, and then center the table column A and column F horizontally and vertically. Since sheet ['a'] is a tuple type, it is necessary to set the style by cyclic traversal output
3. Read out the data and load it in the output window
def ReadData():
    Write = load_workbook('Douban film top250-2.0.xlsx')
    table = Write.active
    rows = table.max_row
    cols = table.max_column
    for row in range(rows):
        for col in range(cols):
            data = table.cell(row+1,col+1).value# Read data
            print(data,end=' ')
        print('')
Analysis: through load_workbook method, table instance, table object. Rows and cols obtain the maximum number of rows and columns of the table, which are used to traverse the output index, and output the table data in tabular form through nested loops
effect:
Form:

Output window:
