Data binding
DataJoin
Essence: data is bound with entities, that is, after binding, each entity has its own semantics.
For example, in demo2, if the region field in the data is bound to the entity, the entity represents the region
Eg:
- The number of people per country is bound to the length of the rectangle
- The proportion of people infected by the epidemic is bound to the radius of the circle
objective
- Using data join can save a large amount of code for setting entity properties according to data
- Provide a unified interface for data dynamic update
problem
//Bad binding method
d3.selectAll('rect').data(data).attr('width', d=>xScale(d.value))
However, there will be some problems with the above binding, because if data() does not specify a key, it will bind according to the index by default. Therefore, if the index of the dataset is changed, such as [{Name: A, value: 20}, {Name: B, value: 60}] is changed to [{Name: B, value: 60}, {Name: A, value: 20}], there will be a problem if the key is not specified during binding
Solution - > the binding function for data binding is data (data, keyFunction), and the keyfunction is used as the data binding key.
//Correct binding mode
d3.selectAll('rect').data(data, d=> d.name).attr('width', d=> d.value)
For data bound through keyFunciont, duplicate data will only be bound into one entity
be careful!
However, there is a note for the keyFunction here. If it is bound for the first time, it must be bound according to the index. Therefore, if keyFunction is specified for the first binding, an error will be reported.
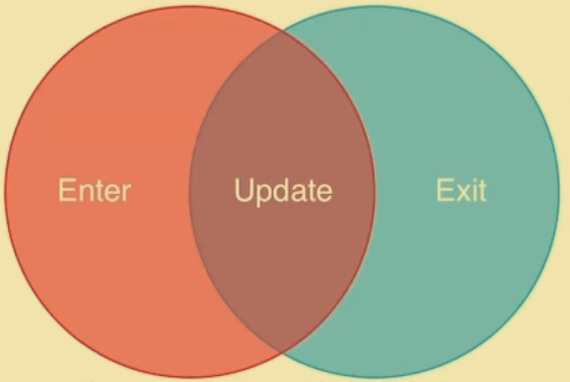
D3.js binding data has three states:
-
Update
Elements and data items are the same, that is, the above description is a simple update
-
Enter
Data has more entries than primitives, or even no primitives, which is often used for the first data binding
-
Exit
Data has fewer entries than primitives and is often used to end visualization
Enter
const p = maingroup.selectAll('.class').data(data).enter().append('').attr('')
enter() method:
- Provide a placeholder for non-existent data bound elements
It is equivalent to that no element is selected when the selectAll() method is selected. Then set a placeholder. After the setting is completed The append() method can add an entity to the data, such as append('rect ').
append() method:
- In fact, after append is called, the data join will switch from Enter mode to Update mode
summary
-
The essence of the enter() method is to generate a pointer to the parent node, and the append() operation is equivalent to adding an entity with the number of pointers behind the parent node and binding it with the extra data
-
⚠️ Generally, when entering, data() does not need to specify keyFunction. Because this is the first binding, it must be bound according to the index.
Update
- Update is the most commonly used state in visualization tasks
- When using D3 to realize animation, it is based on Update status
Exit
- If there are elements without data, you need to Exit()
const p = maingroup.selectAll('.class').data(data).exit().remove() //{.. the latter two states are the same as the first two states. You can set attributes, animation, etc.}
data.join
There is also a more concise method
data.join()??Dont know
D3 realize animation
Example code:
d3.selectAll('rect').data(data,d=>d.name).transition().duration(1000).attr('width',d=>xScale(d.value))
Explanation:
- transition() means that the attribute attr() is set later in the form of animation
- duration() indicates the duration of the animation, in ms
D3 data reading
d3.csv('host/dictionary/fileName').then(data => {})
- d3. The return value of the CSV () function is a Promise object of JS, which is used to perform asynchronous operations
- The argument to. then() is a function with arguments Return value of csv()
- That is, D3 CSV () will normally request data from the server. After the request and processing, it will throw the result to the callback function in then().
But it also raises cross domain issues: CORS
- If d3 If CSV reads the local path of the host, a cross domain error will be reported, which is why d3 programming requires a server
Basic programming ideas
- Encapsulate the element loaded by default as a function renderInit()
- Encapsulate the elements that need to be loaded dynamically into a function
Sample code of this lesson (demo2 dynamic scatter diagram. html)
<!DOCTYPE html>
<html>
  <head>
    <title>Scatter-Simple</title>
    <script src="./js/d3.min.js"></script>
    <meta http-equiv="Content-Type" content="text/html; charset=utf-8">
  </head>
  <body style="text-align: center">
    <svg width="1500" height="600" id="mainsvg" class="svgs" style="background-color: #ffffff;"></svg>
    <script>
        // get main SVG and its attributes & setting hyper-parameters;
        const svg = d3.select('#mainsvg');
        const width = +svg.attr('width');
        const height = +svg.attr('height');
        const margin = {top: 100, right: 120, bottom: 100, left: 90};
        const innerWidth = width - margin.left - margin.right;
        const innerHeight = height - margin.top - margin.bottom;
        let xScale, yScale;
        const xAxisLabel = 'Cumulative confirmed number (logarithm)';
        const yAxisLabel = 'Number of new employees (logarithm)';
        let alldates;
        let sequantial;

        //Improve code extensibility
        //Because it is to bind d to an element, if you want to get each specific attribute value in D
        //You can define the value function at the front. Later, if you get the value relative to a property, you can throw xValue and yValue as callback functions.
        //And if you change the abscissa and ordinate values, you can change this place, so you don't need to change the code in large sections

        //In fact, we convert the data to the pair of values before mapping them
        let xValue = d => Math.log(d['Number of confirmed cases']+1);
        let yValue = d => Math.log(d['New diagnosis']+1);
        let rValue = d => Math.sqrt(d['Diffusion index']*500)*0.8;


        var color = {
            "Wuhan":"#ff1c12",
            "Yellowstone": "#de5991",
            "Shiyan": "#759AA0",
            "Jingzhou": "#E69D87",
            "Yichang": "#be3259",
            "Xiangyang": "#EA7E53",
            "Ezhou": "#EEDD78",
            "Jingmen": "#9359b1",
            "Filial piety": "#47c0d4",
            "Huanggang": "#F49F42",
            "Xianning": "#AA312C",
            "enshi ": "#B35E45",
            "Suizhou": "#4B8E6F",
            "peach of immortality": "#ff8603",
            "Tianmen": "#ffde1d",
            "Qianjiang": "#1e9d95",
            "Shennongjia": "#7289AB"
        }

        /**
        * Initialization function
        * Define scale
        * Add axis
        */
        const renderinit = function(data){
            // Linear Scale: Data Space -> Screen Space;
            xScale = d3.scaleLinear()
            .domain([d3.min(data, xValue), d3.max(data, xValue)]) // "extent" is equivalent to [d3.min(data, xValue), d3.max(data, xValue)];
            .range([0, innerWidth])
            .nice();   //Not adding nice() will make the coordinate axis more than one section

            // Introducing y-Scale;
            yScale = d3.scaleLinear()
            .domain(d3.extent(data, yValue).reverse()) // remember to use reverse() to make y-axis start from the bottom;
            //The vertical axis of d3 starts from the upper left corner by default. Therefore, the smaller data value should be mapped to the larger coordinate value. You can reverse() domain or reverse() range()
            .range([0, innerHeight])
            .nice();

            // The reason of using group is that nothing is rendered outside svg, so margin of svg is always blank while margin of group is rendered inside svg;
            const g = svg.append('g')
            .attr('transform', `translate(${margin.left}, ${margin.top})`)
            .attr('id', 'maingroup');

            // Adding axes;
            const yAxis = d3.axisLeft(yScale)
            .tickSize(-innerWidth)
            //.tickFormat(d3.format('.2s'))
            .tickPadding(10); // .tickPadding is used to prevend intersection of ticks;
            const xAxis = d3.axisBottom(xScale)
            //.tickFormat(d3.format('.2s'))
            .tickSize(-innerHeight)
            .tickPadding(10);

            let yAxisGroup = g.append('g').call(yAxis)
            .attr('id', 'yaxis');
            yAxisGroup.append('text')
            .attr('font-size', '2em')
            .attr('transform', `rotate(-90)`)
            .attr('x', -innerHeight / 2)
            .attr('y', -60)
            .attr('fill', '#333333')
            .text(yAxisLabel)
            .attr('text-anchor', 'middle') // Make label at the middle of axis.
            yAxisGroup.selectAll('.domain').remove(); // we can select multiple tags using comma to seperate them and we can use space to signify nesting;

            let xAxisGroup = g.append('g').call(xAxis)
            .attr('transform', `translate(${0}, ${innerHeight})`)
            .attr('id', 'xaxis');
            xAxisGroup.append('text')
            .attr('font-size', '2em')
            .attr('y', 60)
            .attr('x', innerWidth / 2)
            .attr('fill', '#333333')
            .text(xAxisLabel);
            xAxisGroup.selectAll('.domain').remove();


            //legend
            var legend_color = [
                "#ff1c12",
                "#de5991",
                "#759AA0",
                "#E69D87",
                "#be3259",
                "#EA7E53",
                "#EEDD78",
                "#9359b1",
                "#47c0d4",
                "#F49F42",
                "#AA312C",
                "#B35E45",
                "#4B8E6F",
                "#ff8603",
                "#ffde1d",
                "#1e9d95",
                "#7289AB"
            ]

            var legend_name = ["Wuhan",
                "Huangshi City",
                "Shiyan City",
                "jingzhou ",
                "Yichang City",
                "Xiangyang ",
                "Ezhou City",
                "Jingmen City",
                "Xiaogan City",
                "Huanggang City",
                "Xianning ",
                "enshi ",
                "suizhou ",
                "Xiantao City",
                "Tianmen City",
                "Qianjiang ",
                "Shennongjia",
            ];

            //draw

            //Each row of legend is set to a group
            let legend = d3.select('#maingroup').selectAll('.legend')
            .data(legend_name)
            .enter()
            .append('g')
            .attr('class','legend' )
            .attr('transform', function(d,i){
                return `translate(${innerWidth+10},${i*25+10})`
            })


            //Legend rectangle
            legend.append('rect')
            .data(legend_name)
            .attr('x',0 )
            .attr('y',0 )
            .attr('width', 30)
            .attr('height', 10)
            .attr('fill', function(d,i){
                return legend_color[i]
            })

            //Legend text
            legend.append("text")
            .data(legend_name)
            .attr('class', 'legend_text')
            .attr("x", 40)
            .attr("y", 9)
            .attr("dy", ".06em")
            .style("text-anchor", "start")
            .text(function (d,i) {return legend_name[i];});


            //title
            d3.select('#maingroup')
            .append('text')
            .text("Demo2-Epidemic dynamic scatter diagram")
            .attr('text-anchor', 'middle')
            .attr('font-size', '2em')
            .attr('transform', `translate(${innerWidth / 2},-10)`)
        };


        const renderUpdate = function(seq){
            const g = d3.select('#maingroup');

            time = seq[0]['date'];
            g.selectAll('.date_text').remove();
            //Add date
            g.append("text")
            .data(['seq'])
            .attr('class', 'date_text')
            .attr('x', innerWidth/4+30)
            .attr('y', innerHeight/10-10)
            .attr('dy', '.5em')
            .attr('text-anchor','end' )
            .attr('fill', '#504f4f')
            .attr('font-size', '4em')
            .attr('font-weight', 'bold')
            .text(time)


            let circleUpdate = g.selectAll('circle').data(seq,d => d['region']);

            let circleEnter = circleUpdate.enter().append('circle')
            .attr('cx', d => xScale(xValue(d)) )
            .attr('cy', d => yScale(yValue(d)) )
            .attr('r',d => rValue(d))
            .attr('fill', d => color[d['region']] )
            .attr('opacity',0.8)

            circleUpdate.merge(circleEnter).transition().ease(d3.easeLinear).duration(1000)
            .attr('cx', d => xScale(xValue(d)) )
            .attr('cy', d => yScale(yValue(d)) )
            .attr('r',d => rValue(d));
            //ease: update mode (amplitude)


        }

        d3.csv('./data/hubeinxt.csv').then( data => {
            data = data.filter( d => d['region'] !== 'total');//Data cleaning

            data.forEach(d => {
                d['Number of confirmed cases'] = +(d['Number of confirmed cases']);
                d['New diagnosis'] = +(d['New diagnosis']);
                d['Diffusion index'] = +(d['Diffusion index']);

                if(d['New diagnosis']<0){
                    d['New diagnosis'] = 0;
                }
                console.log(data)
            });

            allDates = data.map(d => d['date']);
            //console.log(allDates);  It is found that many dates are repeated

            allDates = Array.from(new Set(allDates));//Remove duplicate values with sets

            //Sort dates
            allDates = allDates.sort((a,b)=>{
                return new Date(a)- new Date(b);
            });


            //Set an empty array to store the data of each day, and the data of each day is also an array
            sequantial = [];

            allDates.forEach(d =>{
                sequantial.push([])
            });

            //According to the index of the date, push the data of the corresponding date into the sequential array.
            data.forEach(d => {
                sequantial[ allDates.indexOf(d['date'])].push(d);
            });

            renderinit(data);

            let c = 0; //sequential index
            let intervalId = setInterval(()=> {
                if (c>allDates.length ) {
                    clearInterval(intervalID);
                }else{
                    renderUpdate(sequantial[c]);
                    c = c+1 ;
                }
            }, 1000);

        });//end of then()

    </script>
  </body>
</html>