Hello, I'm Ding Xiaojie.
The source of the case in this paper is the book data analysis practice, which uses R language. In the next period of time, I will reproduce the case as much as possible with Python + Tableau for everyone to learn.
Scene description
The monthly sales of a small APP game operated by a company increased steadily, but it suddenly decreased in July. Whether from the market environment or the environment of the game itself, the sales of the game still have room to continue to grow
, there may be two main factors affecting the sales of the game:
- New game activities
- Change of commercial publicity
After understanding, it is found that
- There is no significant change between the game activities and the activities last month
- Due to budget constraints, publicity efforts have decreased
Next, we will confirm the above conclusions based on data analysis and put forward methods to restore sales.
data description
DAU(Daily Active User)
User data visited at least once a day, 139112 lines.
| field | type | meaning |
|---|---|---|
| log_date | str | Access time |
| app_name | str | Application name |
| user_id | numpy.int64 | User ID |
DPU(Daily Payment User)
884 lines of user data (0.056 yuan) consuming at least 1 yen per day.
| field | type | meaning |
|---|---|---|
| log_date | str | Access time |
| app_name | str | Application name |
| user_id | numpy.int64 | User ID |
| payment | numpy.int64 | Consumption amount |
Install
Record the time when each user logs in to the game for the first time, 29329 lines.
| field | type | meaning |
|---|---|---|
| install_date | str | First login time |
| app_name | str | Application name |
| user_id | numpy.int64 | User ID |
Data analysis
data fetch
Read three data sets.
import pandas as pd

DAU_data = pd.read_csv('DAU.csv')
DPU_data = pd.read_csv('DPU.csv')
install_data = pd.read_csv('install.csv')
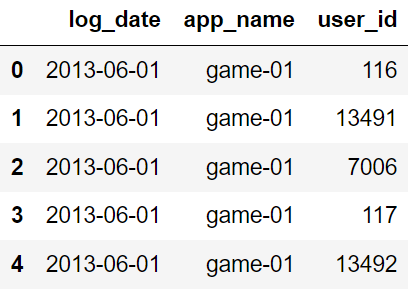
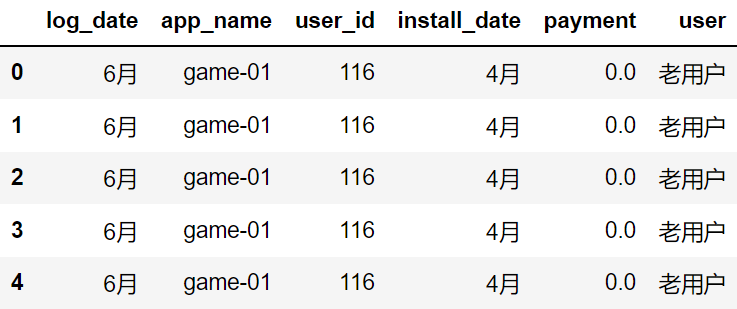
Displays the first five rows of the DAU dataset.
DAU_data.head()
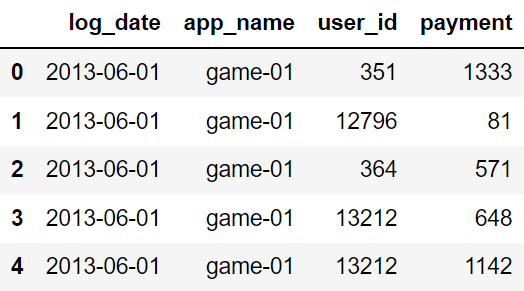
Displays the first five rows of the DPU dataset.
DPU_data.head()
Displays the first five rows of the Install dataset.
install_data.head()

Data merging
Merge the daily active user data DAU with the user's first login data Install to save the user_id and
app_name as the reference key. In this way, you can get the first login time of the user.
all_data = pd.merge(DAU_data,
                    install_data,
                    on=['user_id', 'app_name'])
all_data.head()

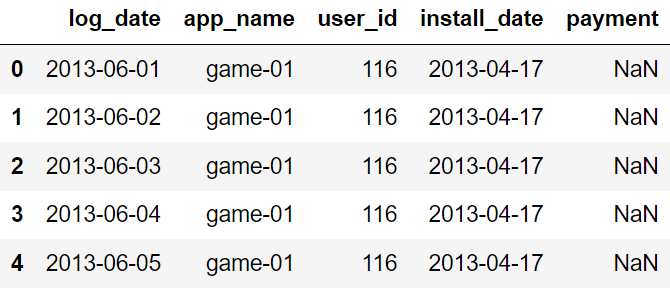
After the first login time of the user is obtained, it is merged with the daily consumption user data DPU, and the left connection method is used to retain all_ For all data in data, the missing value is NaN by default.
all_data = pd.merge(all_data,
                    DPU_data,
                    on=['log_date', 'app_name', 'user_id'],
                    how='left')
all_data.head()
data processing
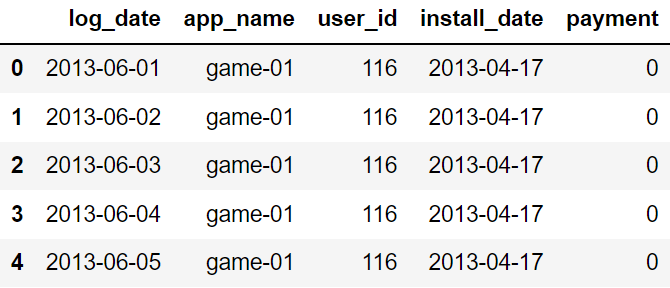
Fill the null value in the payment column with 0.
all_data['payment'] = all_data['payment'].fillna('0')
all_data
Convert the unit of payment column to meta, log_date and install_date only keeps the month.
all_data['payment'] = all_data['payment'].astype(float)
all_data['payment'] = all_data['payment'] * 0.056
all_data['log_date'] = pd.to_datetime(all_data['log_date']).map(lambda x : x.strftime("%m")[1] + 'month')
all_data['install_date'] = pd.to_datetime(all_data['install_date']).map(lambda x : x.strftime("%m")[1] + 'month')
all_data.head()

Division of new and old users
Users whose login month > first login month are defined as old users, and others are defined as new users.
all_data['user'] = all_data['log_date'] > all_data['install_date']
all_data['user'] = all_data['user'].map({False: 'new user', True: 'Old users'})
all_data.head()
According to log_ Date and user groups sum the payment and count the sales brought by new and old users in each month.
user_category = all_data.groupby(['log_date', 'user'])['payment'].sum().reset_index()
user_category.head()
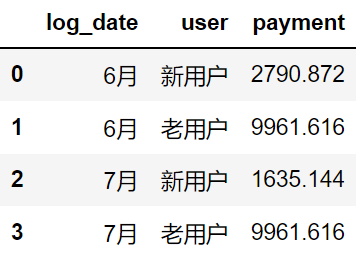
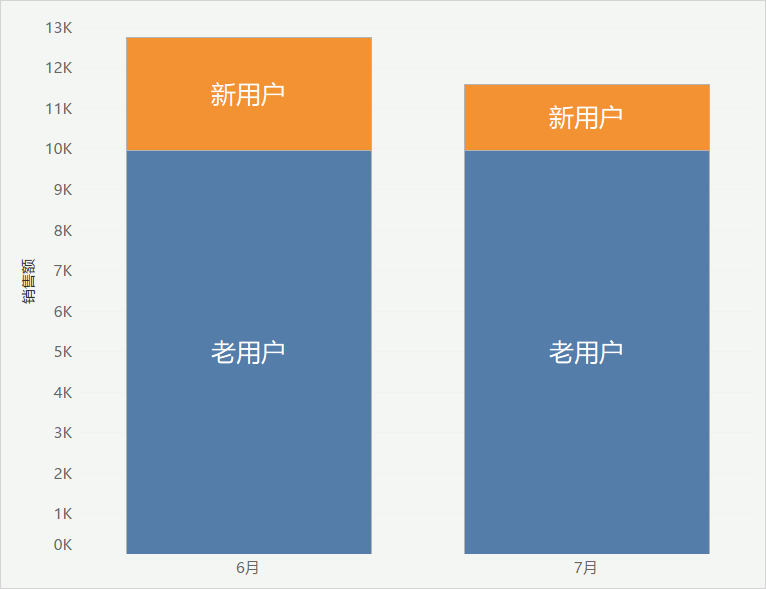
It can be seen that the sales brought by old users in June and July are basically the same, but the sales brought by new users in July are significantly less than that in June.
Divide the sales into regions to see which level of user consumption is decreasing.
import numpy as np

sale_df = all_data.loc[all_data['payment'] > 0, ['log_date', 'payment']].copy()
bins = list(range(0, 101, 30)) + [np.inf]
labels = [str(n) + '-' + str(n + 30) for n in bins[:-2]] + ['>90']
sale_df['payment_cut'] = sale_df['payment'].apply(lambda x : pd.cut([x], bins=bins, labels=labels)[0])
sale_df.head()
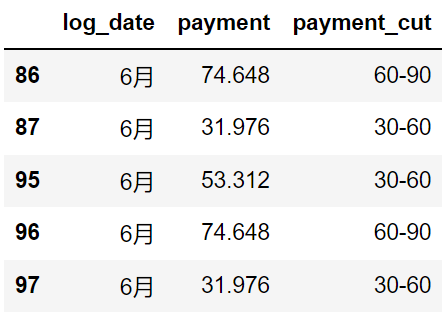
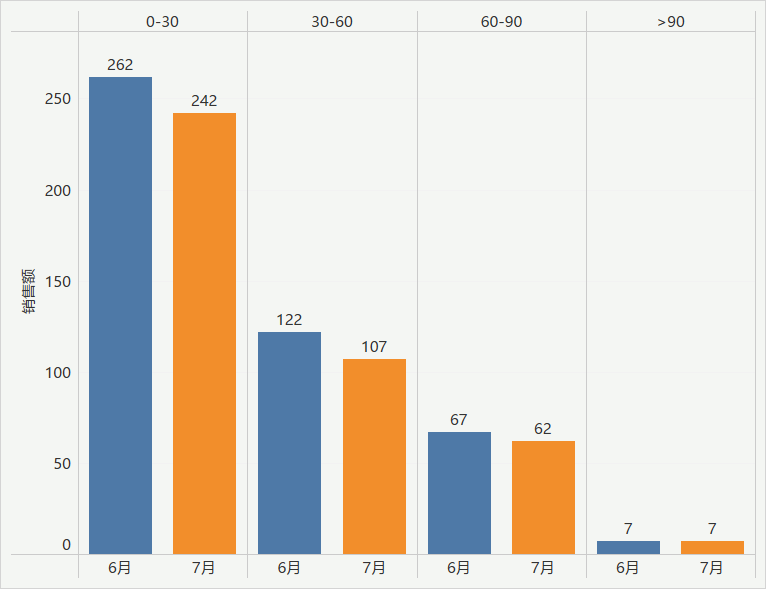
As can be seen from the histogram above, compared with June, the number of users with consumption less than 60 yuan in July decreased by some.
At this point, we can draw some conclusions.
conclusion
Among the new users, the number of users producing consumption has decreased, especially the small consumption users with less consumption amount. Therefore, the company needs to carry out business publicity activities again and return to the previous level, so as to improve the awareness of potential users of the company's products and add new users.
Case reference
[1] Data analysis practice [Japan] jiujuan long Zhili Yangping / written by Xiao Feng / translated
For those who have just started Python or want to start python, you can contact the author through the small card below to communicate and learn together. They all come from novices. Sometimes a simple question card takes a long time, but they may suddenly realize it at the touch of others, and sincerely hope that everyone can make common progress. There are also nearly 1000 sets of resume templates and hundreds of e-books waiting for you to get them!
👇🏻 Pay attention to the small cards, reply to the "communication group" and learn Python together 👇🏻