Data grouping and traversal
In this chapter, the demo data sets we use are:
import pandas as pd
dic = {'ID':[1001,1002,1003,1004,1005,1006,1007,1008,1009,1010,1011],
		'name':['Zhang San','Li Si','Wang Wu','Zhao Liu','Sun Qi','Zhou Ba','Wu Jiu','Zheng Shi','Zhang San','Wang Wu','Zheng Shi'],
		'age':[18,19,20,20,22,22,18,19,19,23,20],
	    'class':['Freshman','Sophomore','Junior','Junior','first year graduated school student','first year graduated school student','Freshman','Sophomore','Freshman','Junior','Sophomore'],
		'high':[150.00,167.00,180.00,160.00,165.00,168.00,172.00,178.00,175.00,177.00,177.50],
		'gender':['male','female','male','female','male','male','female','male','male','male','male'],
        'hobby':['violin','the game of go','Chinese chess','badminton','Swimming','Read novels','Tiktok','King','piano','Basketball','Clarinet']}
df=pd.DataFrame(data = dic,
               index = ['a','b','c','d','e','f','g','h','i','j','k'])
Among them, ID represents student number, name represents name, age represents age, class represents grade, high represents height, gender represents gender and hobby represents hobby. There are duplicate names in the data, but there are no duplicate data.
Let's start with data grouping. pandas provides a high efficiency and flexible groupby function, which can help us complete the grouping of data. Next, we divide the data into two groups according to gender:
group = df.groupby('gender')
print(group)
See the generated results after running:

Is an address information. So we try to get the content to:
group = df.groupby('gender')
for i in group:
    print(i)
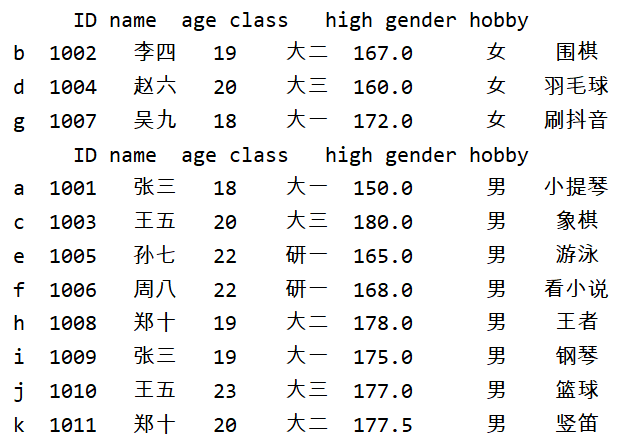
Look at the results:

In this way, the output is data of two tuple types, in which each tuple contains the classification basis, that is, gender and the information of the corresponding person under that gender, and the storage type is DataFrame. In order to verify this conjecture, you can make some changes to the code just now. You can try it yourself:
group = df.groupby('gender')
for i in group:
    print(i)
    print(type(i),type(i[0]),type(i[1]))
In this case, we can set the loop so that only the DataFrame data in the tuple is retrieved:
group = df.groupby('gender')
for i,j in group:
    print(j)

If you need to view the number of each group after grouping, you can use the size method. The return value is a Series type with grouping size:
group = df.groupby('gender')
print(group.size(),type(group.size()))

Next, let's calculate the ratio of male to female students in this data set:
group = df.groupby('gender')
print('The ratio of female students to male students is:',group.size()[0]/group.size()[1])
group.size()[0] you can directly get the total number of female students 3. Similarly, group Size () [1] you can also get the total number of boys directly. However, this method can not get our grouping basis, that is, gender.

But The items method can store the grouping basis (here is gender, male and female) and quantity in a tuple for our convenience. Group here size(). Items() generates two tuples:
group = df.groupby('gender')
for i in group.size().items():
    print(i)

In this way, we can calculate the proportion of male and female students and male students in the total number, and the program tells us whether this proportion comes from boys or girls. Remember the shape method? It can help us calculate the number of rows and columns of the table:
group = df.groupby('gender')
for i,j in group.size().items():
	print('%s The proportion of students is%.2f'%(i,j/df.shape[0]))

Here is another way to replace this:
group = df.groupby('gender')
for i,j in group.size().items():
	print('{}The proportion of students is{:2f}'.format(i,j/df.shape[0]))
Readers can try it on their own The format() method can also complete the filling of the content in the specified position ({}), and this method can also complete the retention of decimals. Its form is shown in the above example.
df. Group by ('gender ') is to group the whole data according to the gender column. Similarly, we can group only one column of data and keep only the column data we need. For example, we first classify according to gender, and then group the grades:
group = df.groupby(df['gender'])['class']
print(group)
First, let's explain the code in the first sentence. First, it is classified according to the gender column. After classification, it is still a table. Then, only the class column is reserved for this table and assigned to group. There are also df ['class'] Group by (df ['gender ']), the logic of this code is to take out the class column data in df and group the column data according to the df ['gender'] column data.
Next, let's look at the running results:

Another address. Let's take out the content with a loop:
for i in group:
    print(i)

The output is two tuples. There are two elements in each tuple type, which are the DataFrame table composed of gender basis of classification and grade information. You can write your own code to view the type.
In fact, there is another simple and practical method:
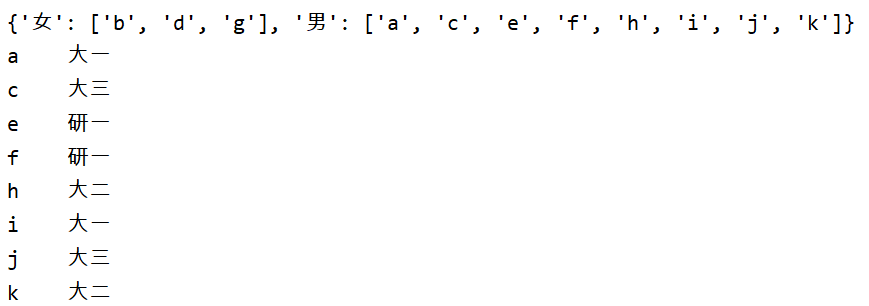
print(group.groups)
print(group.get_group('male'))

group.groups can generate a dictionary. The establishment of the dictionary is the basis for classification, and the value is the data after grouping. It is very convenient to use this statement to view the situation after grouping; group.get_group('male ') can obtain the row index of each group after grouping according to the specific name of the group. But it should be noted that this
Multi column grouping
We have finished grouping a column of information before, but this can not solve all the problems. For example, we now want to group both gender and grade, so we need to group multiple columns. The powerful groupby() method supports multi column grouping. We only need to put multiple grouping criteria into the list and pass them to groupby, for example:
group=df.groupby(['class','gender']) # Grouping by grade and gender
print(group.groups)
df1 = group.size()
print(df1)
for i,j in df1.items():
	print(i,j)

By imitating the previous method to write code, you can find group Groups will still generate a dictionary, but the dictionary key has two grouping bases, and the value is still the row index under the group. The output result of the items method is the same as before. We don't expand the description here, but we need to pay attention to the size method, because the returned index is multi-layer (first grade, then gender, and then number of people), Therefore, if we want to get the number of people, we need to write the code in the following form:
print(df1['Freshman'] # View freshman classification
print(df1['first year graduated school student']['male']) # Check the number of boys in graduate school

When three or more columns need to be grouped, the same processing method is used. Have you learned?
Statistical operation of grouping
Above, we described in detail how to group data, and completed some simple functions with size(), items() and shape(). Now please think about it. If we want to query the median age and average number of boys in this group of students, what should we do?
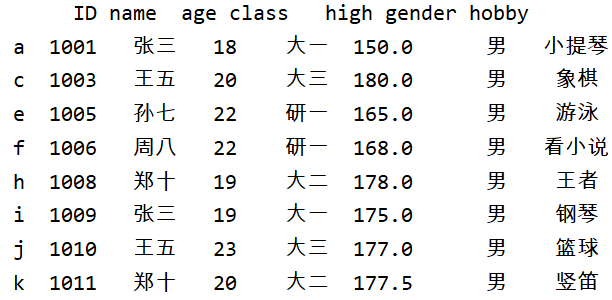
First, group get_ Group ('male ') can get the information classified as male. We run the following code:
import pandas as pd
gro = df.groupby(df['gender']) # Gender specific grouping
f_gro=gro.get_group('male') # Find the data grouped as men and save it
print(f_gro) # View f_gro save content

The output is a table with all boys' information, which is in line with our expectations. Then we perform data statistics (also known as data aggregation), which is the last step of data processing. Usually, we want to make each array generate a single value. Let's first calculate the average and median age of boys:
# Define average function
def mean (*data): # Use variable parameters
	data=data[0] # When called, a list of values is passed, which is the 0th element in the tuple
	sum=0
	all=len(data)
	for i in range(all):
		sum+=data[i]
	return sum/all

import pandas as pd
gro = df.groupby(df['gender']) # Gender specific grouping
f_gro=gro.get_group('male') # Find the data grouped as men and save it
print('The average age of boys is:{}year'.format(mean(f_gro['age'].to_list()))) # Convert the age column into a list and pass it to the mean function to get the average value

This is the channel average. However, this is not the simplest method. There are many commonly used statistical functions in pandas, including the calculation of average and median. We only need to learn to call them:
| function | significance |
|---|---|
| count() | Number of non empty data in the statistics table |
| nunique() | Count the number of non duplicate data |
| sum() | All data in the statistical table and |
| mean() | Calculate the average value of the data in the table |
| median() | Median data in statistical table |
| max() | Find the maximum value of data in the table |
| min() | Find the minimum value of data in the table |
Therefore, the complete code for calculating the mean and median can be written as:
import pandas as pd
gro = df.groupby('gender') # By sex
f_gro = gro.get_group('male') # Extract information about all men of gender

f_mean = f_gro['age'].mean()# Get average
f_max = f_gro['age'].max()# Get maximum
f_min = f_gro['age'].min()# Get minimum value
print(f_mean,f_max,f_min)
Operation results:

We can also get the statistical information of all groups through traversal:
for gro_name,gro_df in gro:
	f_gro = gro.get_group(gro_name)
	f_mean = f_gro['age'].mean() # Get average
	f_max = f_gro['age'].max() # Get maximum
	f_min = f_gro['age'].min() # Get minimum value
	f_mid = f_gro['age'].median() # Get minimum value
	print('{}The average age of students is{},The maximum value is{},The minimum value is{},The median is{}'.format(gro_name,f_mean,f_max,f_min,f_mid))

Is this a lot easier at once?
Simplification of data statistics
In the previous section, we have introduced some statistical methods, but it is troublesome to call them like that. In order to use them flexibly, pandas provides an agg() method. See the example:
for gro_name,gro_df in gro:
	f_gro = gro.get_group(gro_name)
	f_se= f_gro['age'].agg(['mean','max','min','median'])
	print('{}The average age of students is{},The maximum value is{},The minimum value is{},The median is{}'.format(gro_name,f_se[0],f_se[1],f_se[2],f_se[3]))
The output of this code is the same as that just now. You can try it yourself. Of course, the agg method is more powerful than that. It can also reference functions written by ourselves:
def peak_range(df):
    '''
    Calculate the difference between the maximum and minimum values
    '''
	return df.max()-df.min()
for gro_name,gro_df in gro:
	f_gro = gro.get_group(gro_name)
	f_se= f_gro['age'].agg(['mean','max','min','median',peak_range])
	print('{}The average age of students is{},The maximum value is{},The minimum value is{},The median is{},The range is{}'.format(gro_name,f_se[0],f_se[1],f_se[2],f_se[3],f_se[4]))

As can be seen from this example, we only need to remove the quotation marks when referring to the user-defined function, that is, the name of the user-defined function does not need to be converted into a string when passed into the agg() function. The agg() method will automatically pass the currently grouped table to our custom function and get the return value of the function.
This section introduces the groupby method for grouping data and multi column grouping, and makes statistics on the grouped data. I hope you can gain something here. Your favorite partners can pay attention to it~