Start
After cleaning and transforming the imported data, we need to further extract, merge and calculate the data we need. Today, let's talk about these three steps, and then the data processing part is almost finished. We can start data analysis.
1. Data extraction
Data extraction, also known as data splitting, refers to retaining, extracting some data from the original data table to form a new data table. The main methods are field splitting, record extraction and random extraction.
1.1 field splitting
Extracting part of information from a field to form a new field
1.1.1 Split by Position
In pandas, we can extract and split a piece of data by location using str.slice function (only character data can be processed)
It has only two parameters, starting position and terminating position, excluding the value of terminating position.
import pandas as pd
#Import data
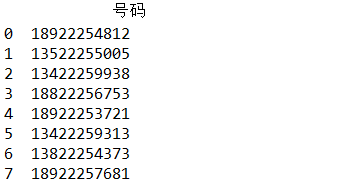
data=pd.read_csv('D:/Field Splitting.csv',encoding='GBK')
#View data
print(data)
#Converting Number Column Data to Character Type after Confirming that there is no missing
data['number']=data['number'].astype(str)
#The first three numbers are coded by operators
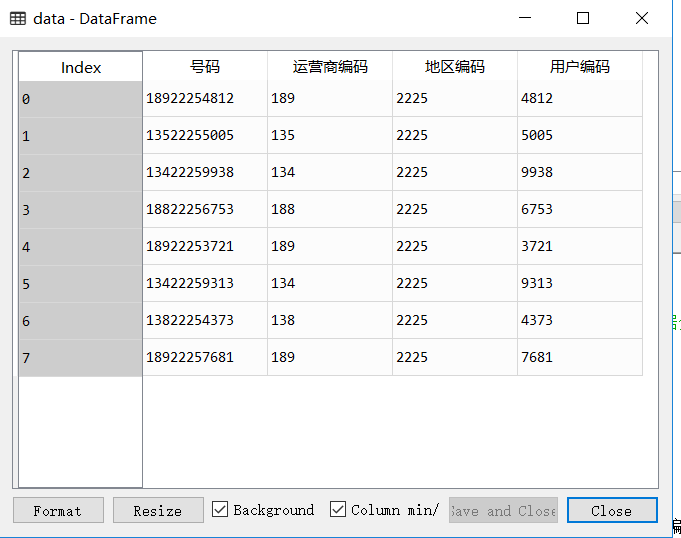
data['Operator Coding']=data['number'].str.slice(0,3)
#The next four bits are the encoding of the location.
data['Area coding']=data['number'].str.slice(3,7)
#The last four bits are user codes
data['User Coding']=data['number'].str.slice(7,11)
#View the data after adding sharding encoding
print(data)
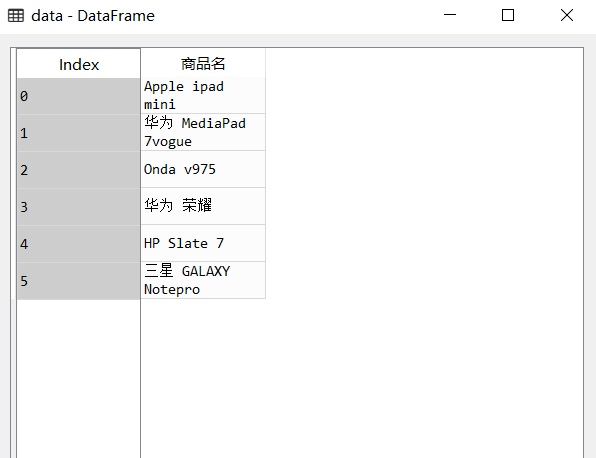
1.1.2 split by separator
Splitting our commonly used split function by separator
It has three main parameters.
pat: Separator, default space
n: Divided into n+1 columns, default is - 1 to return all delimited columns
Expand: Whether to expand as a data box, default to False
import pandas as pd
#Import data
data=pd.read_csv('D:/Field Splitting.csv',encoding='GBK')
#View data
print(data)
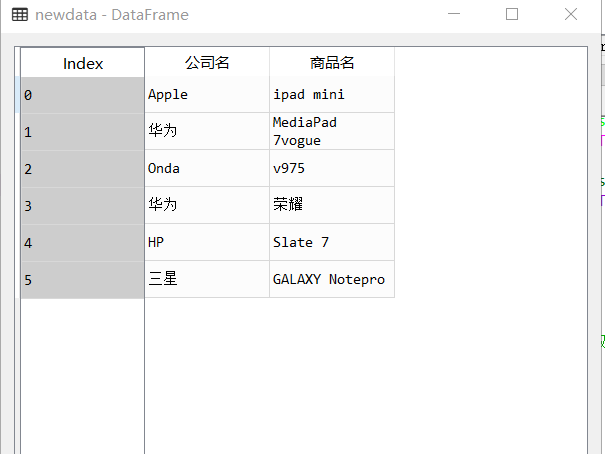
newdata=data['Commodity Name'].str.split(' ',1,True)
newdata.columns=['Company name','Commodity Name']
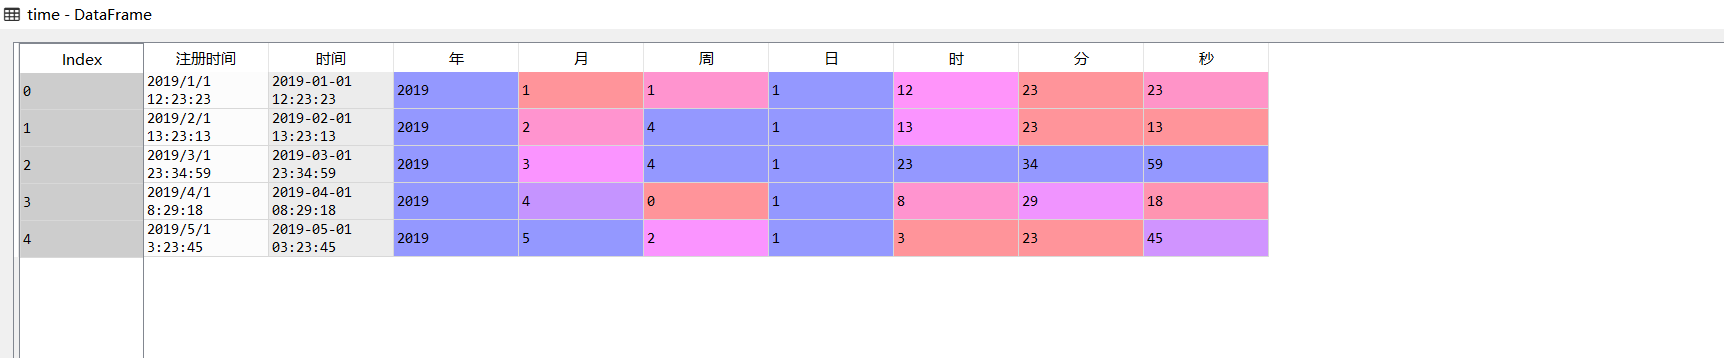
1.1.3 Time Attribute Separation
Time attributes are often needed to be processed in data processing. How to extract the time attributes from the original data into the style we need more is to split the time attributes.
Generally, to_datetime function is used to transform the corresponding data into time-dependent variables, and then extract the corresponding data information.
The to_datetime function looks at the end of the third day
import pandas as pd
time=pd.read_csv('D:/Time processing.csv',encoding='GBK')
time['time']=pd.to_datetime(time.Registration time,format='%Y/%m/%d  %H:%M:%S')

time['year']=time['time'].dt.year
time['month']=time['time'].dt.month
time['week']=time['time'].dt.weekday
time['day']=time['time'].dt.day
time['time']=time['time'].dt.hour
time['branch']=time['time'].dt.minute
time['second']=time['time'].dt.second
1.2 Record Extraction
Extracting data according to specified conditions is similar to filtering
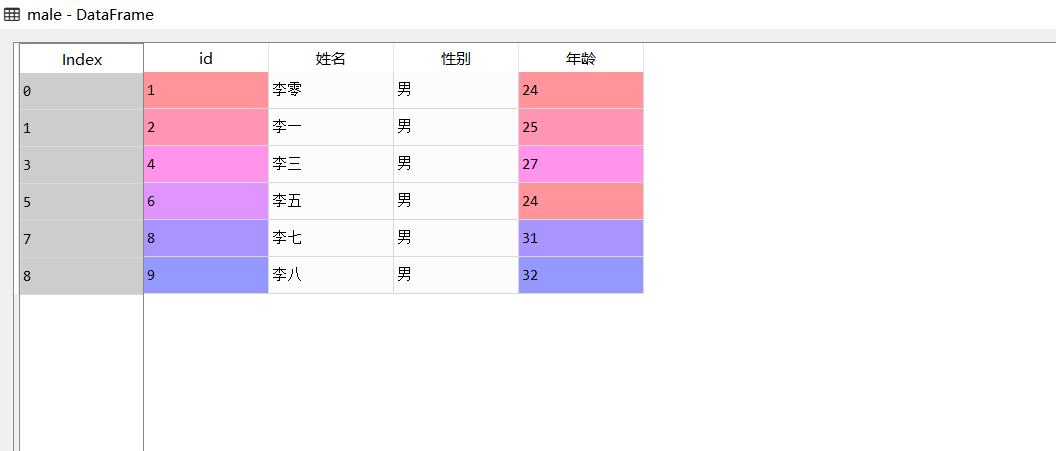
1.2.1 Keyword Extraction
Keyword extraction from data using contains function
There are three common parameters
pat: The keyword to be extracted
Case: Ignore case, default to True
na: The missing value is populated with, by default, NaN
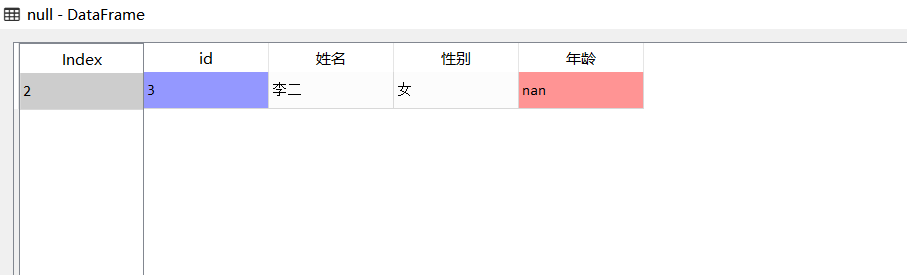
1.2.2 Null Value Extraction
isnull function can be used to extract row information with null column values
1.2.3 Data Range Extraction
In general, <,>,<=,>=,!=, you can also use the between function.
between(left,right,inclusive=True)
left is the minimum, right is the maximum, inclusive contains the minimum and maximum, default to True
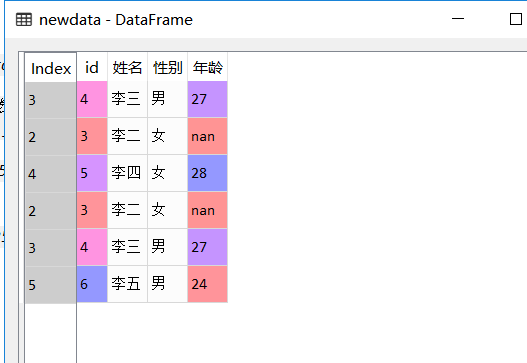
# -*- coding: utf-8 -*-
import pandas as pd
#Import data
data=pd.read_csv('D:/data processing.csv',encoding='GBK')
#Keyword extraction, using contains function
#Find all men's information
male=data[data.Gender.str.contains('male',na=False)]
#isnull function is used to extract the null value of age
null=data[data.Age.isnull()]
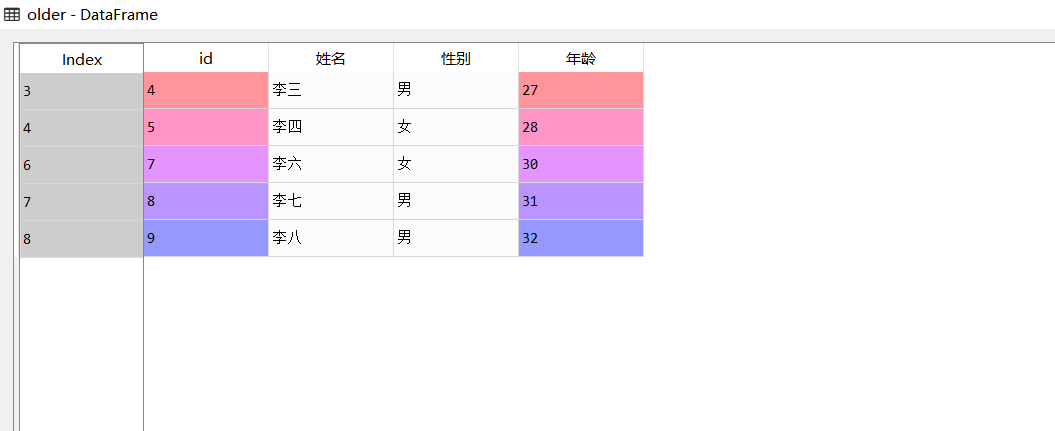
#Data range extraction to find information about people older than 25 years old
older=data[data.Age>25]
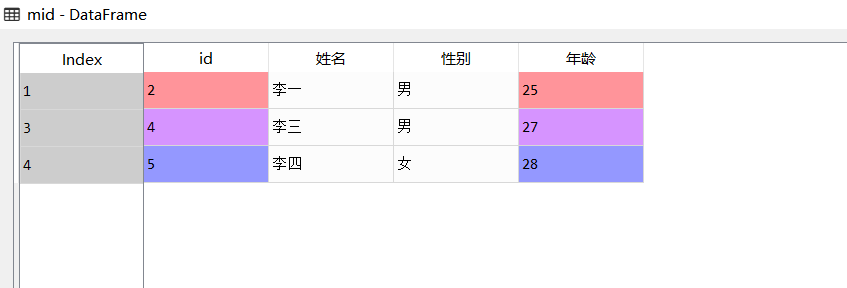
#Find information about people aged between 25 and 28
mid=data[data.Age.between(25,28)]
We can also combine multiple conditions, using logical operators &, |, ~join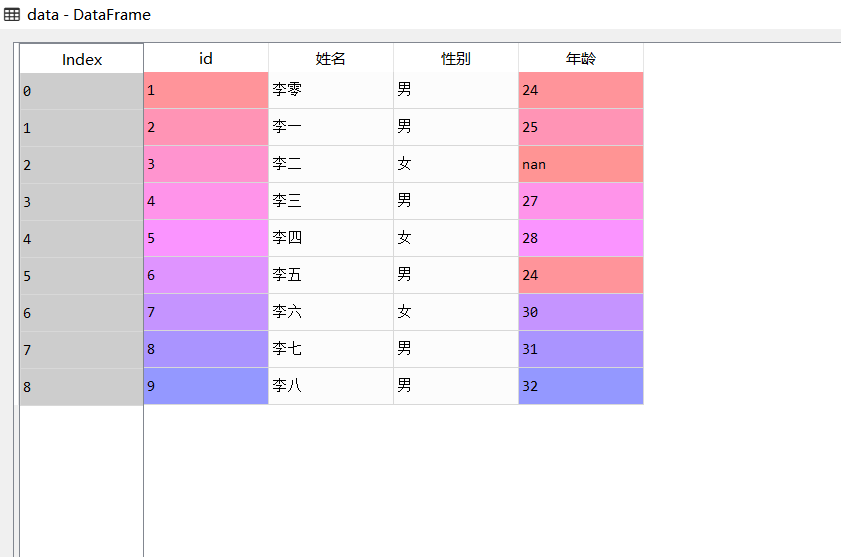
1.3 Random Sampling
Generally, they are divided into playback sampling and non-playback sampling.
Saple function can be used in general.
n: Sampling by Number
frac: Sampling by percentage
replace: False has no playback sampling, True has playback sampling, default is False.
#Sampling data by number
data1=data.sample(3)
#Sampling data by percentage
data2=data.sample(frac=0.3)
2. Data merging
Data merging refers to merging different data in a table into a new table.
2.1 Record Merging
We will get a lot of new data in data extraction, and merging them will require record merging.
Using concat function, the data boxes to be merged are passed in as lists, and new tables can be obtained.
import pandas as pd
#Import data
data=pd.read_csv('D:/data processing.csv',encoding='GBK')
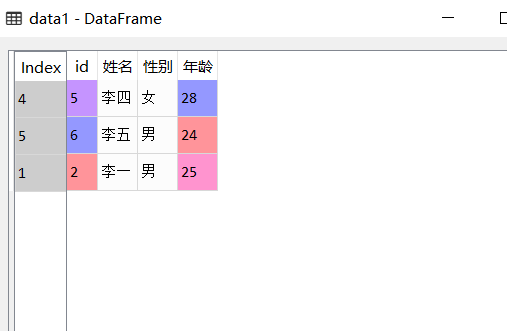
#Sampling data by number
data1=data.sample(3)
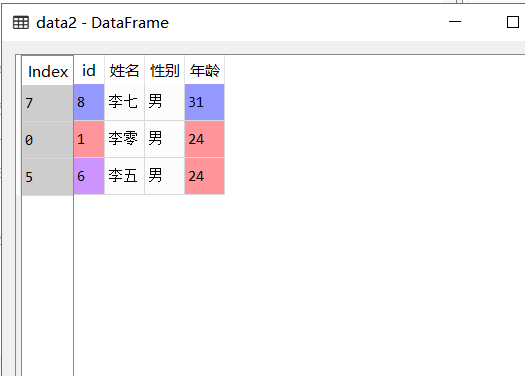
#Sampling data by percentage
data2=data.sample(frac=0.3)
#For dat1,data2 is merged into new data
newdata=pd.concat([data1,data2])
2.2 field matching
It can also be called horizontal merging, which connects two data boxes.
In general, merge function is used. It has five parameters.
Left: The data box on the left
Right: The data box on the right
left_on: The column name of the left data box used in the connection
right_on: Column name of the right data box used in the connection
how: Default is inner (inner connection) and left (left connection), right (right connection), outer (outer connection)
3. Data Computation
Do some calculations with existing data to get new data
3.1 Simple calculation
You can refer to the use of DataFrame operations in the next day, which is similar here.
3.2 Time calculation
Usually import the datetime module to calculate the corresponding data
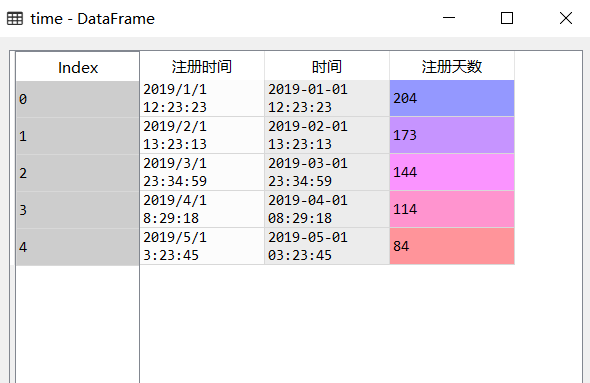
import pandas as pd
from datetime import datetime
#Import data
time=pd.read_csv('D:/Time processing.csv',encoding='GBK')
time['time']=pd.to_datetime(time.Registration time,format='%Y/%m/%d  %H:%M:%S')
time['Days of registration']=(datetime.now()-time['time']).dt.days
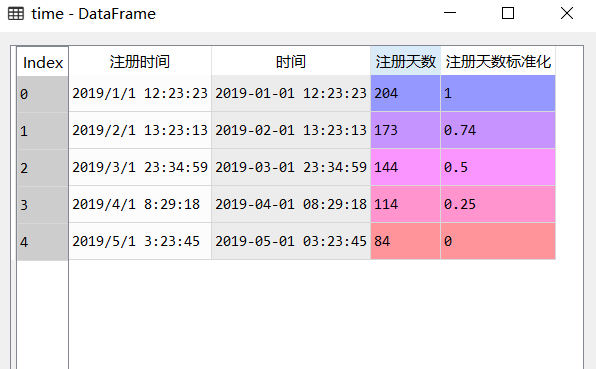
3.3 Data standardization
The most common way to scale up data is 0-1 standardization.
Using the round function, round(number,ndigits)
number is the data to be processed, ndigits are the decimal digits to be preserved
#0-1 standardization of registration days
time['Standardization of registration days']=round(
        (time.Days of registration-time.Days of registration.min()
        )/(time.Days of registration.max()-time.Days of registration.min()),2)
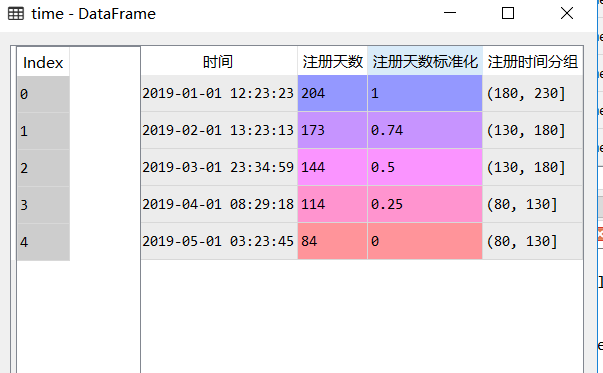
3.4 Data Grouping
Grouping data in equidistant or non-equidistant ways is also called data discretization.
Grouping data using cut function
cut(x,bins,right,labels)
x: Columns that need to be grouped
bins: A list of custom groupings
Right: Is the right side of the grouping interval closed by default?
Labels: Custom labels for groups that can be undefined
#Grouping the registration time
bins=[80,130,180,230]
time['Registration time grouping']=pd.cut(time.Days of registration,bins)
summary
At this point, the data processing part is over, familiar with the basic processing, then you can go to the most interesting data analysis link. Then I have a small crawler project, which I can share after writing in a few days. Now I'm going to play ball.