I. Introduction
the first step in the data mining competition is not what model and method you want to use, but to understand the background of the competition first. You need to carefully read the official background of the game, and then consult relevant materials to have an in-depth understanding of the problem scene. We may have a good grasp of the theoretical knowledge of machine learning and data mining, but we lack the understanding of specific problem scenarios.
after understanding the background of the competition, it is natural to understand our data. This step can make us have a further understanding of our data, which is conducive to our modeling.
II. Classification of EDA
① Overall understanding of data
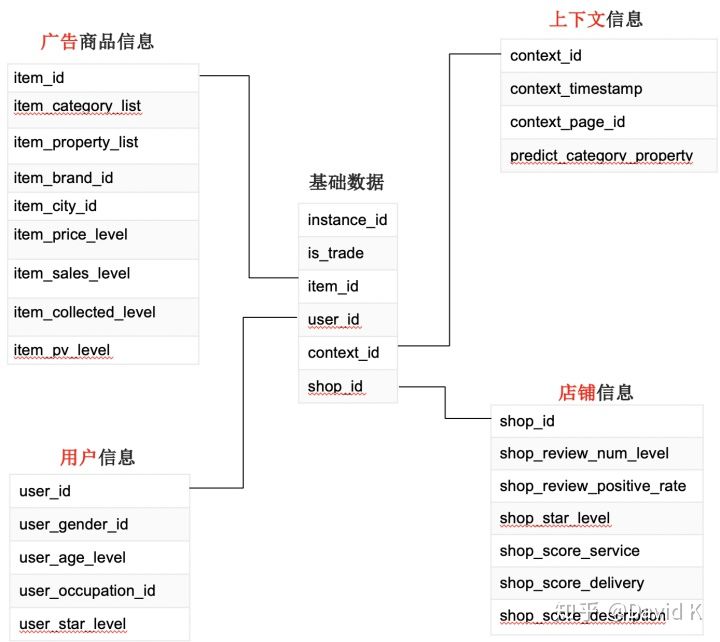
we need to know all the official data sets and the relationship between them. In this way, we can know the internal relationship between these data, so that we can have a better grasp of the whole data mining task. For example, if one group of data is a picture and the other group is a text, and each sample of the two groups of data is one-to-one corresponding, then two groups of data should be used at the same time in modeling. The following picture is an example (it is best to draw an E-R diagram):
② Quality analysis of data
quality analysis means to see whether a data is good or not from some attributes. For example, missing value, duplicate value, abnormal value, ambiguous value, positive and negative sample ratio (sample imbalance) of data. These characteristics will directly affect the learning effect of the model. Examples are as follows:
(1) Outliers will affect some models with Euclidean distance as the measurement standard, such as linear models such as Logeistic regression and SVM
(2) Positive and negative sample ratio: in academic research and teaching, many algorithms have a basic assumption that the data distribution is uniform. When we apply these algorithms directly to actual data, we can not achieve ideal results in most cases. Because the actual data are often unevenly distributed
(3) Missing value: the processing methods are particularly diverse.
③ Data statistics analysis
Data statistics analysis is mainly divided into two parts:
(1) The statistical characteristics of a single variable are analyzed. For example, the mean, median, mode, quantile, variance
(2) Statistical analysis of two or more variables. Here we mainly want to explore the relationship between the statistical distribution of any two variables, such as correlation coefficient and so on.
④ Data distribution analysis
Data distribution analysis refers to investigating the statistical distribution of a field or some fields. Including frequency, time and space
(1) Frequency
(2) Time
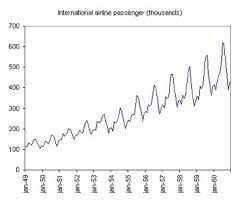
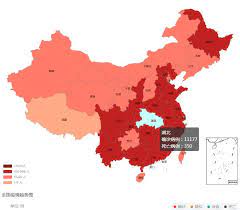
(3) Spatial distribution
Summary:
Comparison: it refers to considering the feature distribution between different samples of the comparison training set and the distribution of each feature in the comparison training set and the test set during data exploration. For example, in the Titanic, there is a big difference between Pclass and survived and unsurved, so it is determined that Pclass is a good feature.
Grouping: sum and unique after grouping by category label and different values of a discrete variable are often used in data exploration** That is to say, we should understand every feature.
**. I wrote a program to count each feature of structured data:
import pandas as pd
import numpy as np
import missingno as msno
from matplotlib import pyplot as plt
def freture_counts (data,feature):
data=data[feature].value_counts()
print(data)
def freture_describe (data,feature):
print(data[feature].describe())
train_data=pd.read_csv("train.csv")
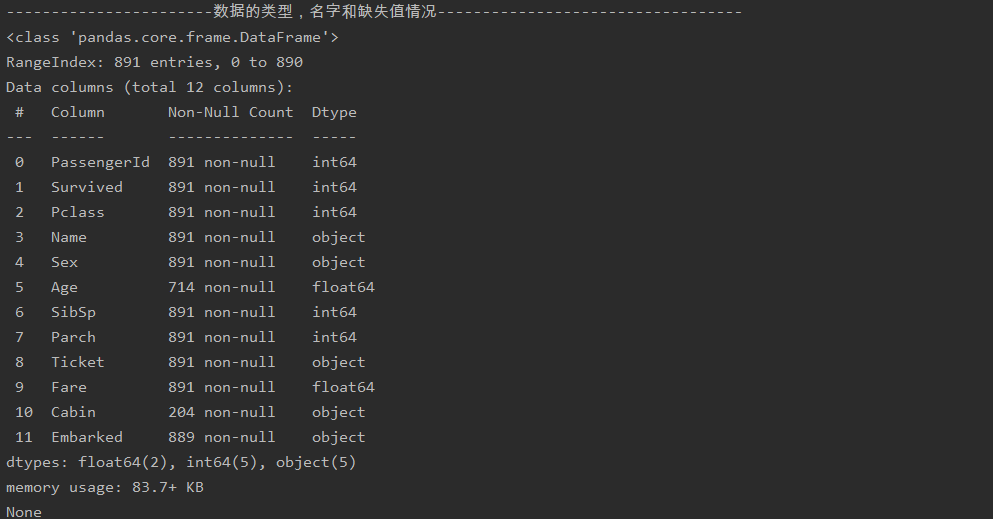
print("-----------------------Data type, name and missing value----------------------------------")
print(train_data.info())
train_data['Fare']=(train_data['Fare']-train_data['Fare'].mean())/train_data['Fare'].std()
train_data.loc[train_data['Fare']>=3,'Fare']=train_data["Fare"].mean()
picture=msno.bar(train_data, labels=True)
plt.savefig("missing")
#The purpose of this line of code is to draw a graph of missing values
print("--------------------The category of each feature, the number of categories, numerical features, and information such as mean, standard deviation, quartile, maximum and minimum-------------------------------------------------")
features=['Survived','Pclass','Name','Sex','Age','SibSp','Parch',
'Ticket','Fare','Cabin','Embarked']
for feature in features:
print( "feature name:"+feature)
freture_counts(train_data,feature)
freture_describe(train_data,feature)
print('-------------------------------------------------------------------------------')
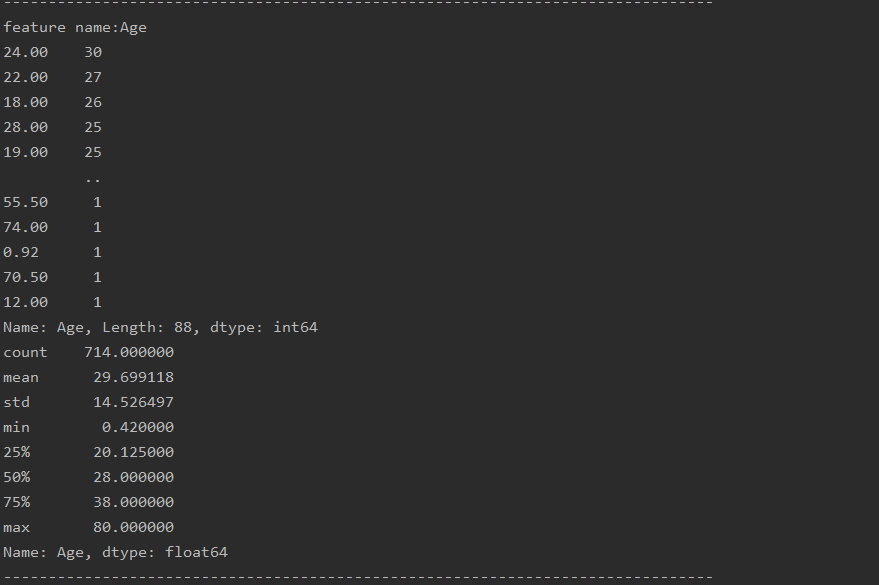
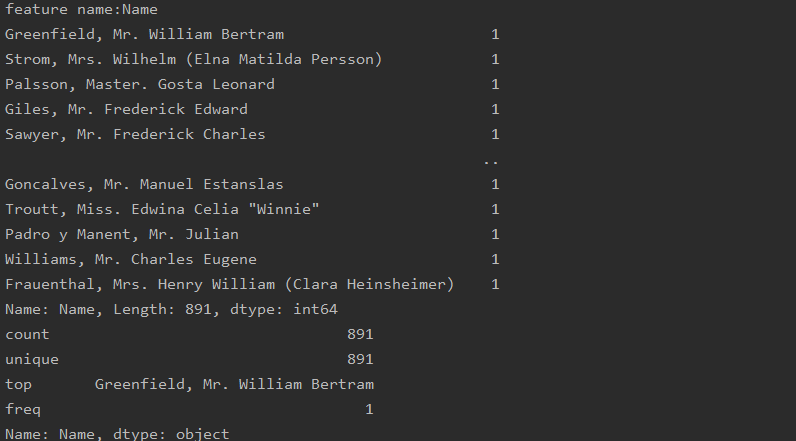
The running results of the code are as follows:
(1) This is an overview of the data
(2) This is the statistical result of each feature (one is numerical and one is non numerical)