background
Download address: https://rrc.cvc.uab.es/?ch=4&com=downloads
Note: this data is open source data, but you need to register an account. You can download it simply by registering;
Introduction: it is used for text detection task. The data includes 1000 training samples and 500 test samples;
Required data display
Firstly, the data is used for EAST algorithm and needs to be processed into the data format required by the model;
Original label data:
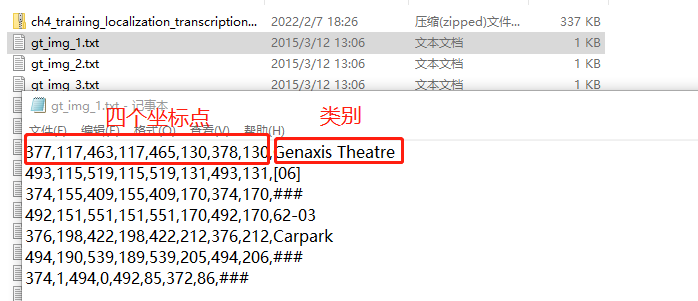
It can be seen that each image corresponds to a text, in which there are annotation information of multiple boxes, representing four coordinate points and categories respectively;
Required data format:
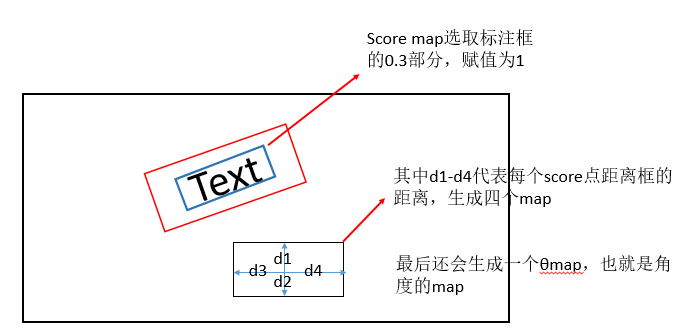
The required data is divided into three parts: Score map and d_map, θ_ Map, taking each pixel in the text position as the label sample;
code implementation
Main function implementation
class custom_dataset(data.Dataset):
    # scale means that the image is scaled to 1 / 4 of the original, and the image size is scaled to 512x512
    def __init__(self, img_path, gt_path, scale=0.25, length=512):
        super(custom_dataset, self).__init__()
        # Because the image and label data are corresponding and read in out of order under Linux system, they need to be sorted
        self.img_files = [os.path.join(img_path, img_file) for img_file in sorted(os.listdir(img_path))]
        self.gt_files  = [os.path.join(gt_path, gt_file) for gt_file in sorted(os.listdir(gt_path))]
        self.scale = scale
        self.length = length

	# Number of returned data
    def __len__(self):
        return len(self.img_files)

    # __ getitem__ This function is easy to use. You can create a class and call it with subscript
    # All data processing calls are made here
    def __getitem__(self, index):
    	# Read all text in label file
        with open(self.gt_files[index], 'r', encoding='utf-8-sig') as f:
            lines = f.readlines()
        # Function to extract points and labels
        vertices, labels = extract_vertices(lines)
        # Every time we get it, we get it at random, so this arrangement, [dynamic data enhancement], we note that the dynamics have to be enhanced, which saves a lot of space
        img = Image.open(self.img_files[index])
        # Why randomly scale the height [0.8 -- 1.2]: it should be data enhancement
        img, vertices = adjust_height(img, vertices)
        # Data enhancement, rotation angle
        img, vertices = rotate_img(img, vertices)
        # Randomly cut (zoom) 512x512 pictures
        img, vertices = crop_img(img, vertices, labels, self.length)
        # Function function: modify brightness, contrast and saturation
        # Here, the mean and variance are set to 0.5, which is actually unreasonable, but has little impact on the follow-up
        transform = transforms.Compose([transforms.ColorJitter(0.5, 0.5, 0.5, 0.25),
                                        transforms.ToTensor(),
                                        transforms.Normalize(mean=(0.5,0.5,0.5),std=(0.5,0.5,0.5))])
        # Get the training data you need, geo_map includes d1-d4 and θ, ignored_map indicates the ignored part
        score_map, geo_map, ignored_map = get_score_geo(img, vertices, labels, self.scale, self.length)
        return transform(img), score_map, geo_map, ignored_map
expand:
- There are many uses of transforms in pytoch. The following is a summary blog;
article: https://blog.csdn.net/weixin_38533896/article/details/86028509
- What is the reason why the image is scaled to 1 / 4 of the original?
Combined with the structural analysis of the network, the EAST model adopts the form of encoding and decoding, first down sampling and then up sampling, and the final output characteristic diagram is 1 / 4 of the input, so the label also needs to match with the output of the model;
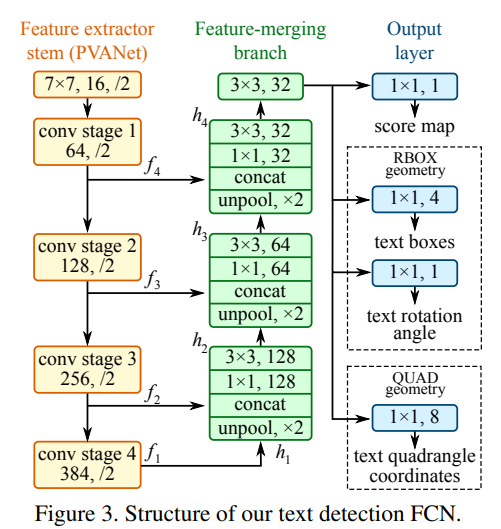
It can be seen that the down sampling multiple is 32 times and the up sampling multiple is 8 times, which is reduced by four times, that is, the output characteristic diagram is 1 / 4 of the original diagram;
extract_vertices function
Function: get the point and category information in the label text
def extract_vertices(lines):
    '''
    Input:
        lines   : list of string info
    Output:
        vertices: vertices of text regions <numpy.ndarray, (n,8)>
        labels  : 1->valid, 0->ignore, <numpy.ndarray, (n,)>
    '''
    labels = []
    vertices = []
    for line in lines:
        # Eliminate some useless information and take the first eight numbers as point coordinate information
        vertices.append(list(map(int,line.rstrip('\r\n').lstrip('\xef\xbb\xbf').split(',')[:8])))
        label = 0 if '###' in line else 1
        labels.append(label)
    return np.array(vertices), np.array(labels)
expand:
-
Some handling skills of string:
First, the map function can be used for type conversion, for example: Map (int, str []), which converts all elements in the array to int type;
rstrip ('\ r\n'): it means to remove the space and newline character on the right. lstrip ('\ xef\xbb\xbf'): eliminate a UTF-8 BOM character on the left
adjust_height function
Function: random scaling height [0.8, 1.2], data enhancement operation;
def adjust_height(img, vertices, ratio=0.2):
    '''
    Input:
        img         : PIL Image
        vertices    : vertices of text regions <numpy.ndarray, (n,8)>
        ratio       : height changes in [0.8, 1.2]
    Output:
        img         : adjusted PIL Image
        new_vertices: adjusted vertices
    '''
    # np.random.rand() generates a random number of 0-1, so the range here is 0.8 to 1.2
    ratio_h = 1 + ratio * (np.random.rand() * 2 - 1)
    old_h = img.height
    # np.around stands for rounding
    new_h = int(np.around(old_h * ratio_h))
    # Scale the height of the image
    img = img.resize((img.width, new_h), Image.BILINEAR)

    new_vertices = vertices.copy()
    if vertices.size > 0:
        # Here, only the value of coordinate point y is processed
        # Note: slicing operation requires some proficiency, which is often used in data processing
        new_vertices[:,[1,3,5,7]] = vertices[:,[1,3,5,7]] * (new_h / old_h)
    return img, new_vertices
rotate_img function
Function: rotation angle, data enhancement function;
def rotate_img(img, vertices, angle_range=10):
    '''
    Input:
        img         : PIL Image
        vertices    : vertices of text regions <numpy.ndarray, (n,8)>
        angle_range : rotate range
    Output:
        img         : rotated PIL Image
        new_vertices: rotated vertices
    '''
    # Take out the coordinates of the center point
    center_x = (img.width - 1) / 2
    center_y = (img.height - 1) / 2
    # Here, the rotation range is still set to - 10 to 10
    angle = angle_range * (np.random.rand() * 2 - 1)
    # Use the rotation function rotate in PIL Image
    img = img.rotate(angle, Image.BILINEAR)
    # Generate an array of all zeros corresponding to the same latitude
    new_vertices = np.zeros(vertices.shape)
    for i, vertice in enumerate(vertices):
        # Here we also flip each vertex
        new_vertices[i,:] = rotate_vertices(vertice, -angle / 180 * math.pi, np.array([[center_x],[center_y]]))
    return img, new_vertices

# Rotate the vertex. The angle passed in here represents radians, and 1 degree is equal to Π/ 180 radians
def rotate_vertices(vertices, theta, anchor=None):
    '''
    Input:
        vertices: vertices of text region <numpy.ndarray, (8,)>
        theta   : angle in radian measure
        anchor  : fixed position during rotation
    Output:
        rotated vertices <numpy.ndarray, (8,)>
    '''
    v = vertices.reshape((4,2)).T
    if anchor is None:
        anchor = v[:,:1]
    rotate_mat = get_rotate_mat(theta)
    # Point and matrix for point multiplication
    res = np.dot(rotate_mat, v - anchor)
    return (res + anchor).T.reshape(-1)

# Fill in the rotation matrix directly according to the affine transformation
def get_rotate_mat(theta):
    # Returns a rotation matrix
    return np.array([[math.cos(theta), -math.sin(theta)], [math.sin(theta), math.cos(theta)]])
expand:
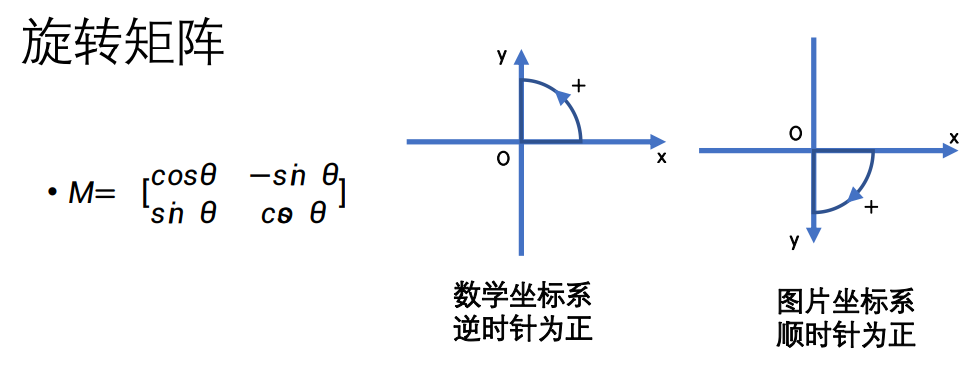
- What is the rotation matrix like? In fact, it is derived from the formula learned in junior middle school, as shown in the figure below:
crop_img function
Function: image clipping;
First of all, you need to understand the cutting process:
Step 1: first select the candidate area in the upper left corner as the selection of points. In fact, here is to cut a range;
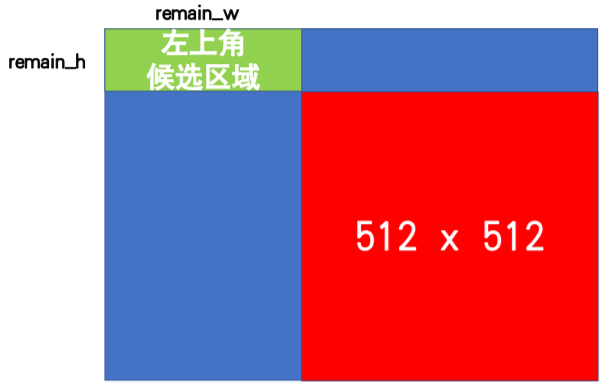
The second step is to judge whether the clipping box crosses the text box;
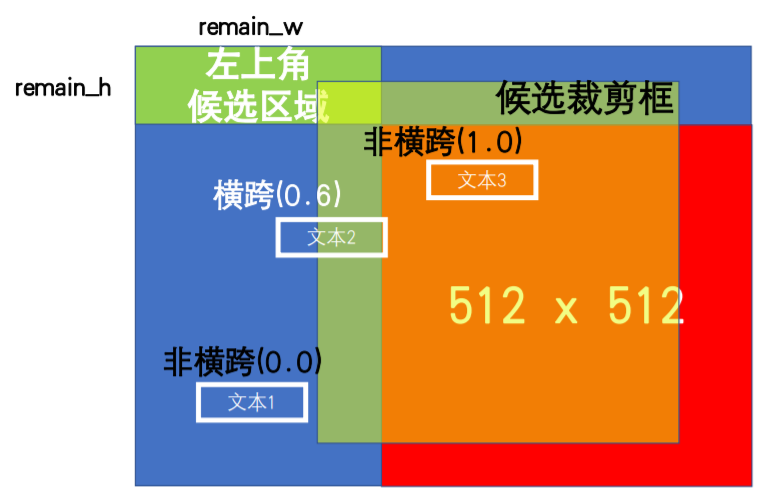
def crop_img(img, vertices, labels, length):
    '''
    Input:
        img         : PIL Image
        vertices    : vertices of text regions <numpy.ndarray, (n,8)>
        labels      : 1->valid, 0->ignore, <numpy.ndarray, (n,)>
        length      : length of cropped image region
    Output:
        region      : cropped image region
        new_vertices: new vertices in cropped region
    '''
    h, w = img.height, img.width
    # confirm the shortest side of image >= length
    # If the short side is less than 512, enlarge the short side to 512
    if h >= w and w < length:
        img = img.resize((length, int(h * length / w)), Image.BILINEAR)
    elif h < w and h < length:
        img = img.resize((int(w * length / h), length), Image.BILINEAR)
    # Calculate scaled scale
    ratio_w = img.width / w
    ratio_h = img.height / h
    # Assertion (plays an important role in program judgment)
    assert(ratio_w >= 1 and ratio_h >= 1)

    new_vertices = np.zeros(vertices.shape)
    if vertices.size > 0:
        # The labels x and y of the text box need to be multiplied by a certain proportion
        new_vertices[:,[0,2,4,6]] = vertices[:,[0,2,4,6]] * ratio_w
        new_vertices[:,[1,3,5,7]] = vertices[:,[1,3,5,7]] * ratio_h

    # find random position
    # Find the position of the initial point of random clipping, that is, the candidate area in the first step
    remain_h = img.height - length
    remain_w = img.width - length
    flag = True
    cnt = 0
    # You can't cut the text in front in half when you cross a picture.
    # 1000 attempts
    while flag and cnt < 1000:
        cnt += 1
        start_w = int(np.random.rand() * remain_w)
        start_h = int(np.random.rand() * remain_h)
        # Determine whether to span the text box
        flag = is_cross_text([start_w, start_h], length, new_vertices[labels==1,:])
    box = (start_w, start_h, start_w + length, start_h + length)
    region = img.crop(box)
    if new_vertices.size == 0:
        return region, new_vertices

    # Coordinates of standardized labels
    new_vertices[:,[0,2,4,6]] -= start_w
    new_vertices[:,[1,3,5,7]] -= start_h
    return region, new_vertices

# Function: judge whether the clipping crosses the text box
def is_cross_text(start_loc, length, vertices):
    '''
    Input:
        start_loc: left-top position
        length   : length of crop image
        vertices : vertices of text regions <numpy.ndarray, (n,8)>
    Output:
        True if crop image crosses text region
    '''
    if vertices.size == 0:
        return False
    # Length and width of clipping box
    start_w, start_h = start_loc
    a = np.array([start_w, start_h, start_w + length, start_h, \
          start_w + length, start_h + length, start_w, start_h + length]).reshape((4,2))
    # p1 represents the rectangular box represented by matrix a
    p1 = Polygon(a).convex_hull
    for vertice in vertices:
        p2 = Polygon(vertice.reshape((4,2))).convex_hull
        # You can calculate the overlapping area of two rectangular boxes (that is, the value of IOU)
        inter = p1.intersection(p2).area
        # 0.0 and 1.0 are not considered spans (with or without intersections)
        p2_area = p2.area
        if p2.area == 0:
            p2_area = 0.00000001
        if 0.01 <= inter / p2_area <= 0.99:
            return True
    return False
expand:
-
How to judge whether the clipping box is a horizontal box or a text box? In fact, it is to find the IOU value of two rectangles;
A graphics library using Python -- shapely
Step 1: create two rectangular boxes (irregular graphics can also be used)
from shapely.geometry import Polygon
# convex_hull's function is to calculate the convex hull
a = Polygon([(0, 0), (0, 1), (1, 0), (1, 1)]).convex_hull
b = Polygon([(0, 0), (2, 0), (2, 2), (0, 2)]).convex_hull
Step 2: calculate the area of overlapping part
inter = a.intersection(b).area
Step 3: find the value of IOU (i.e. the proportion of the coincident part to the target)
inter / a.area
Of course, this is a shortcut to calculate IOU, which is basically realized by calling the library (which may have a certain impact on efficiency, and the reference library also adds additional operations). In fact, numpy can be used to calculate IOU, and the specific implementation can be found by yourself;
get_score_geo function
Function: obtain map data required for training;
First, some concepts should be explained, which is also a diagram of some codes;
shrink_poly function plays the role of reducing the text box, mainly realizing the effect of reducing the text box in the required data display part;
calculation θ map value for:
find_ min_ rect_ The angle function is used to find the angle. The schematic diagram is as follows:
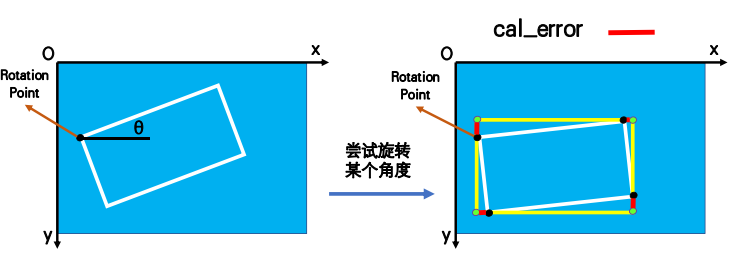
Implementation steps:
1. By traversing 0-180 °, the area of the external rectangle is saved after each rotation;
2. Compared with the area of the original text box, take out the ten rotating boxes with the smallest difference;
3. Calculate the fitting error of ten boxes and return the radian with the smallest error;
Calculate the map value of d:
To calculate the distance between the point in the text box and the boundary of the text box, first rotate the whole picture to ensure that the text box is in the horizontal direction. The schematic diagram is as follows:
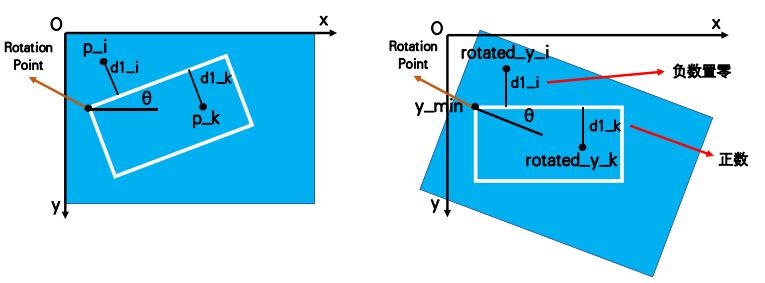
Implementation steps:
1. First rotate the image to ensure that the text box is in the horizontal direction;
2. Calculate the distance between each pixel and the boundary. If the value less than 0 is set to 0, that is, the negative number is 0;
def get_score_geo(img, vertices, labels, scale, length):
    '''
    Input:
        img     : PIL Image
	# Eight vertices of quad
        vertices: vertices of text regions <numpy.ndarray, (n,8)>
        labels  : 1->valid, 0->ignore, <numpy.ndarray, (n,)>
        scale   : feature map / image	# It is 0.25, which is understood according to the network structure
        length  : image length
    Output:
        score gt, geo gt, ignored
    '''
    # Generate zero map. Note that five maps are generated here
    score_map = np.zeros((int(img.height * scale), int(img.width * scale), 1), np.float32)
    geo_map = np.zeros((int(img.height * scale), int(img.width * scale), 5), np.float32)
    # The ignored map is not needed in training
    ignored_map = np.zeros((int(img.height * scale), int(img.width * scale), 1), np.float32)

    #Generate this NP according to length and 1/scale The meshgrid is four times smaller for downsampling
    # np. Range is an array generated in steps
    index = np.arange(0, length, int(1/scale))          #  Take a point every 4 pixels
    # np.meshgrid: returns a coordinate matrix from a coordinate vector
    index_x, index_y = np.meshgrid(index, index)
    ignored_polys = []
    polys = []

    # Traverse the vertices and give geo_map assignment
    for i, vertice in enumerate(vertices):
        #Record the quadrilateral that needs to be ignored
        if labels[i] == 0:
            ignored_polys.append(np.around(scale * vertice.reshape((4,2))).astype(np.int32))
            continue
        # Generate a poly (selected positive sample label) that is reduced by 0.3 times, that is, the text box is reduced by 0.3 times inward
        # scale is only used for fillPoly, and the actual label is not reduced by 4 times
        # shrink_ The function of poly is to shrink inward by 0.3 times
        poly = np.around(scale * shrink_poly(vertice).reshape((4,2))).astype(np.int32)
        polys.append(poly)
        # Mask of a single text box to qualify d1_map,d2_map,d3_map,d4_ Which locations in the map should be assigned values
        temp_mask = np.zeros(score_map.shape[:-1], np.float32)
        # Set the specified area in the mask with all 0 to 1, that is, the target area
        cv2.fillPoly(temp_mask, [poly], 1)

        # Through the traversal method, find the minimum circumscribed rectangle, and then find the angle of the rectangle
        theta = find_min_rect_angle(vertice)

        # Rotate the text box and rotate all pixel coordinates to the horizontal state of theta=0, which is convenient for calculation d
        # Find the rotation angle corresponding to the angle of the rectangle
        # get_rotate_mat function: return a rotation matrix (of each point) θ (all the same)
        rotate_mat = get_rotate_mat(theta)
        rotated_vertices = rotate_vertices(vertice, theta)
        x_min, x_max, y_min, y_max = get_boundary(rotated_vertices)
        # Get the value of x and y after rotation, which is [512, 512]
        rotated_x, rotated_y = rotate_all_pixels(rotate_mat, vertice[0], vertice[1], length)

        # Calculate d, a negative number indicates that it is outside the text box and set to zero
        d1 = rotated_y - y_min
        d1[d1<0] = 0
        d2 = y_max - rotated_y
        d2[d2<0] = 0
        d3 = rotated_x - x_min
        d3[d3<0] = 0
        d4 = x_max - rotated_x
        d4[d4<0] = 0
        # Sample every 4 pixels (index_y, index_x), multiplied by the mask after the text box is reduced by 0.3
        # The function here is to remove the d value of the part outside 0.3 through the mask
        geo_map[:,:,0] += d1[index_y, index_x] * temp_mask
        geo_map[:,:,1] += d2[index_y, index_x] * temp_mask
        geo_map[:,:,2] += d3[index_y, index_x] * temp_mask
        geo_map[:,:,3] += d4[index_y, index_x] * temp_mask
        geo_map[:,:,4] += theta * temp_mask

    # Ignore label as###Text box for
    cv2.fillPoly(ignored_map, ignored_polys, 1)
    # Get the mask of all text boxes of [score_map], that is, the score label
    cv2.fillPoly(score_map, polys, 1)
    return torch.Tensor(score_map).permute(2,0,1), torch.Tensor(geo_map).permute(2,0,1), torch.Tensor(ignored_map).permute(2,0,1)

# Function: reduce the text box
def shrink_poly(vertices, coef=0.3):
    '''
    Input:
        vertices: vertices of text region <numpy.ndarray, (8,)>
        coef    : shrink ratio in paper
    Output:
        v       : vertices of shrinked text region <numpy.ndarray, (8,)>
    '''
    x1, y1, x2, y2, x3, y3, x4, y4 = vertices
    # Get the short edge of each point and use it later when narrowing the range
    # The Euclidean distance is used to calculate the smallest edge of the adjacent edges of each point
    r1 = min(cal_distance(x1,y1,x2,y2), cal_distance(x1,y1,x4,y4))
    r2 = min(cal_distance(x2,y2,x1,y1), cal_distance(x2,y2,x3,y3))
    r3 = min(cal_distance(x3,y3,x2,y2), cal_distance(x3,y3,x4,y4))
    r4 = min(cal_distance(x4,y4,x1,y1), cal_distance(x4,y4,x3,y3))
    r = [r1, r2, r3, r4]

    # Judge which two opposite sides are longer and move later_ Points move the long side first
    # obtain offset to perform move_points() automatically
    if cal_distance(x1,y1,x2,y2) + cal_distance(x3,y3,x4,y4) > \
       cal_distance(x2,y2,x3,y3) + cal_distance(x1,y1,x4,y4):
        offset = 0 # two longer edges are (x1y1-x2y2) & (x3y3-x4y4)
    else:
        offset = 1 # two longer edges are (x2y2-x3y3) & (x4y4-x1y1)

    v = vertices.copy()
    # Move the long side first and then the short side. Does this matter in sequence?
    # If you move two points on the short side first, the area of the reduced quadrilateral will be smaller
    v = move_points(v, 0 + offset, 1 + offset, r, coef)
    v = move_points(v, 2 + offset, 3 + offset, r, coef)
    v = move_points(v, 1 + offset, 2 + offset, r, coef)
    v = move_points(v, 3 + offset, 4 + offset, r, coef)
    return v

# Find the best action radian
def find_min_rect_angle(vertices):
    '''
    Input:
        vertices: vertices of text region <numpy.ndarray, (8,)>
    Output:
        the best angle <radian measure>
    '''
    # Traverse all angles every 1 degree
    angle_interval = 1
    angle_list = list(range(-90, 90, angle_interval))
    area_list = []
    for theta in angle_list:
        rotated = rotate_vertices(vertices, theta / 180 * math.pi)
        x1, y1, x2, y2, x3, y3, x4, y4 = rotated
        # Directly calculate the bounding box parallel to the x-axis and y-axis
        temp_area = (max(x1, x2, x3, x4) - min(x1, x2, x3, x4)) * \
                    (max(y1, y2, y3, y4) - min(y1, y2, y3, y4))
        area_list.append(temp_area)

    # Equivalent to argsort, get the sort index from small to large
    sorted_area_index = sorted(list(range(len(area_list))), key=lambda k : area_list[k])
    min_error = float('inf')
    best_index = -1
    rank_num = 10
    # Traverse the first 10 rectangles with the smallest area, calculate the fitting error, and return the radian with the smallest fitting error
    # find the best angle with correct orientation
    for index in sorted_area_index[:rank_num]:
        rotated = rotate_vertices(vertices, angle_list[index] / 180 * math.pi)
        # Calculate fitting error
        temp_error = cal_error(rotated)
        if temp_error < min_error:
            min_error = temp_error
            best_index = index
    return angle_list[best_index] / 180 * math.pi # Return radian
expand:
-
np. What is the role of meshgrid?
Here NP The function of meshgrid is to indicate the position of spaced pixels. Specific examples are as follows:
a = np.arange(0, 16, 4)			# array([ 0,  4,  8, 12])
x, y = np.meshgrid(index, index)
print(x)
"""
array([[ 0,  4,  8, 12],
       [ 0,  4,  8, 12],
       [ 0,  4,  8, 12],
       [ 0,  4,  8, 12]])
"""
print(y)
"""
array([[ 0,  0,  0,  0],
       [ 4,  4,  4,  4],
       [ 8,  8,  8,  8],
       [12, 12, 12, 12]])
"""
It can be seen that the matrix corresponding to (x, y) is the index corresponding to each pixel. The image obtained according to the index is equivalent to the down sampling operation of 1 / 4 of the original image, which may cause certain information loss;
-
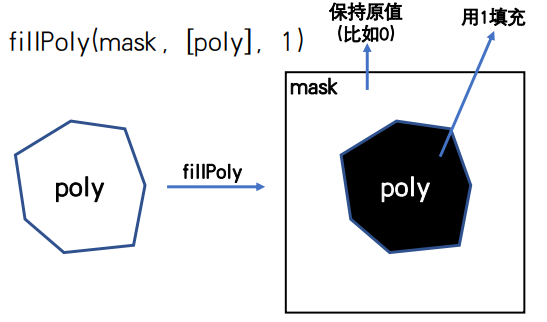
cv2. The role of fillpoly?
It is used to process the mask part in the image and modify it to the specified value. The following figure is the schematic diagram:
summary
Here ICDAR_ The data of 2015 has finally been processed. This data processing is for the use of EAST model. If other text detection models are used, other data processing needs to be done; As can be seen from the whole code, the workload of data processing is very large, and many detailed problems will be encountered. If something goes wrong, it will lead to label errors. The whole task is done in vain! (in the field of AI, there is a saying: data is the cornerstone and upper limit of AI)
In fact, in daily work, data processing often accounts for a large part of the time of Algorithm Engineers. How to process data according to business scenarios is the most critical step; As for the model selection, the change is often small, and the most cumbersome and time-consuming step is data processing!
Therefore, as an algorithm engineer, understanding of data and business scenarios and basic image processing are necessary skills.