brief introduction
The scenario introduces how to visually configure the data of student achievement through AnalyticDB, generate the large screen and dashboard of student achievement distribution with one click, and produce the achievement report by cycle through task arrangement.
relevant
Experience Lab
Developers master what and how of cloud computing through scenario experiments. Free cloud resources, real cloud environment and rich practice scenes
Address: https://developer.aliyun.com/adc/labs/
background information
Database lab is a one-stop database experience hall built by DMS. DMS database lab provides free database products for students, developers and other Alibaba cloud users,
In the database laboratory, you can open many different types of databases for free at the same time, and explore and use the database.
Log in to DMS database lab
1. Log in to the database lab DMS database lab.
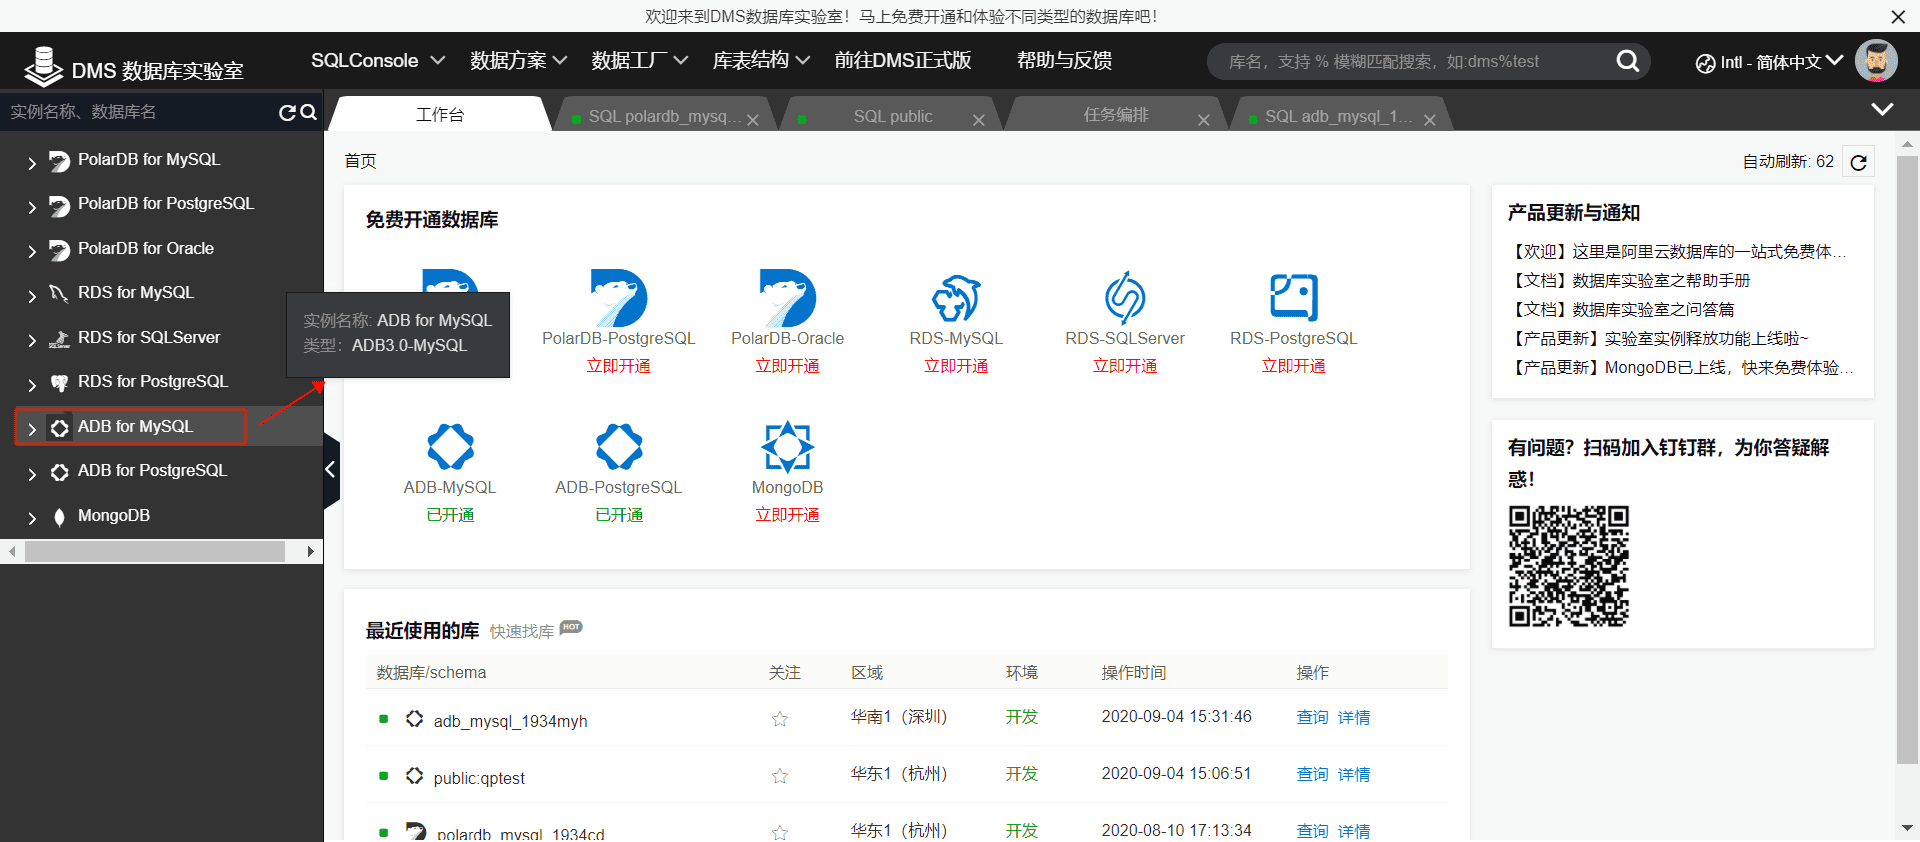
2. On the homepage of DMS data lab, select ADB 3 0-mysql, click ADB 3.0 0-mysql free database engine: ADB 3.0 0-MySQL.
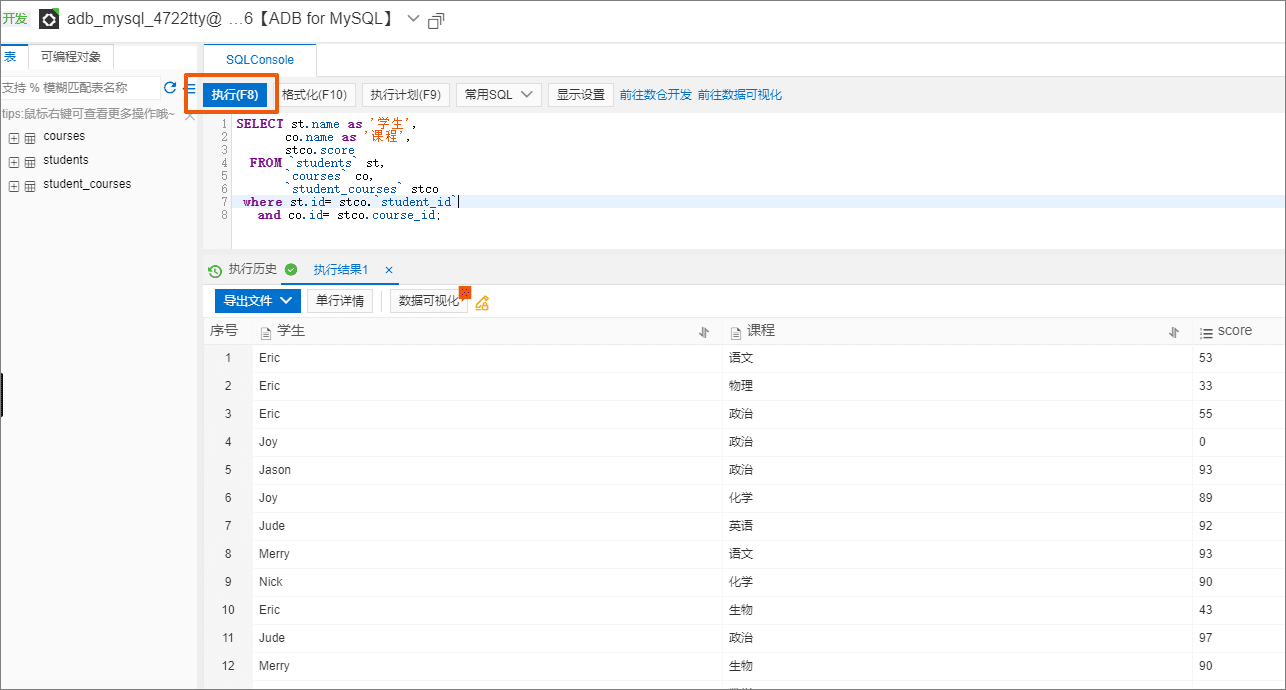
3. Click ADB for MySQL on the left to enter SQLConsole.
4. Enter the following in the SQLConsole window and click execute.
SELECT st.name as 'student',
       co.name as 'curriculum',
       stco.score
  FROM `students` st,
       `courses` co,
       `student_courses` stco
 where st.id= stco.`student_id`
   and co.id= stco.course_id
As shown in the figure below.
Data visualization
DMS provides users with the ability of database data management. At the same time, it provides users with the way to query data in the form of tables through the SQL Console. However, for the scenarios that need to find business characteristics by analyzing data, such as analyzing trend, growth comparison and so on, a simple table can not meet the requirements, and the data needs to be visualized to support similar scenarios. Therefore, DMS provides a visualization module, so that users can more easily insight into the business through data and assist in business decision-making.
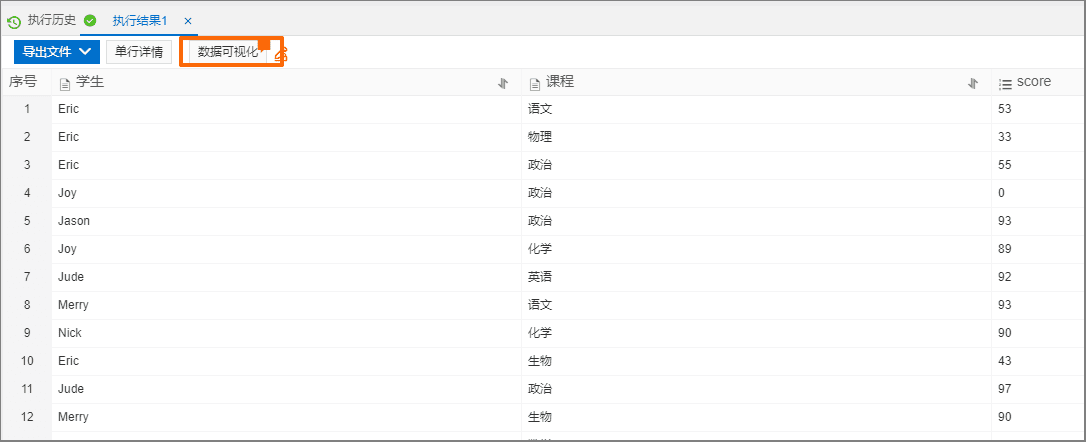
1. In the execution result window, click data visualization.
2. In the data visualization window, click Configure chart.
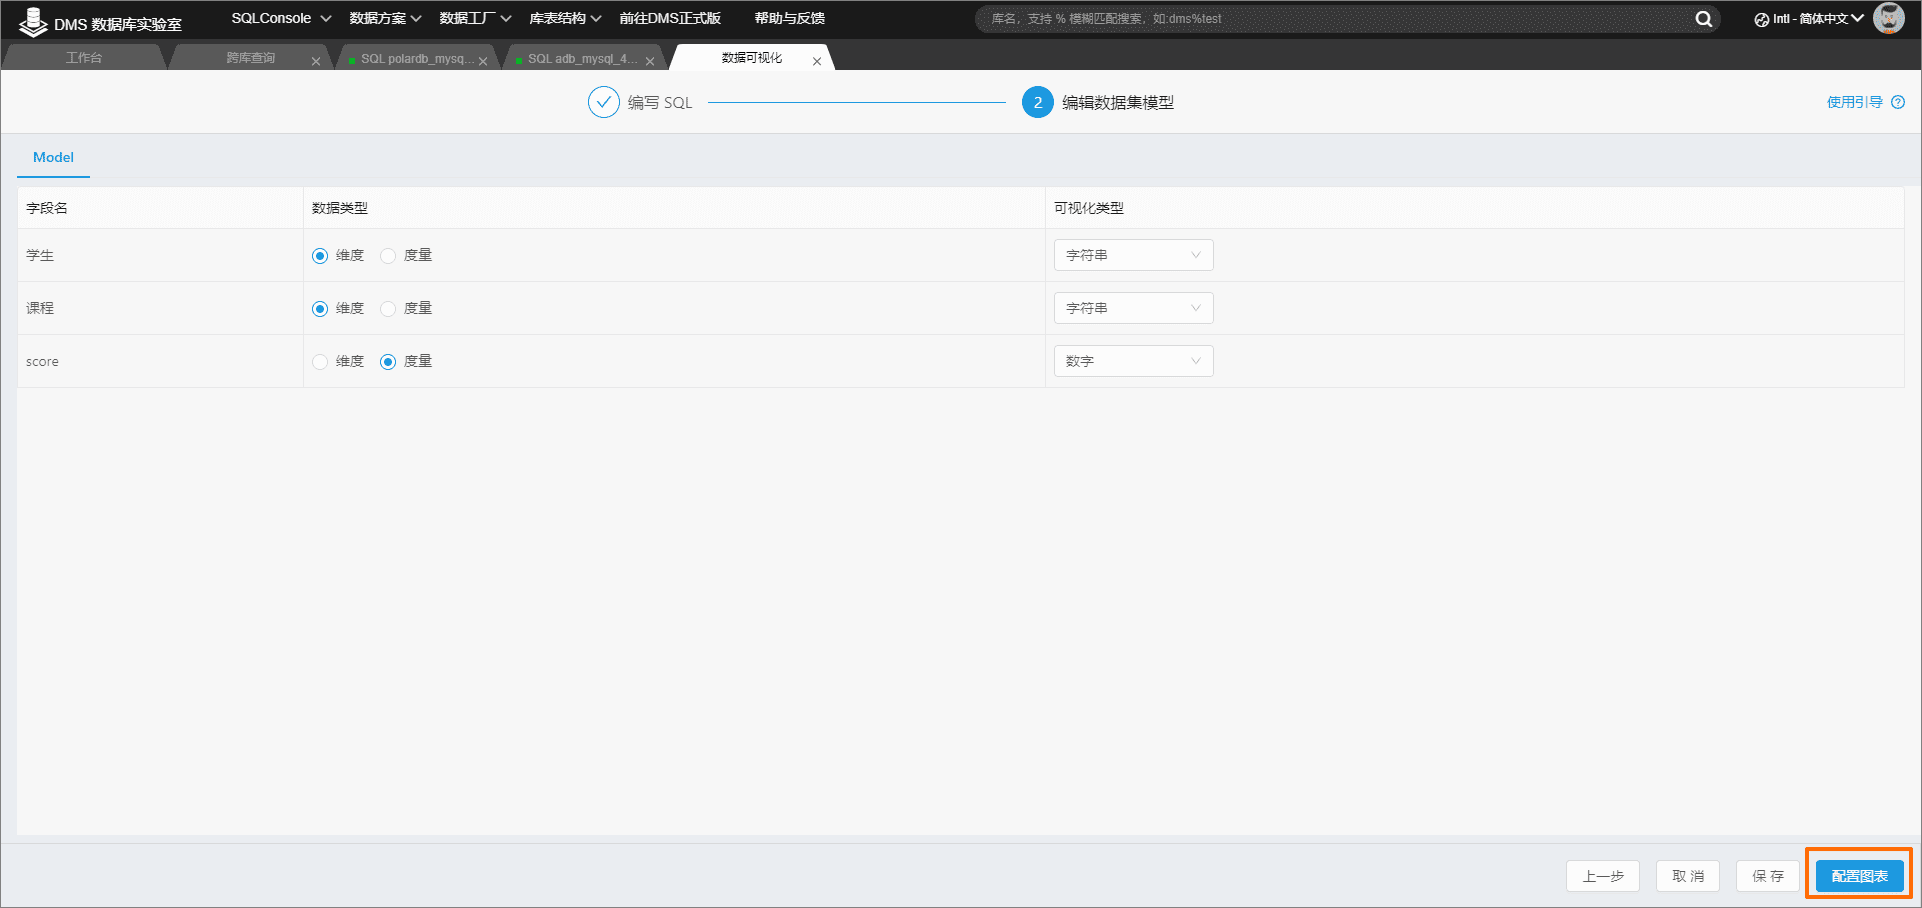
3. Configure the visualization chart according to the following steps.
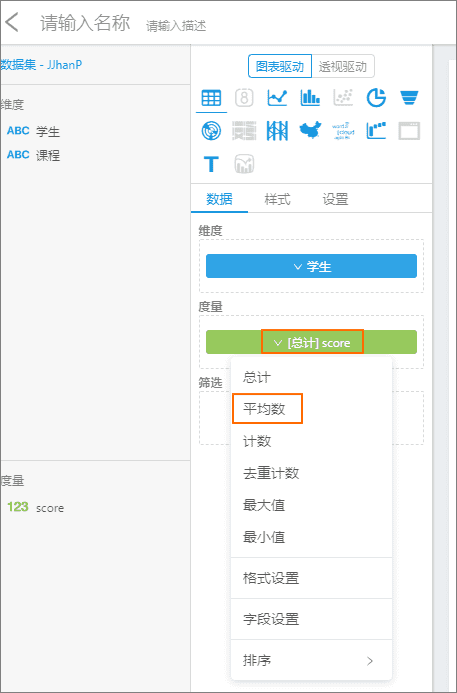
a. Configure the data according to the information in the figure below.
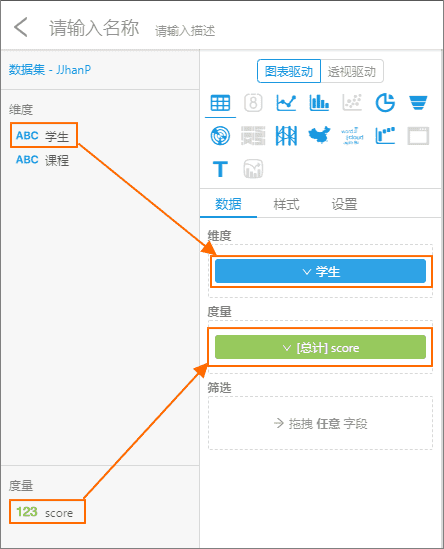
b. Click the measure field to adjust the total to average.
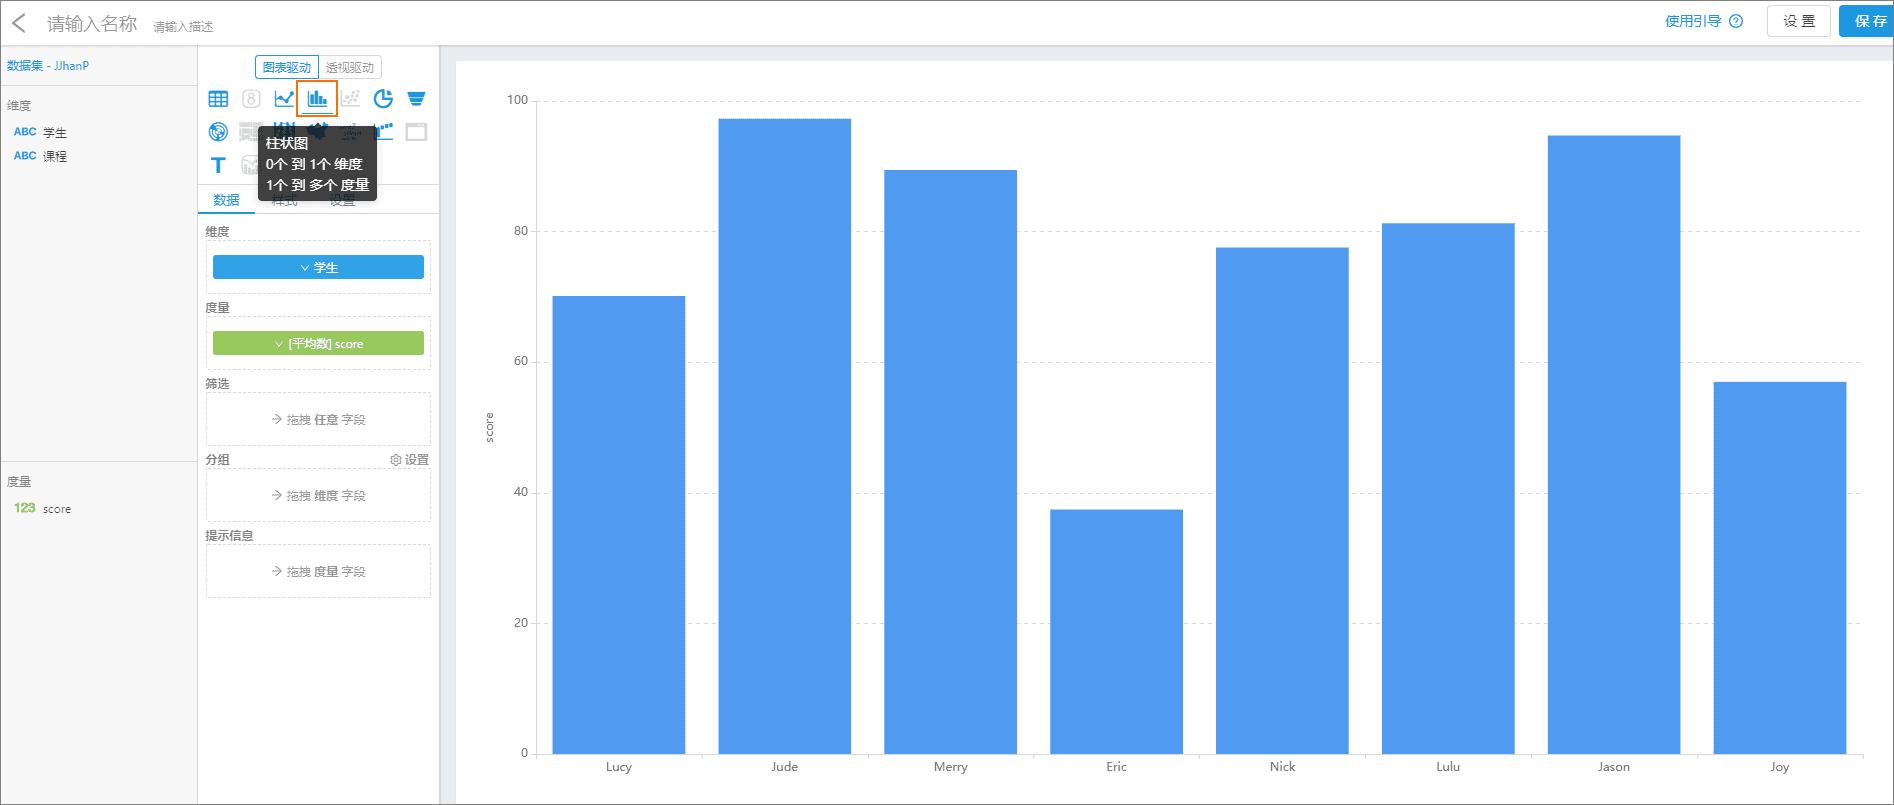
c. Click the histogram.
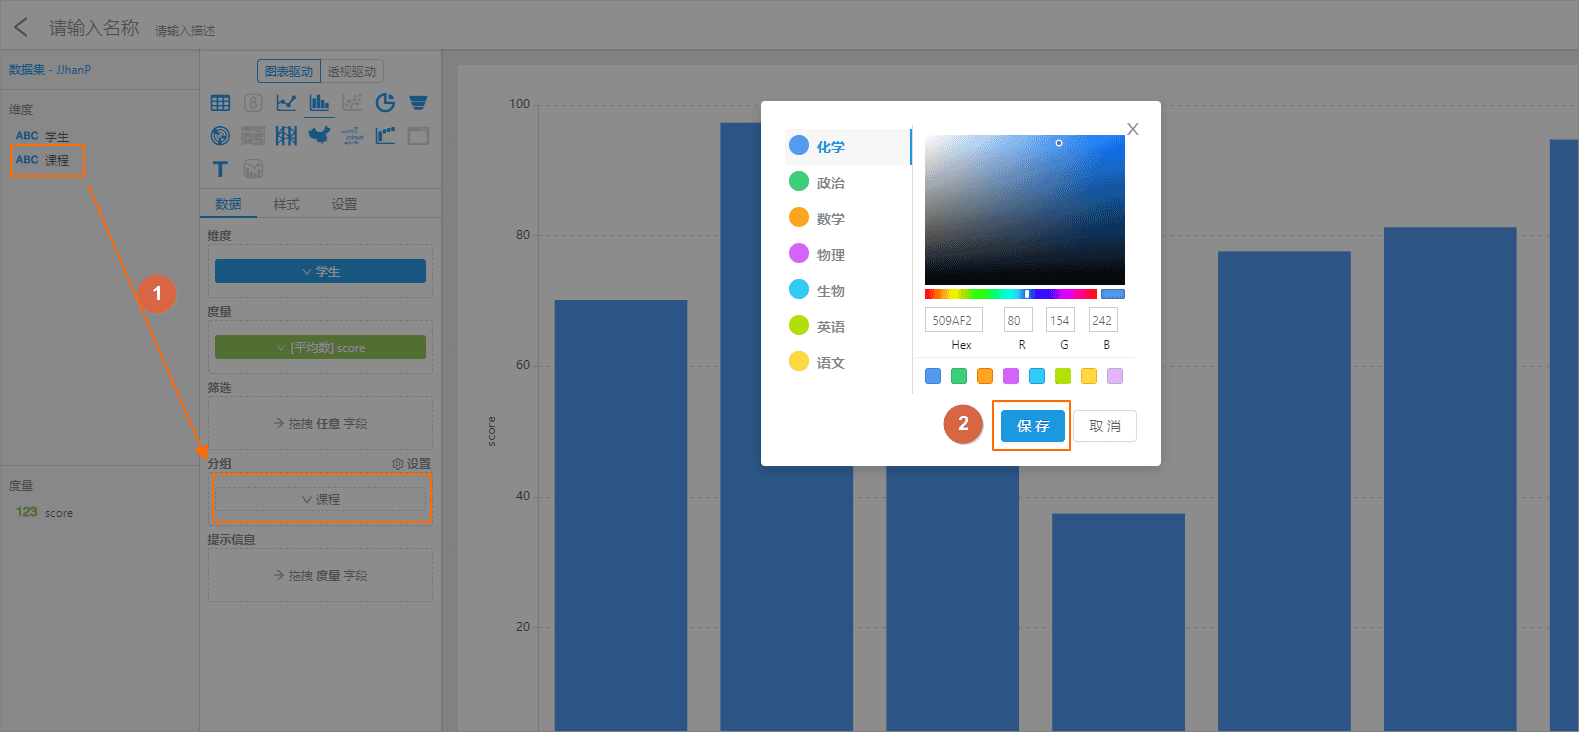
d. Click the course and drag it to the group box. Then click save in the pop-up dialog box.
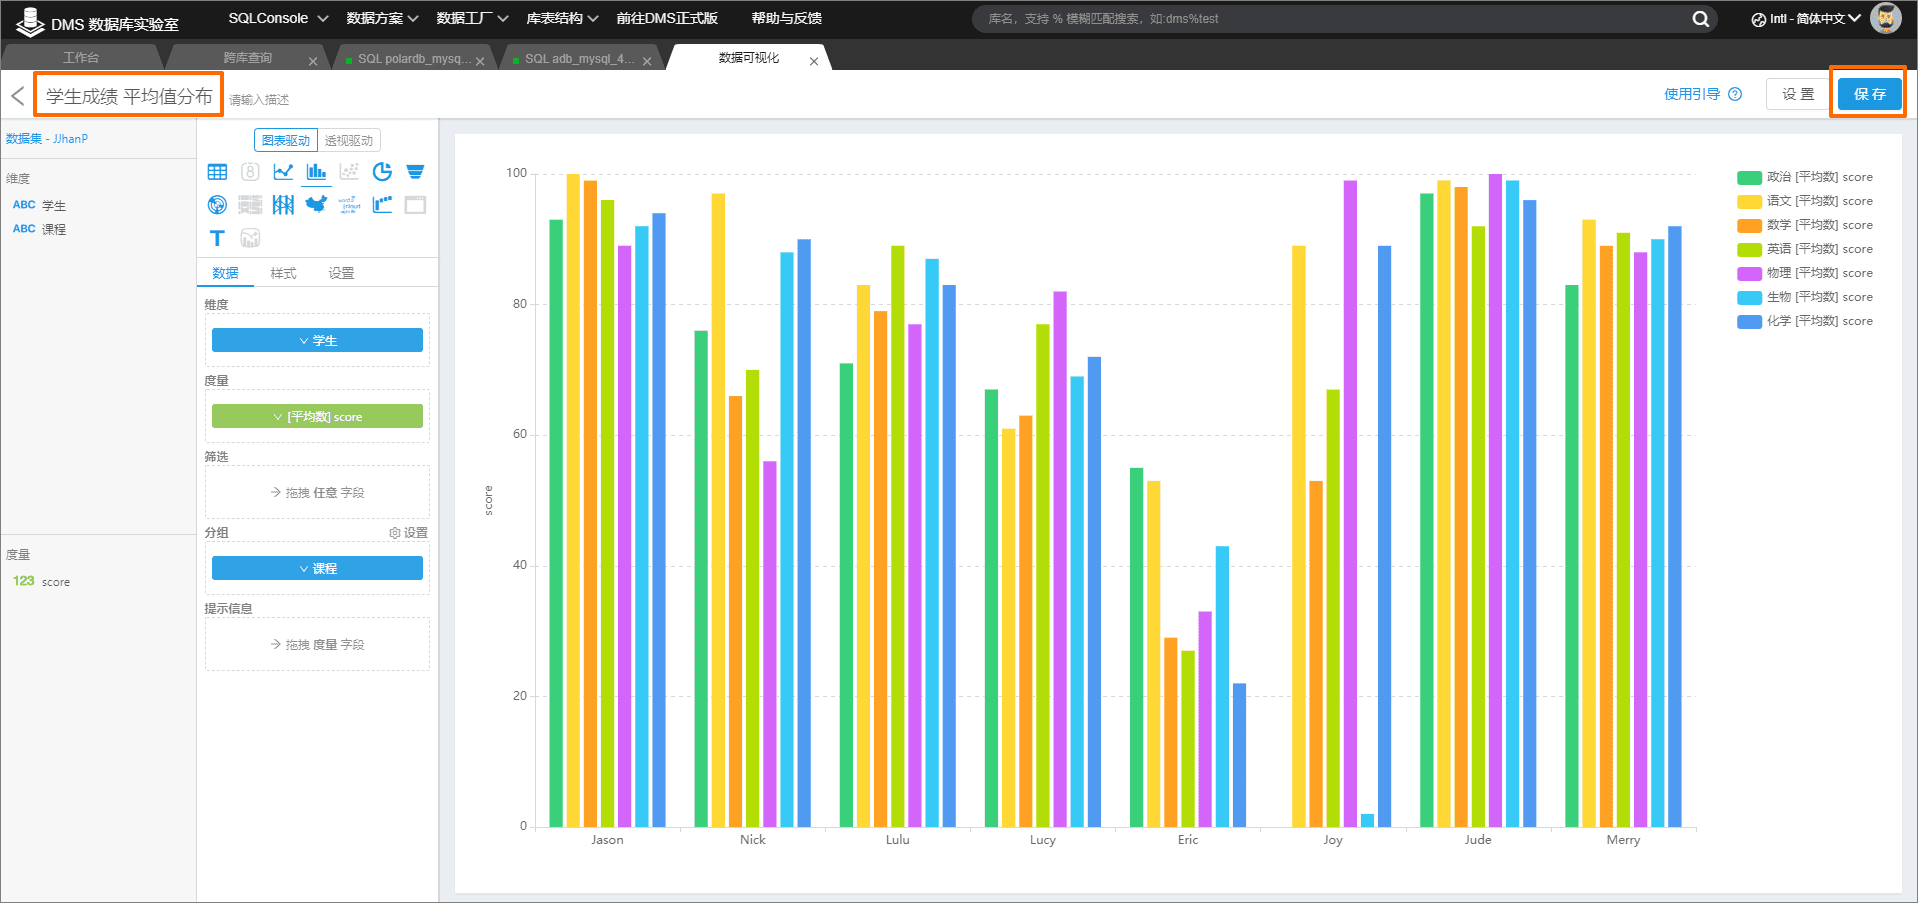
4. Enter the chart name and click the right to save.
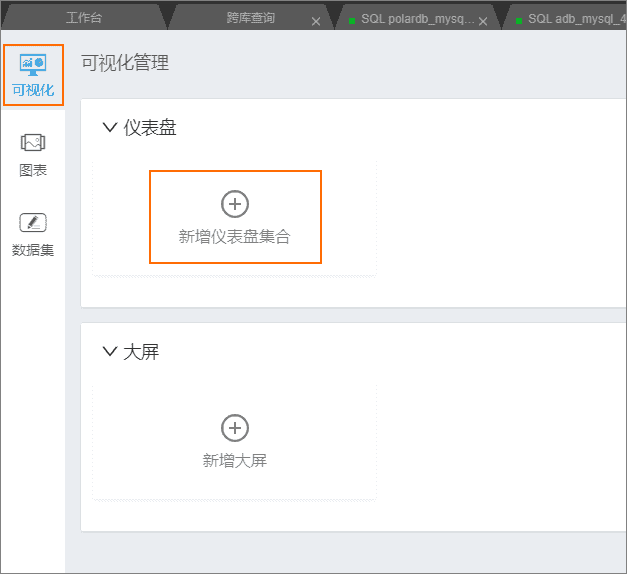
Add dashboard collection
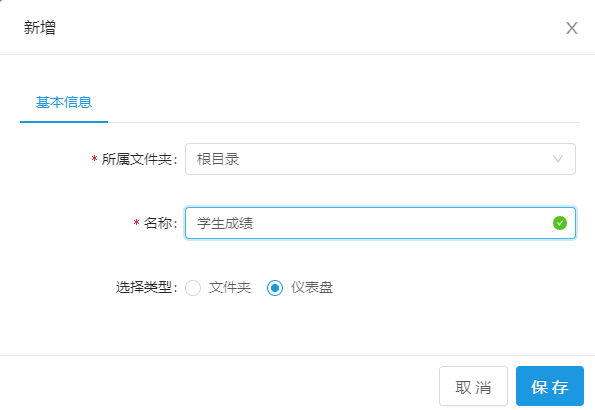
1. Click visualization on the left, and then click Add dashboard set.
Enter a name for the dashboard and click save.
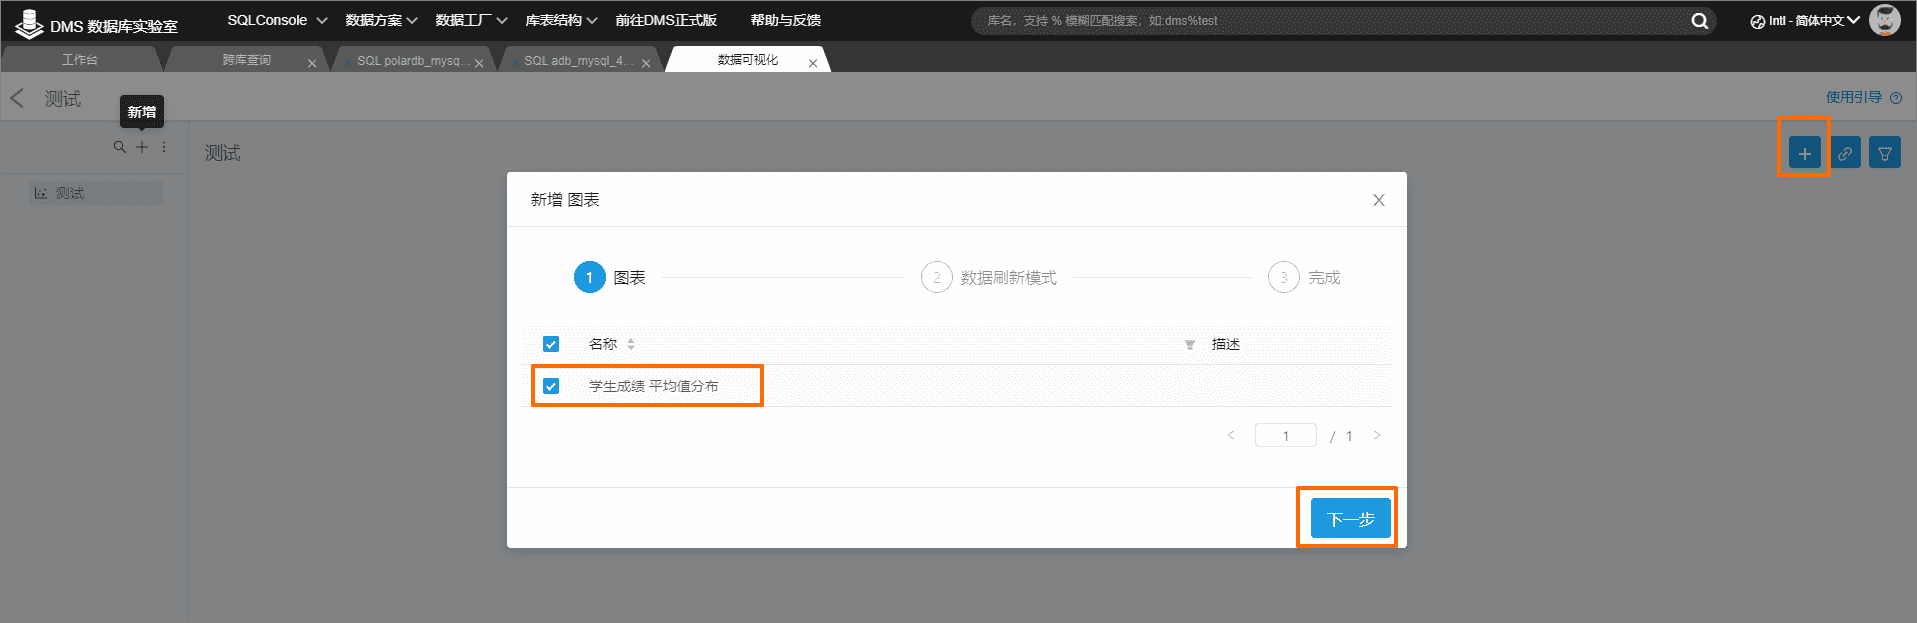
2. Click the newly created dashboard set, and then click "please create folder or dashboard" in the page to add a layer.
3. Click the + sign in the upper right corner, and then import the created chart.
4. In the visual interface, you can view the score distribution of specific individual subjects by selecting different courses.
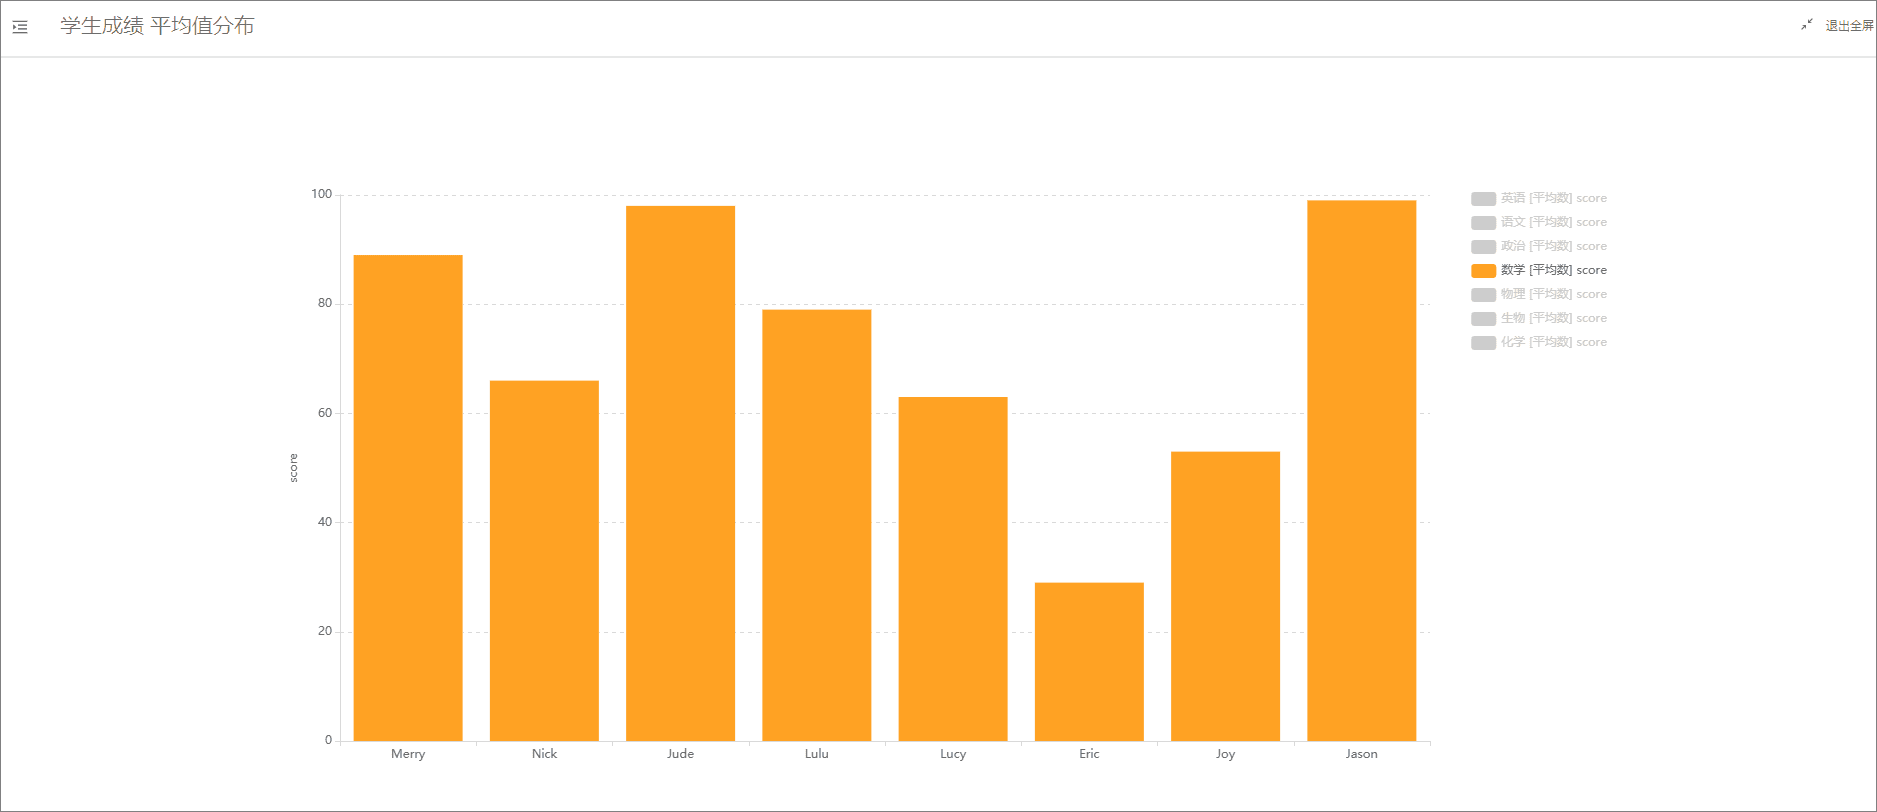
At this point, the data visualization operation is completed.
Arrange tasks
1. Log in to the database lab

2. On the homepage of DMS data lab, on the homepage of DMS data lab, select ADB PostgreSQL, and click ADB PostgreSQL to open the database engine for free: ADB PostgreSQL.
3. Click ADB for PostgreSQL on the left to enter SQLConsole.
4. Enter the following in the SQLConsole window and click execute.
CREATE TABLE "public"."student_new_courses"
(sname varchar(32) DEFAULT 'NULL::character varying',
cname varchar(32) DEFAULT 'NULL::character varying',
score integer,
gmt_create timestamp without time zone
) WITH(FILLFACTOR= 100, OIDS= FALSE) ;

COMMENT ON COLUMN "public" . "student_new_courses" . "sname" IS 'student' ;
COMMENT ON COLUMN "public" . "student_new_courses" . "cname" IS 'curriculum' ;
COMMENT ON COLUMN "public" . "student_new_courses" . "score" IS 'Examination results' ;
COMMENT ON COLUMN "public" . "student_new_courses" . "gmt_create" IS 'Statistical time' ;
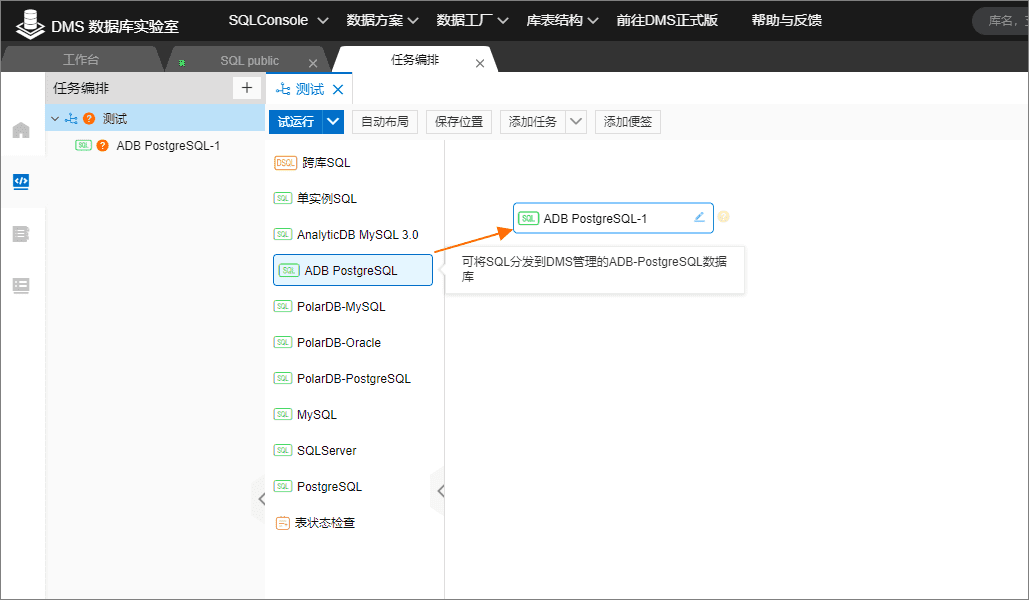
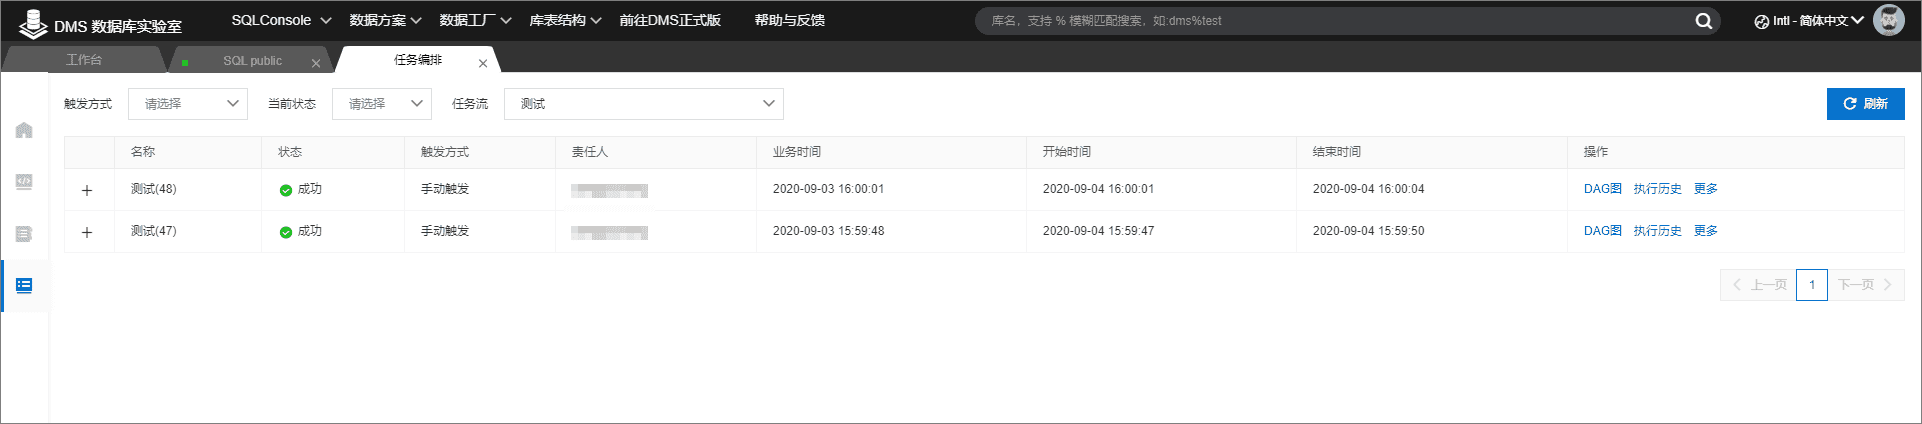
5. Click data factory > task arrangement to enter the task arrangement window.
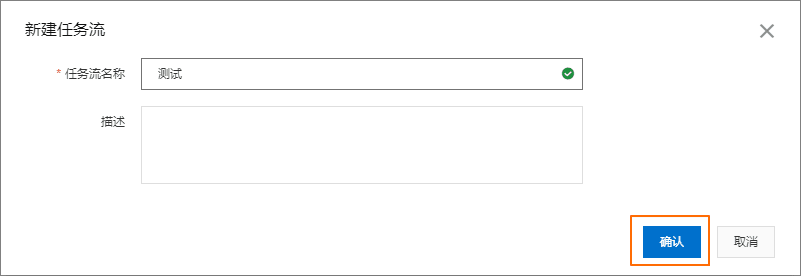
6. Click new task flow, enter the task flow name in the dialog box, and then click OK.
7. Drag and drop to add an ADB PostgreSQL task node.
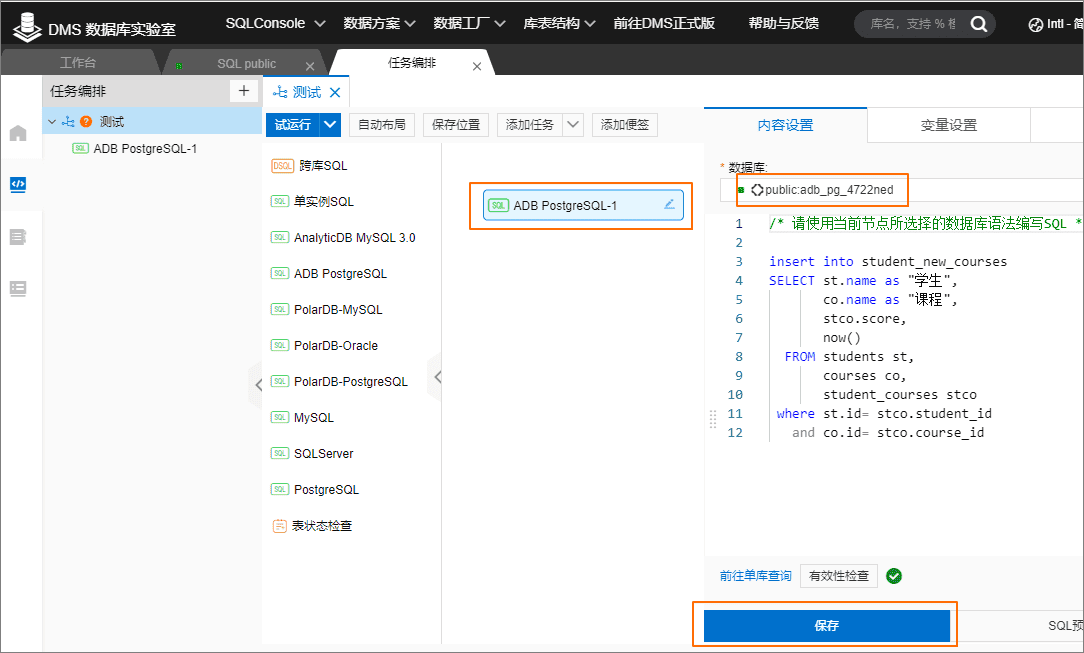
8. Click the ADB PostgreSQL node, and then add the following SQL in the content setting on the right.
insert into student_new_courses
SELECT st.name as "student",
       co.name as "curriculum",
       stco.score,
       now()
FROM students st,
     courses co,
     student_courses stco
where st.id= stco.student_id
    and co.id= stco.course_id
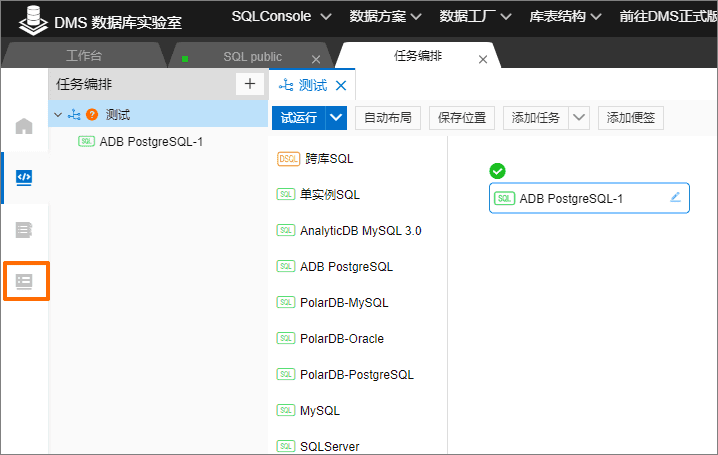
9. Click commissioning.
The results are as follows.
10. After the operation is successful, click the operation and maintenance center on the left to view the execution log.
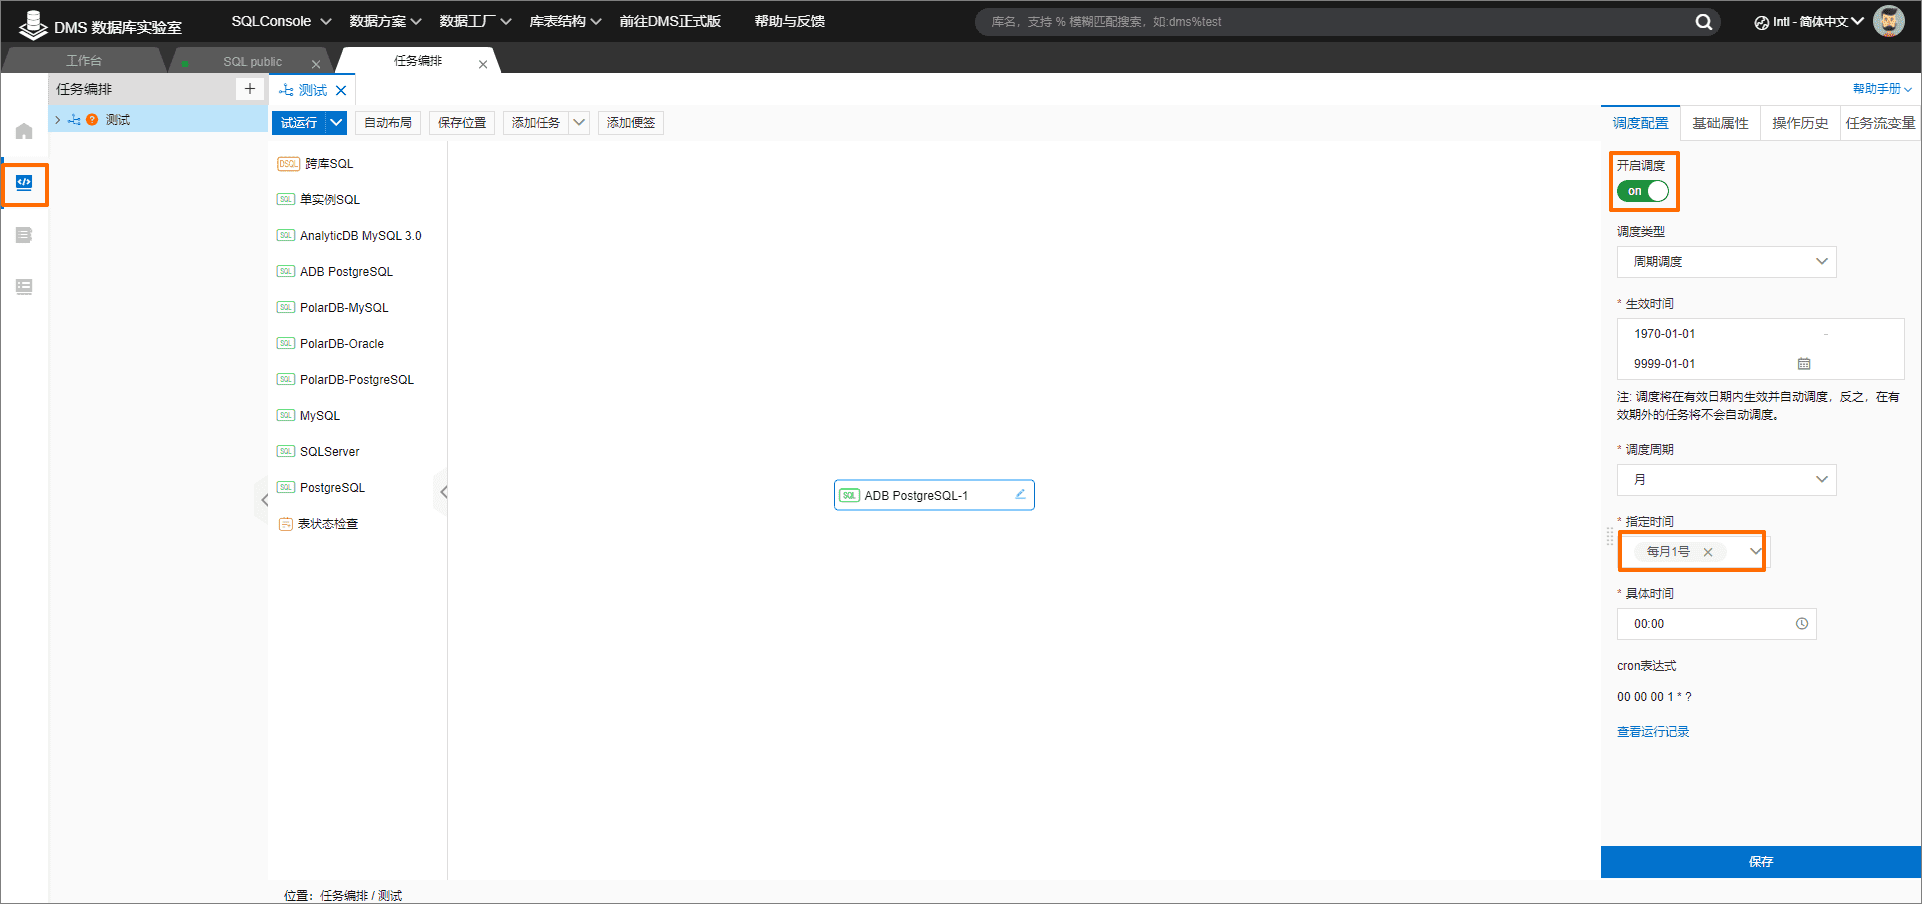
11. Return to the development space. In scheduling configuration, enable scheduling.
12. Set the scheduling time as the 1st day of each month and click save.