Crash Log
There are two main sources of Crash Log:
- What Apple provides can be copied directly from the user's device or downloaded from iTunes Connect (XCode)
- Three-party or self-research Framework statistics, three-party services including Fabric, Bugly and so on.
The Crash Log mentioned in this article is provided by Apple.
Obtain
Equipment acquisition
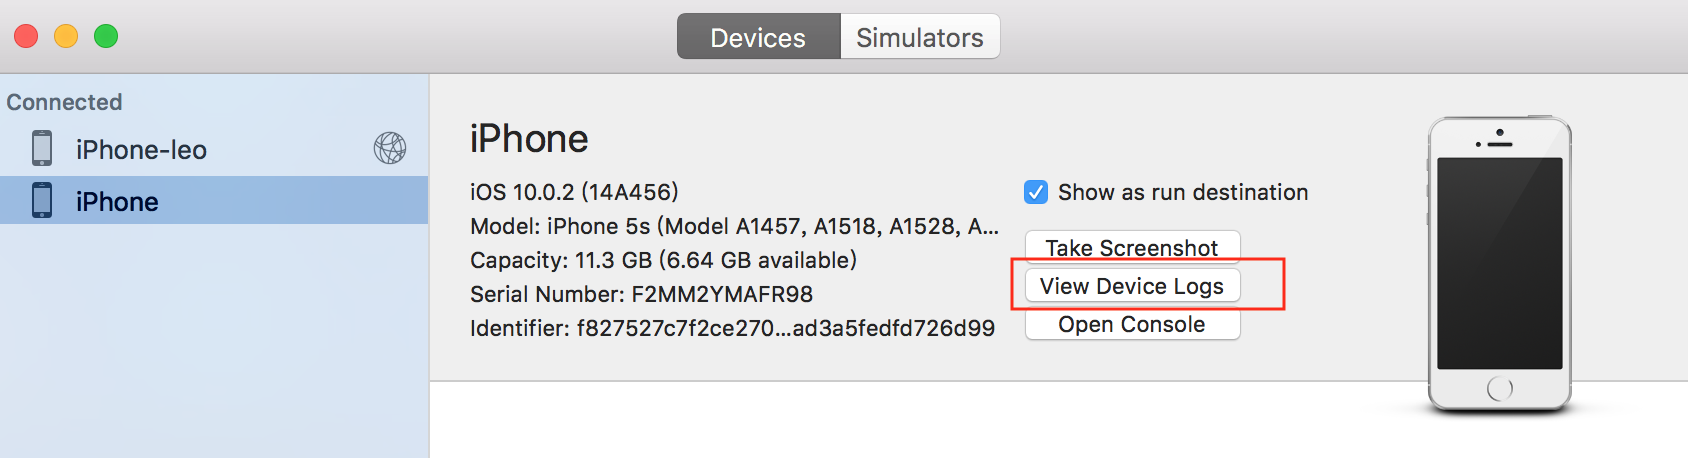
USB Connect Devices, then select Windows - > Devices and Simulators in the XCode menu bar, and then select View Device Logs
Then, wait for XCode to copy Crash Log. In the upper right corner, you can search by App's name. For example, here I search for Wechat. You can export Crash Log to local analysis by right-clicking:
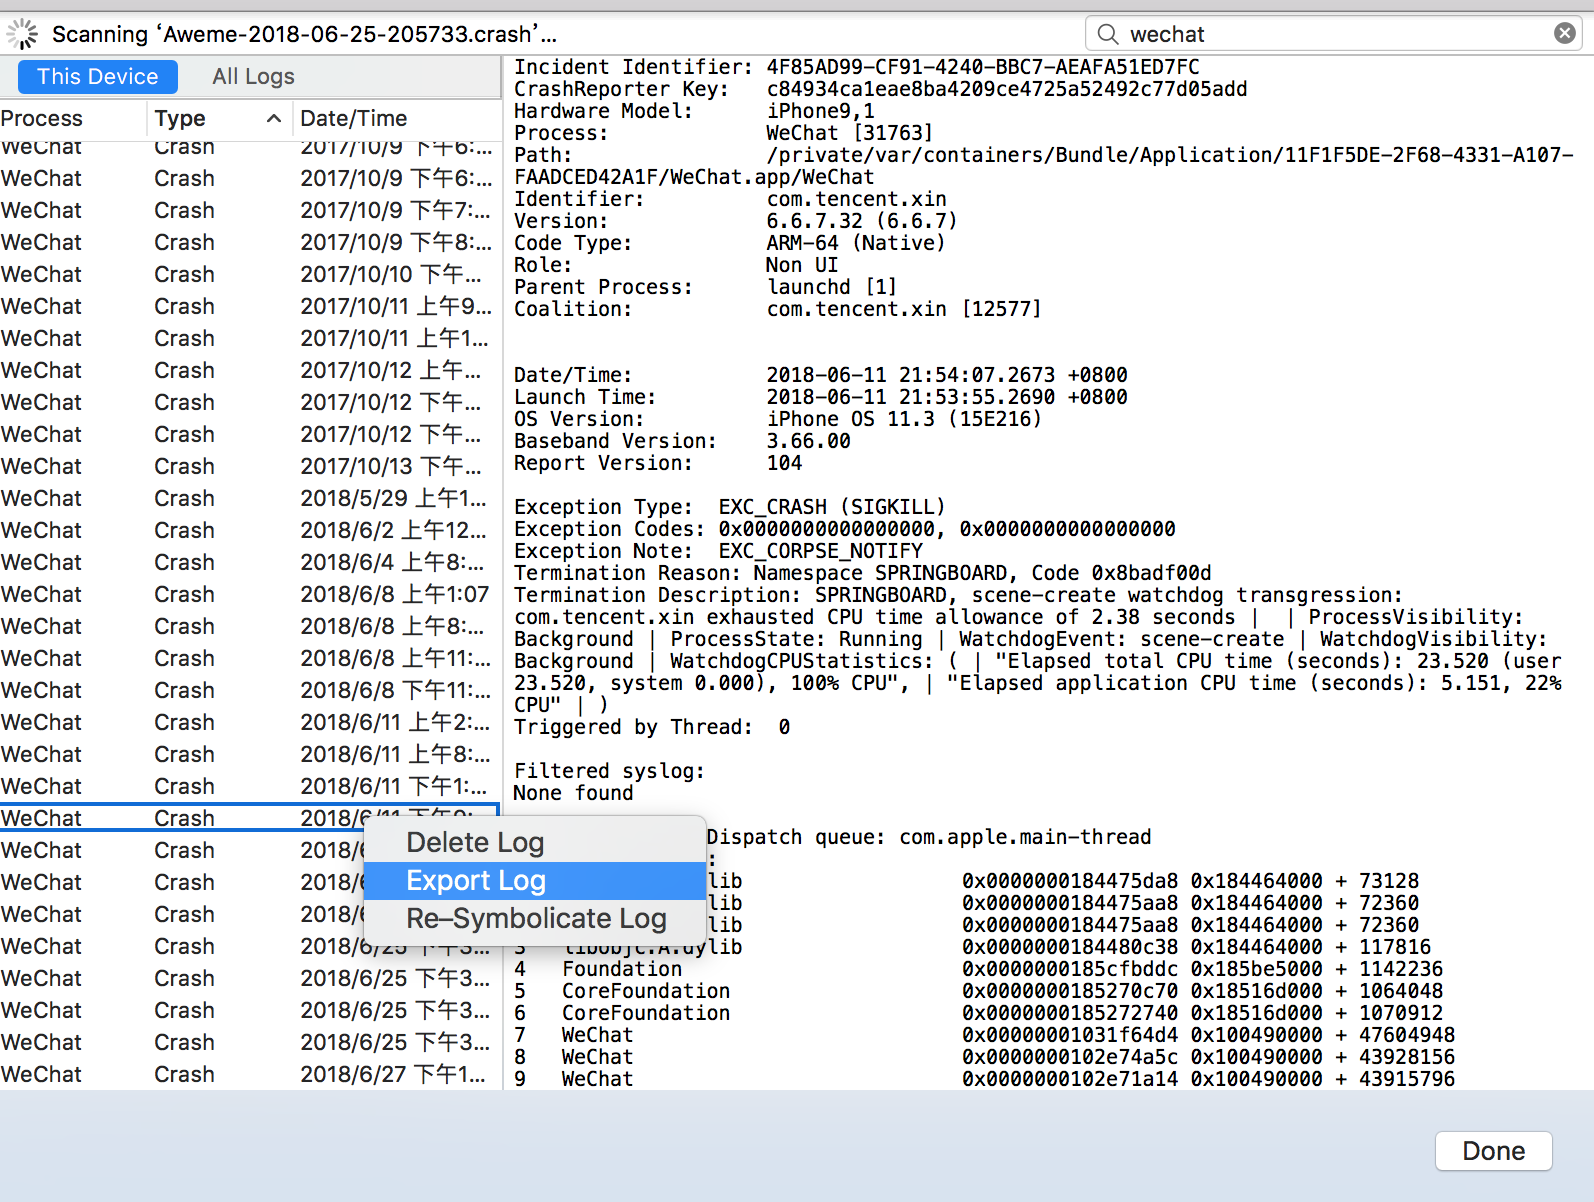
When viewing Crash Log, XCode will automatically try Symboliate, and what is Symboliate will be explained later in this article.
XCode Download
Select Window - > Organizer in the XCode menu bar and switch to Crashes Tab. After selecting the version, you can automatically download the corresponding version of crash log:
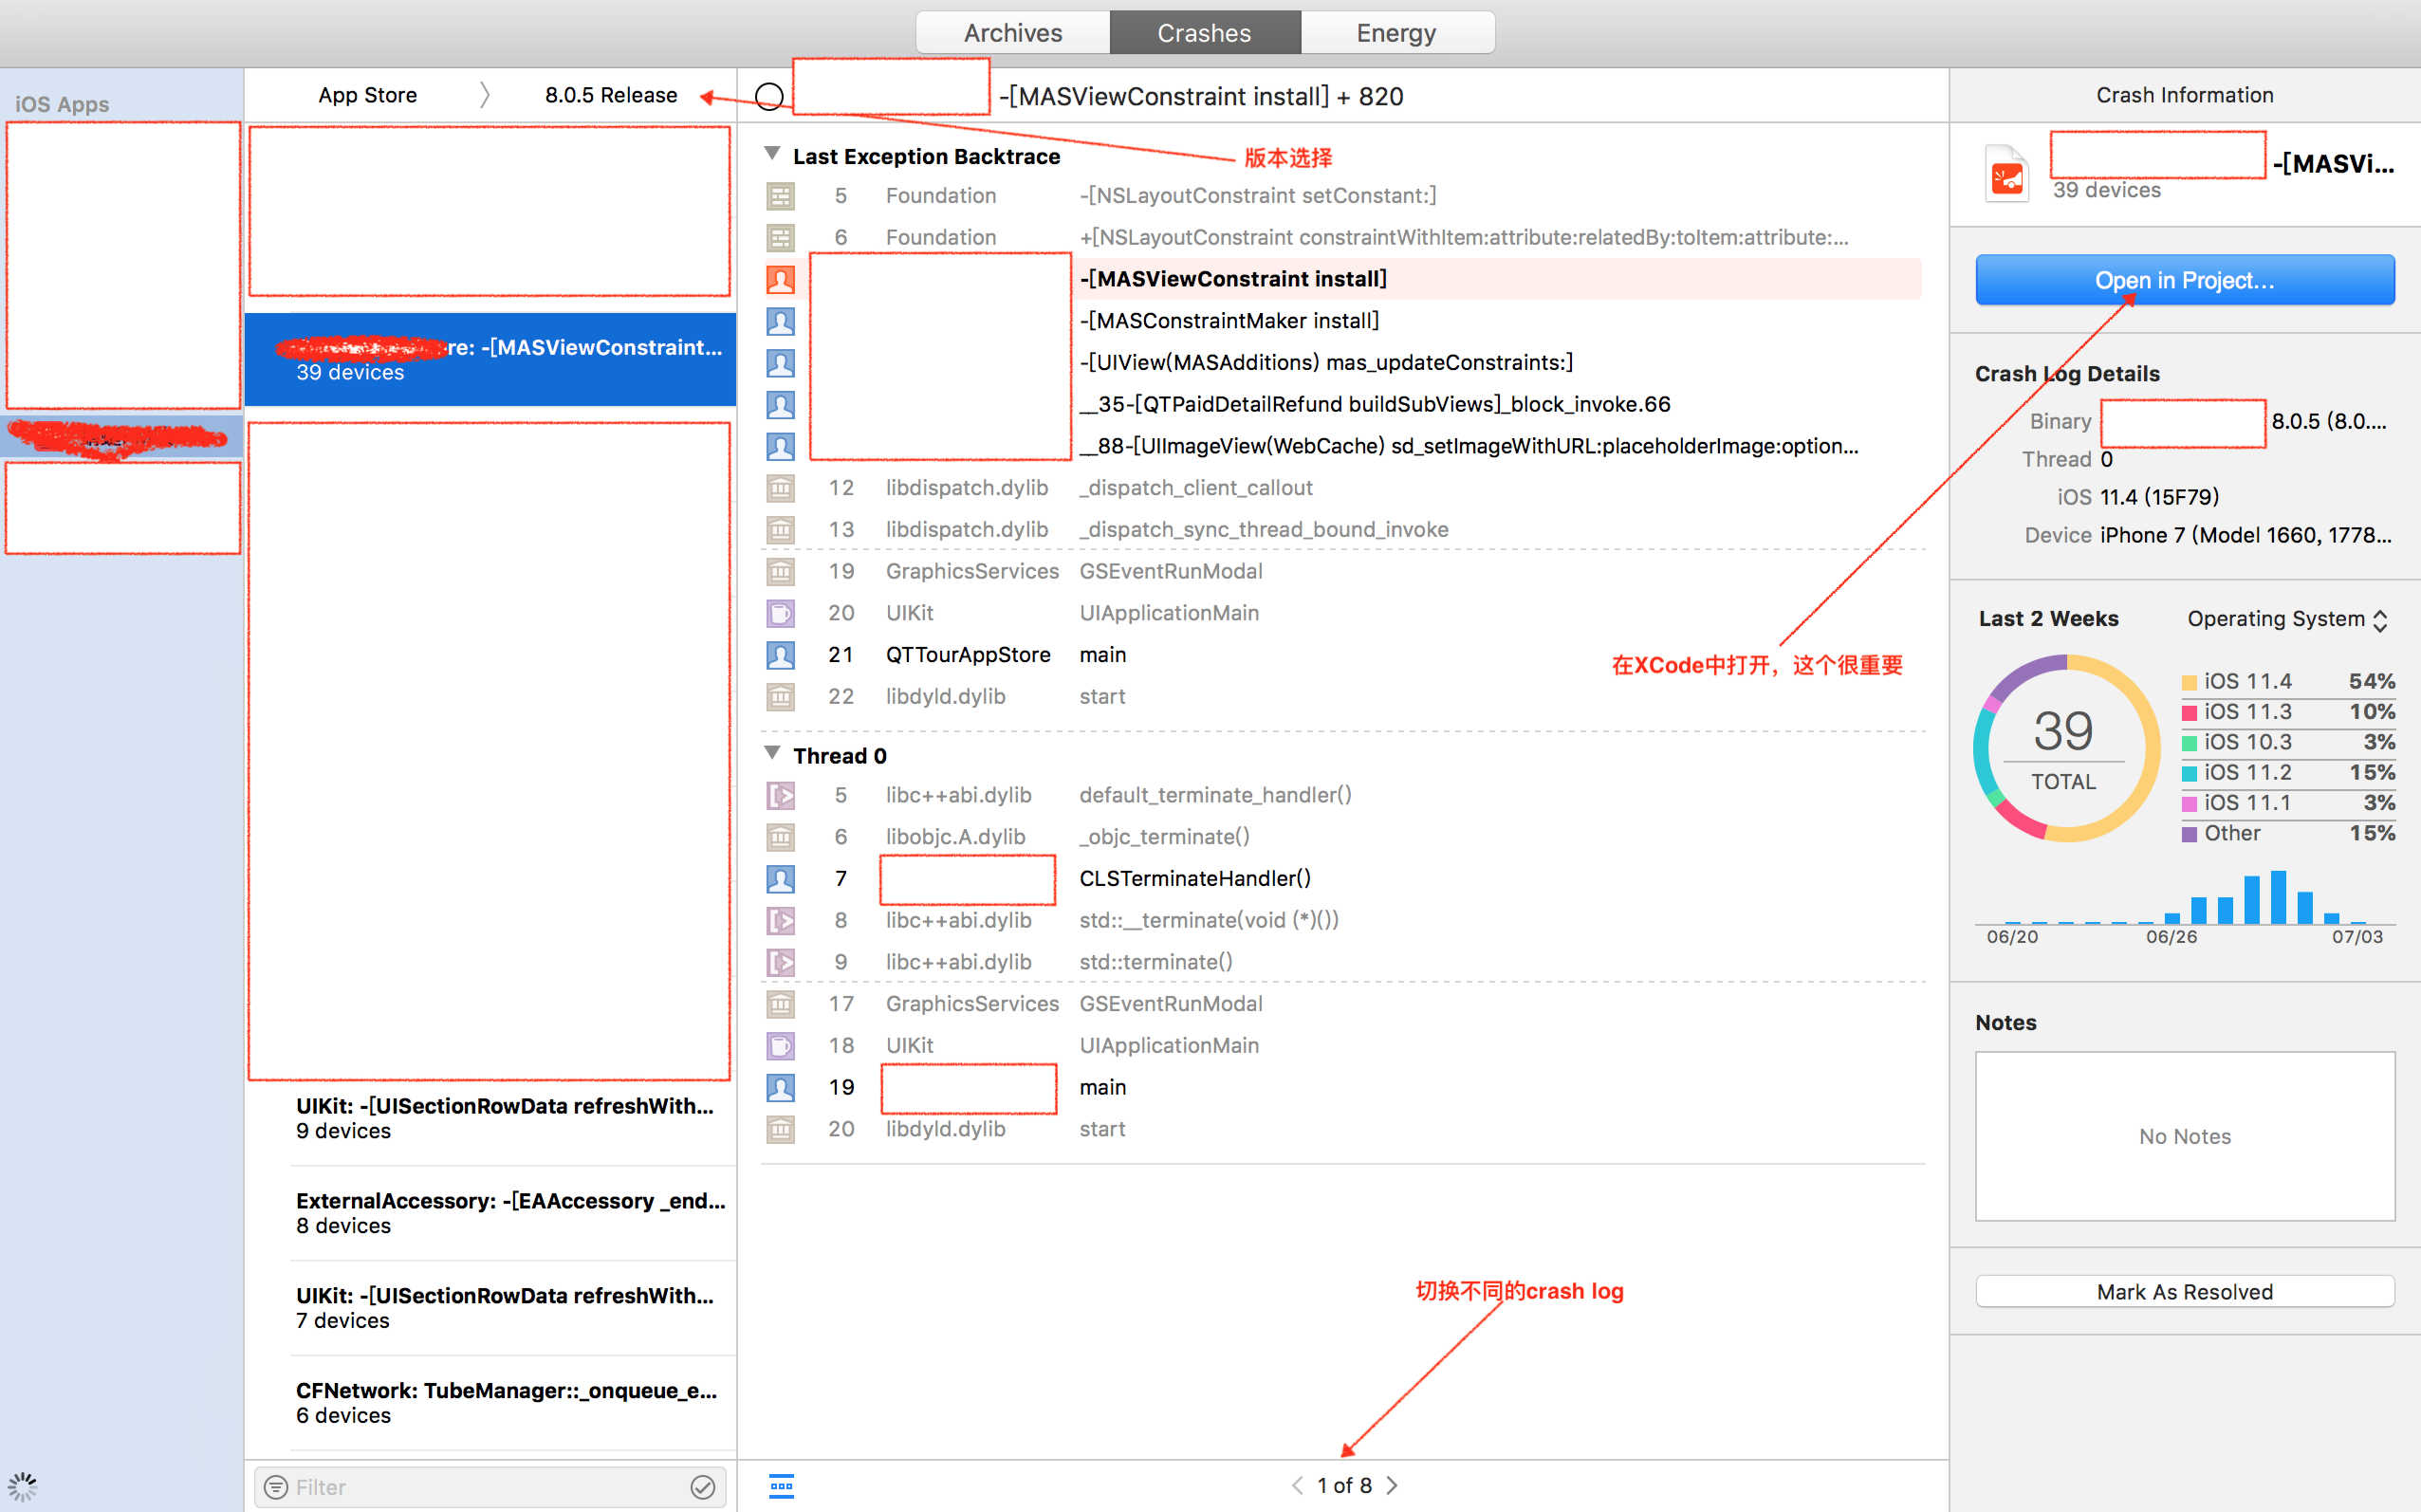
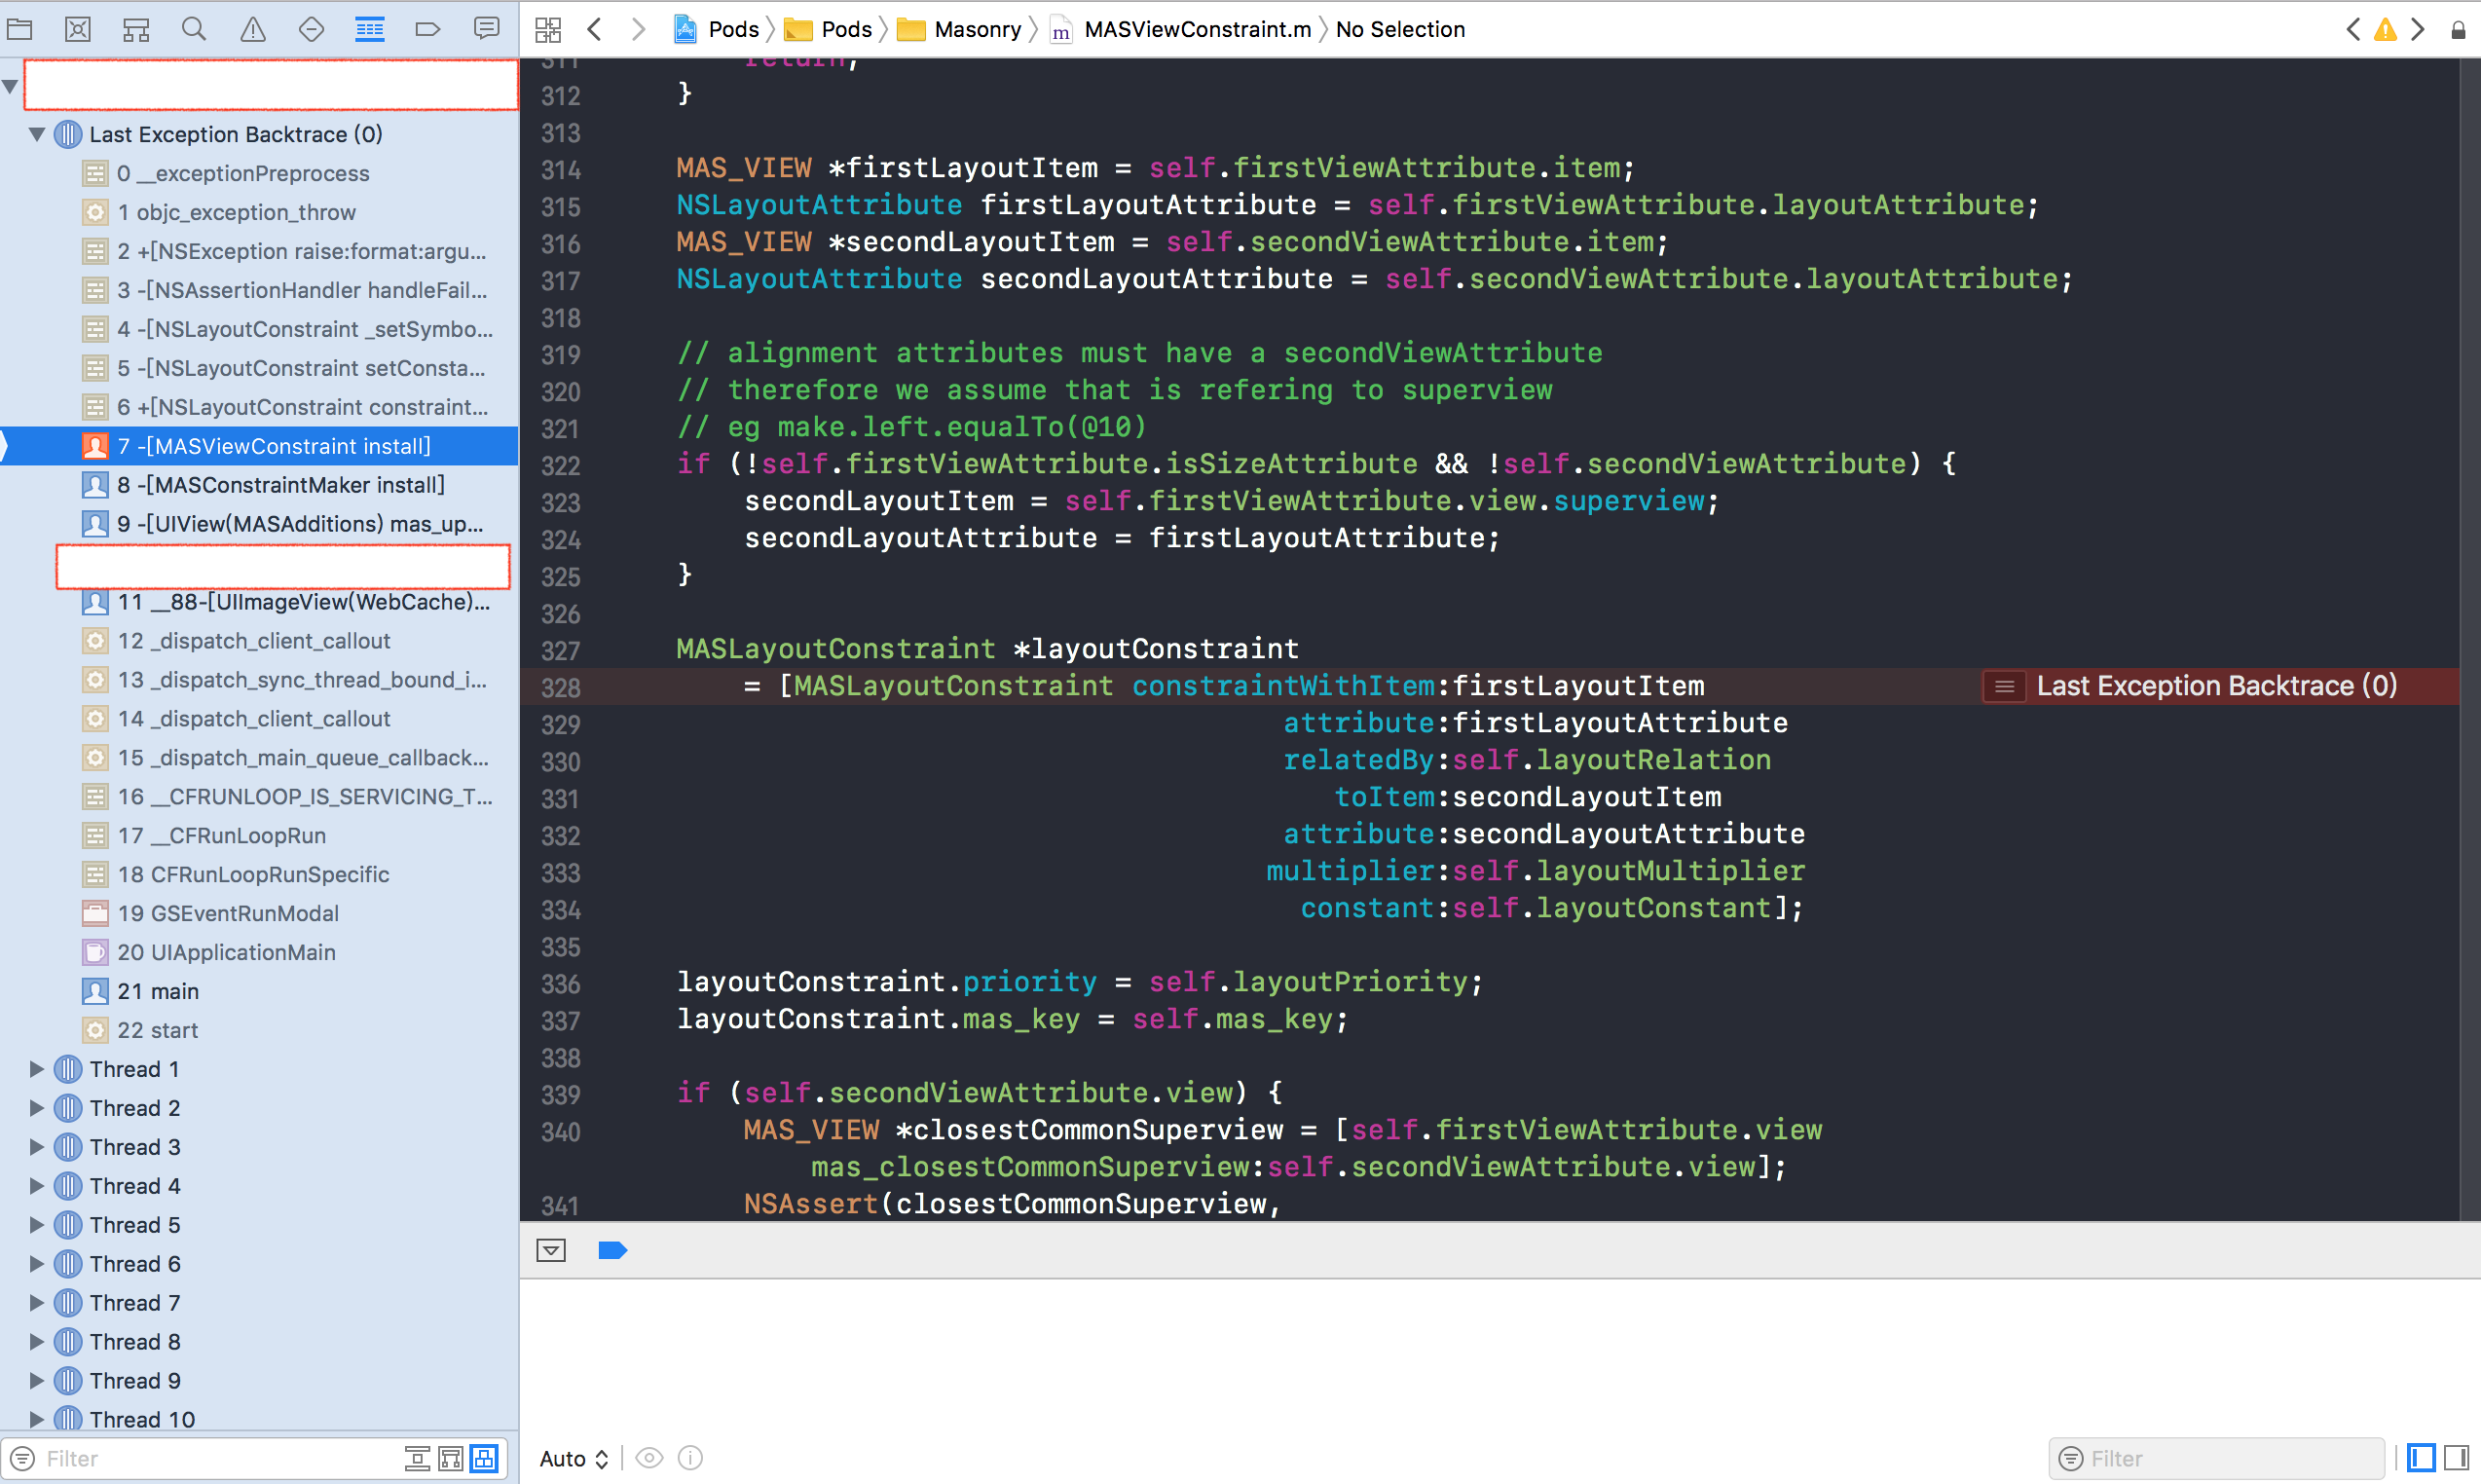
Select Open In Project, then select the corresponding project, and then the familiar interface in our daily development:
Analysis
For Demo, Crash Log is a Wechat:
- WeChat-2018-6-11-21-54.crash
- Device information: iPhone 7, iOS 12 beta 1
- Version information: Wechat 6.6.7.32 (6.6.7)
Header
Crash Log starts with a header, which contains metadata for the log:
//Unique identifier of crash log
Incident Identifier: 4F85AD99-CF91-4240-BBC7-AEAFA51ED7FC
//The crash log of the same device is the same as the processed device identifier.
CrashReporter Key:   c84934ca1eae8ba4209ce4725a52492c77d05add
Hardware Model:      iPhone9,1
Process:             WeChat [31763]
Path:                /private/var/containers/Bundle/Application/11F1F5DE-2F68-4331-A107-FAADCED42A1F/WeChat.app/WeChat
Identifier:          com.tencent.xin
Version:             6.6.7.32 (6.6.7)
Code Type:           ARM-64 (Native)
Role:                Non UI
Parent Process:      launchd [1]
Coalition:           com.tencent.xin [12577]


Date/Time:           2018-06-11 21:54:07.2673 +0800
Launch Time:         2018-06-11 21:53:55.2690 +0800
OS Version:          iPhone OS 11.3 (15E216)
Baseband Version:    3.66.00
Report Version:      104
Reason
Then there is the Cause of Collapse Module:
Exception Type:  EXC_CRASH (SIGKILL)
Exception Codes: 0x0000000000000000, 0x0000000000000000
Exception Note:  EXC_CORPSE_NOTIFY
Termination Reason: Namespace SPRINGBOARD, Code 0x8badf00d
Termination Description: SPRINGBOARD, scene-create watchdog transgression: com.tencent.xin exhausted CPU time allowance of 2.38 seconds |  | ProcessVisibility: Background | ProcessState: Running | WatchdogEvent: scene-create | WatchdogVisibility: Background | WatchdogCPUStatistics: ( | "Elapsed total CPU time (seconds): 23.520 (user 23.520, system 0.000), 100% CPU", | "Elapsed application CPU time (seconds): 5.151, 22% CPU" | )
Triggered by Thread:  0
Exception Type denotes the type of exception:
Exception Type: EXC_CRASH (SIGKILL)In <mach/exception_types.h>, we can find the specific meaning of EXC_CRASH: abnormal process exit.
#define EXC_CRASH 10 /* Abnormal process exit */So what does SIGKILL mean? In the header file <sys/signal.h>, you can find:
#define SIGKILL 9 /* kill (cannot be caught or ignored) */This means that this is an exception that cannot be captured and ignored, so the system decides to kill the process.
The code in Exception Note can also be found in <mach/exception_types.h>.
#define EXC_CORPSE_NOTIFY 13 /* Abnormal process exited to corpse state */The information provided by Termination Reason is more detailed.
Termination Reason: Namespace SPRINGBOARD, Code 0x8badf00d0x8badf00d is a very common Code, which means that App starts too long or the main thread gets stuck too long, resulting in the system's WatchDog killing the current App.
Thread
Next is the call stack of each thread, and the crashed thread is marked as crashed. For example, the call stack of the main thread is as follows:
Thread 0 name:  Dispatch queue: com.apple.main-thread
Thread 0 Crashed:
0   libobjc.A.dylib                 0x0000000184475da8 0x184464000 + 73128
1   libobjc.A.dylib                 0x0000000184475aa8 0x184464000 +
...
7   WeChat                          0x00000001031f64d4 0x100490000 + 47604948
8   WeChat                          0x0000000102e74a5c 0x100490000 + 43928156
9   WeChat                          0x0000000102e71a14 0x100490000 + 43915796
10  Foundation                      0x0000000185c52d1c 0x185be5000 + 449820
...
16  WeChat                          0x00000001029d0924 0x100490000 + 39061796
...
37  WeChat                          0x00000001005d7e18 0x100490000 + 1343000
38  libdyld.dylib                   0x0000000184c09fc0 0x184c09000 + 4032
You can see that the descriptive information here is addressed 0x0000102e74a5c 0x100490000 + 43928156. We can only find the problem by converting them into classes / methods in the code, which is what we will talk about next.
register
After a stack of thread calls, you can also see the register status of Crash:
Thread 0 crashed with ARM Thread State (64-bit):
    x0: 0x00000001b76acea0   x1: 0x000000018fbd3fbd   x2: 0x000000010cb17260   x3: 0x0000000000000001
    x4: 0x0000000000000000   x5: 0x0000000000000001   x6: 0x0000000000000020   x7: 0x0000000000000004
    x8: 0x0000000109a34380   x9: 0x0000000109a34310  x10: 0x0000000109a34311  x11: 0x0000000109a34318
   x12: 0x000000010c8e3cb0  x13: 0x0000000000000000  x14: 0x0000000000000000  x15: 0x000000018fbd49dd
   x16: 0x00000001b76acea0  x17: 0x0000000000000000  x18: 0x0000000000000000  x19: 0x000000018fbd3fbd
   x20: 0x0000000109a34318  x21: 0x0000000109a34388  x22: 0x00000001b766cfd0  x23: 0x0000000000000000
   x24: 0x00000001b76acea0  x25: 0x0000000000000000  x26: 0x00000001b766e000  x27: 0x00000000ffed8282
   x28: 0x0000000000000000   fp: 0x000000016f969e90   lr: 0x0000000184475aa8
    sp: 0x000000016f969e70   pc: 0x0000000184475da8 cpsr: 0x80000000
Executable file
Crash Log ends with an executable file, where you can see the dynamic libraries loaded at that time.
Binary Images:
0x100490000 - 0x103cabfff WeChat arm64  <6499420763bf3621abf3f6218adc6354> /var/containers/Bundle/Application/11F1F5DE-2F68-4331-A107-FAADCED42A1F/WeChat.app/WeChat
0x104ce8000 - 0x104e1ffff MMCommon arm64  <85b8839214673db29e3b6a4eeaaacba7> /var/containers/Bundle/Application/11F1F5DE-2F68-4331-A107-FAADCED42A1F/WeChat.app/Frameworks/MMCommon.framework/MMCommon
0x104e68000 - 0x104ea3fff dyld arm64  <06dc98224ae03573bf72c78810c81a78> /usr/lib/dyld
0x104efc000 - 0x1051bbfff TXLiteAVSDK_Smart_No_VOD arm64  <94b2ab6b3c863923b321327155770286> /var/containers/Bundle/Application/11F1F5DE-2F68-4331-A107-FAADCED42A1F/WeChat.app/Frameworks/TXLiteAVSDK_Smart_No_VOD.framework/TXLiteAVSDK_Smart_No_VOD
0x1055e4000 - 0x10572ffff WCDB arm64  <c1b1509046923a93b29755fe25526e00> /var/containers/Bundle/Application/11F1F5DE-2F68-4331-A107-FAADCED42A1F/WeChat.app/Frameworks/WCDB.framework/WCDB
0x10587c000 - 0x105c7bfff MultiMedia arm64  <b456f7d1d8ba3eadb83d84d9e9eed783> /var/containers/Bundle/Application/11F1F5DE-2F68-4331-A107-FAADCED42A1F/WeChat.app/Frameworks/MultiMedia.framework/MultiMedia
0x105f8c000 - 0x106147fff QMapKit arm64  <682efa309eed33ce894bd1383988e38a> /var/containers/Bundle/Application/11F1F5DE-2F68-4331-A107-FAADCED42A1F/WeChat.app/Frameworks/QMapKit.framework/QMapKit
...
Symbolication
The crash log function stack we just got:
...
7   WeChat                          0x00000001031f64d4 0x100490000 + 47604948
8   WeChat                          0x0000000102e74a5c 0x100490000 + 43928156
9   WeChat                          0x0000000102e71a14 0x100490000 + 43915796
As you can see, these addresses don't actually provide us with any useful information. We need to convert them into classes / functions to find problems. This process is called symbolization.
Symbolization requires one thing: Debug Symbol files, which we often call dsym files.
Machine instructions usually correspond to a line of code in your source file. When compiled, the compiler generates information about this mapping relationship. According to the DEBUG_INFORMATION_FORMAT settings in build setting s, this information may exist in binary files or dsym files.
Note that the binary file in crash log will have a unique UUID and the dsym file will have a unique uuid. The UUID of the two files can be symbolized only when they are corresponding.
If you choose to upload dsym files when uploading to App Store, the crash logs you see in XCode are automatically symbolized.
BitCode
When a project opens BitCode, the compiler does not generate machine code, but an intermediate code called bitcode. When uploaded to the App Store, does this bitCode compile into a machine?
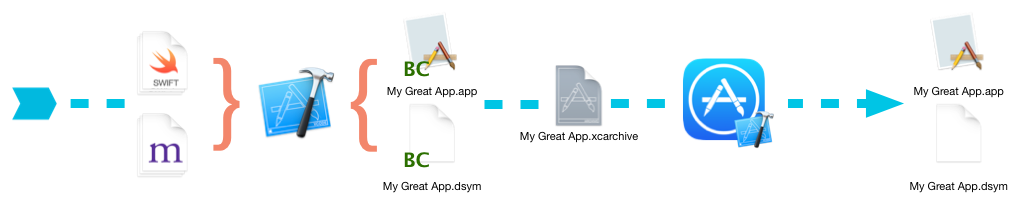
So, the question arises. The final compilation process is uncontrollable to you. How do you get dsym files?
The answer is that Apple will generate this dsym file, which you can download from XCode or iTunes Connect.
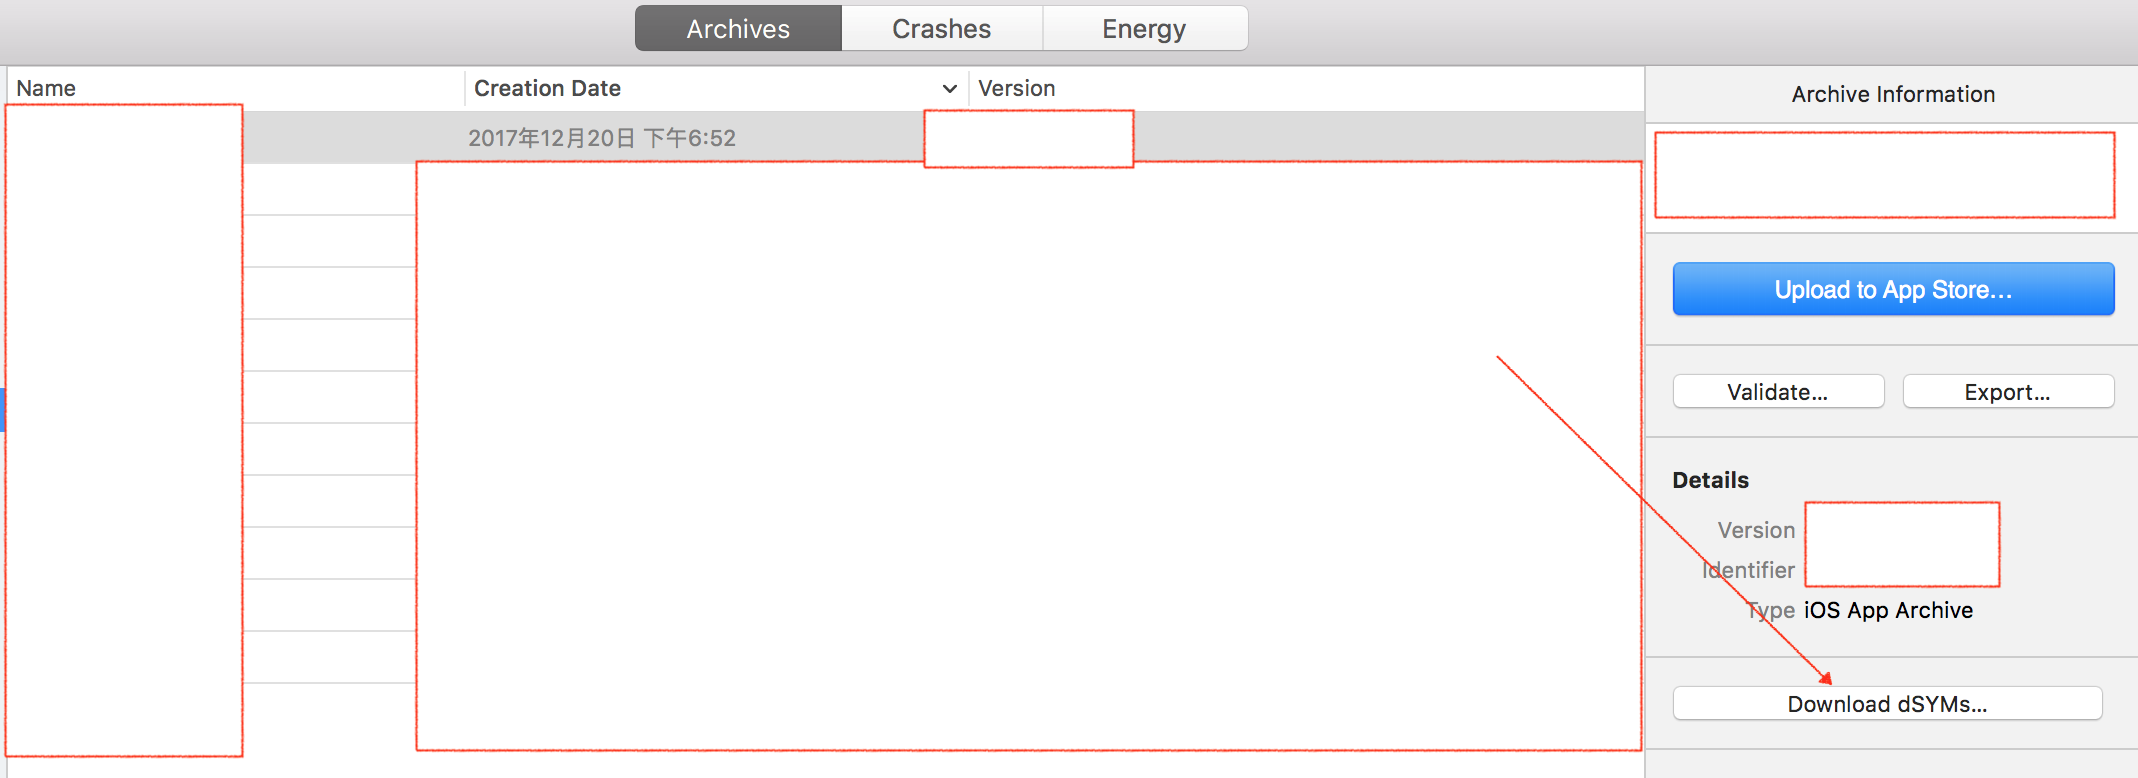
Download from XCode: Window - > Orginizer - > Archives - > Select Build Version - > Download dSYMs
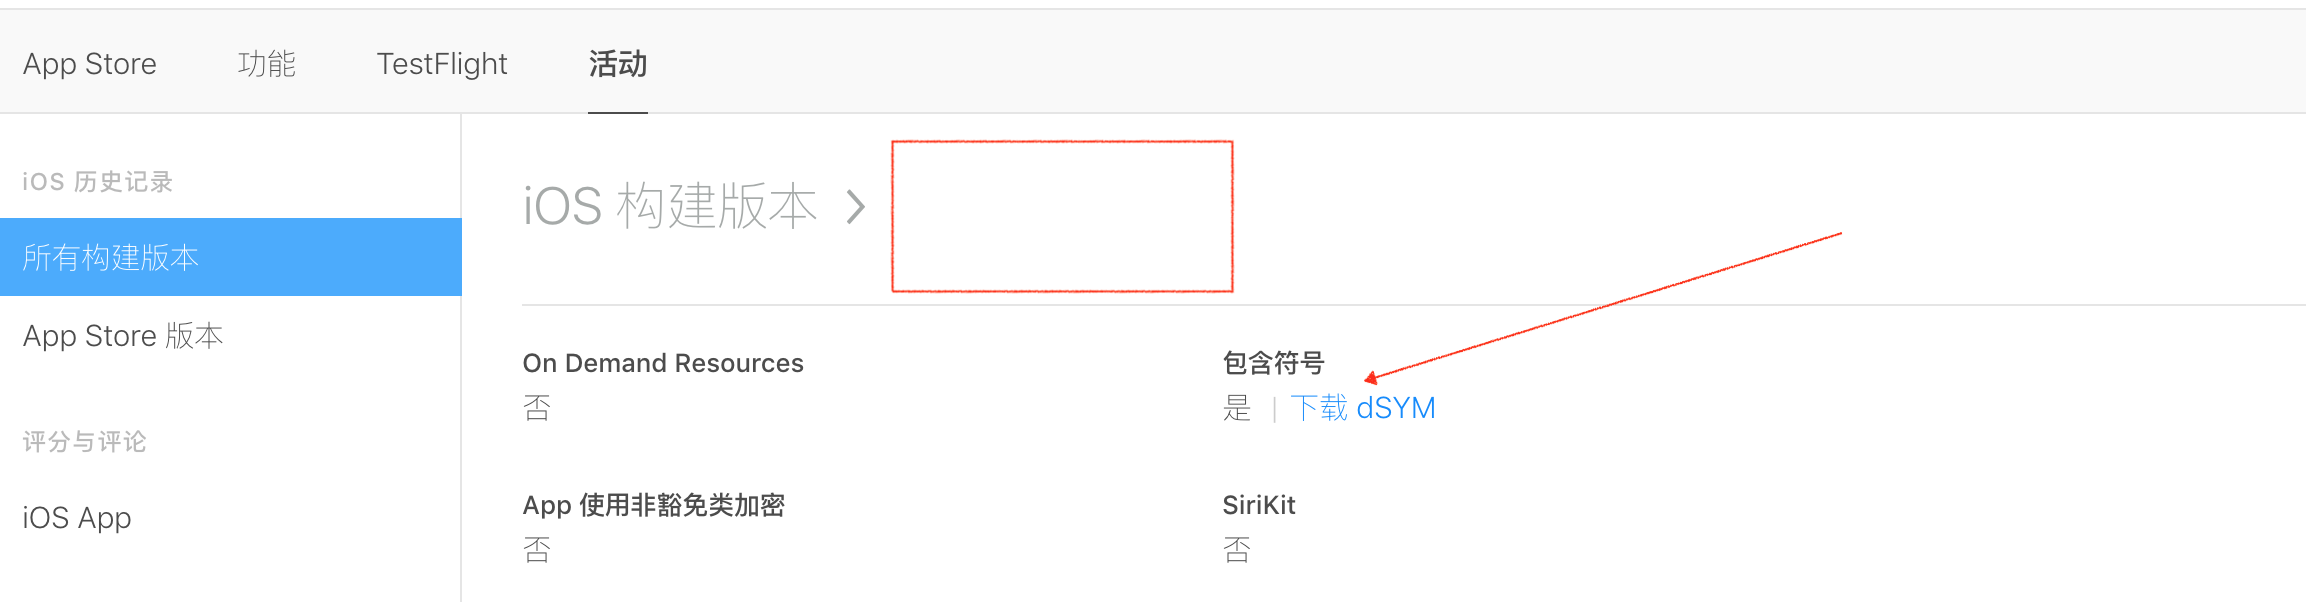
Download from iTunes Connect
Manual Symbolization
uuid
In crash log, you can see the uuid corresponding to image (executable file).
You can also use grep to quickly find uuid
$ grep --after-context=1000 "Binary Images:" <Path to Crash Report> | grep <Binary Name>Next, let's look at dsym's uuid:
xcrun dwarfdump --uuid <Path to dSYM file>Only when two UUIDs correspond to each other can the symbolization be successful.
XCode
XCode automatically attempts to symbolize Crash Log (requiring the file to end with. crash)
- USB Connection Device
- Open XCode, menu bar device - > Window
- Choose a device
- Point View Device Logs
- Then drag your crash log to the left
- XCode automatically symbolizes
To automatically symbolize XCode, you need to be able to find the following files:
- Crashed executable files and dsym files
- dsym files for all framework s used
- OS version related symbols (XCode automatically copies these symbols to the device when connected to USB)
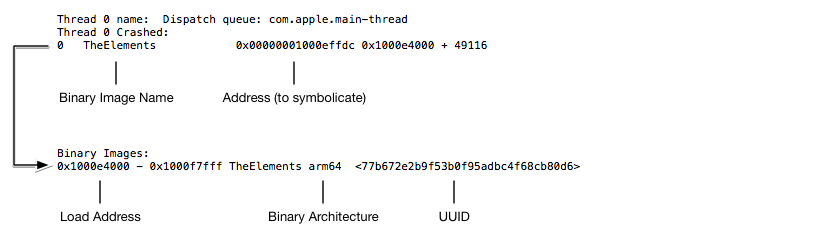
atos
atos is a command-line tool that can be used to symbolize a single address in the following format:
atos -arch <Binary Architecture> -o <Path to dSYM file>/Contents/Resources/DWARF/<binary image name> -l <load address> <address to symbolicate>
Give an example:
$ atos -arch arm64 -o TheElements.app.dSYM/Contents/Resources/DWARF/TheElements -l 0x1000e4000 0x00000001000effdc
-[AtomicElementViewController myTransitionDidStop:finished:context:]
symbolicatecrash
Symbolic tecrash is XCode's built-in tool for symbolizing the entire Crash Log
cd /Applications/Xcode.app/Contents/SharedFrameworks/DVTFoundation.framework/Versions/A/Resources
./symbolicatecrash ~/Desktop/1.crash ~/Desktop/1.dSYM > ~/Desktop/result.crash
If you make a mistake
Error: "DEVELOPER_DIR" is not defined at ./symbolicatecrash line 60Environmental variables can be introduced to solve this problem.
export DEVELOPER_DIR=/Applications/Xcode.app/Contents/Developer
lldb
Suppose you have a crashlog stack like this
Exception Type: EXC_BAD_ACCESS (SIGSEGV)
...
0   libobjc.A.dylib 0x00007fff6011713c objc_release + 28
1   RideSharingApp 0x00000001000022ea @objc LoginViewController.__ivar_destroyer + 42
By calling the stack, we know that crash is caused when the ivar of LoginViewController is released, and LoginViewController has many attributes. Which one is released that causes crash?
We can look at the assembly code through lldb to find some clues:
First, open the terminal and import the crashlog tool
LeodeMacbook:Desktop Leo$ lldb
(lldb) command script import lldb.macosx.crashlog
"crashlog" and "save_crashlog" command installed, use the "--help" option for detailed help
"malloc_info", "ptr_refs", "cstr_refs", "find_variable", and "objc_refs" commands have been installed, use the "--help" options on these commands for detailed help.
Next, we can use a series of commands provided by this script.
Load Crash log
crashlog /Users/…/RideSharingApp-2018-05-24-1.crash
...
Thread[0] EXC_BAD_ACCESS (SIGSEGV) (0x000007fdd5e70700)
[ 0] 0x00007fff6011713c libobjc.A.dylib objc_release + 28
[ 1] 0x00000001000022ea RideSharingApp @objc LoginViewController.__ivar_destroyer + 42
[ 2] 0x00007fff6011ed66 libobjc.A.dylib object_cxxDestructFromClass + 127
[ 3] 0x00007fff60117276 libobjc.A.dylib objc_destructInstance + 76
[ 4] 0x00007fff60117218 libobjc.A.dylib object_dispose + 22
[ 5] 0x0000000100002493 RideSharingApp Initialize (main.swift:33)
[ 6] 0x0000000100001e75 RideSharingApp main (main.swift:37)
[ 7] 0x00007fff610a2ee1 libdyld.dylib start + 1
Then, look at the assembly code:
(lldb) disassemble -a 0x00000001000022ea
RideSharingApp`@objc LoginViewController.__ivar_destroyer:
0x1000022c0 <+0>: pushq %rbp
0x1000022c1 <+1>: movq %rsp, %rbp
0x1000022c4 <+4>: pushq %rbp
0x1000022c4 <+4>: pushq %rbx
0x1000022c5 <+5>: pushq %rax
0x1000022c6 <+6>: movq %rdi, %rbx
0x1000022c9 <+9>: movq 0x551e40(%rip), %rax      ; direct field offset for LoginViewController.userName
0x1000022d0 <+16>: movq 0x10(%rbx,%rax), %rdi
0x1000022d5 <+21>: callq 0x1004adc90             ; swift_unknownRelease
0x1000022da <+26>: movq 0x551e37(%rip), %rax     ; direct field offset for LoginViewController.database
0x1000022e1 <+33>: movq (%rbx,%rax), %rdi
0x1000022e5 <+37>: callq 0x1004bf9e6             ; symbol stub for: objc_release
0x1000022ea <+42>: movq 0x551e2f(%rip), %rax     ; direct field offset for LoginViewController.views
0x1000022f1 <+49>: movq (%rbx,%rax), %rdi
0x1000022f5 <+53>: addq $0x8, %rsp
0x1000022f9 <+57>: popq %rbx
0x1000022fa <+58>: popq %rbp
0x1000022fb <+59>: jmp 0x1004adec0               ; swift_bridgeObjectRelease
We see that the address of this line is our crash's symbolic address:
0x1000022ea <+42>: movq 0x551e2f(%rip), %rax ; direct field offset for LoginViewController.viewsBut the PC register always saves the next instruction to execute, so the actual crash should be the last instruction.
0x1000022da <+26>: movq 0x551e37(%rip), %rax     ; direct field offset for LoginViewController.database
0x1000022e1 <+33>: movq (%rbx,%rax), %rdi
0x1000022e5 <+37>: callq 0x1004bf9e6             ; symbol stub for: objc_release
It is not difficult to see from the comments behind the assembly code that the problem lies in the attribute database.
Common Code and Debug Techniques
EXC_BAD_ACCESS/SIGSEGV/SIGBUS
All three are memory access errors, such as array crossing, accessing an OC object that has been released, trying to write to the readonly address, and so on. This error usually finds some details of the error address in Exception's Subtype.
When debugging, you need to observe the context of the call stack:
- If you see objc_msgSend and objc_release in the context, it is often an attempt to send a message to a released Objective C object, which can be debugged with Zombies.
- Multithreading can also be the cause of memory problems. Open Address Sanitizer and let it help you find multithreaded DataRace.
EXC_CRASH/SIGABRT
These two Code s represent the exit of process exceptions, most commonly some of which are not handled by Objective C/C++ exceptions.
App Extensions can also occur if it takes too much time to initialize and is killed by watchdog.
EXC_BREAKPOINT/SIGTRAP
Similar to process exception exit, this exception is trying to tell the debugger that this exception has occurred, and if there is no debugger attachment at present, the process will be killed.
This exception can be manually set out in the code by _builtin_trap().
This Crash is common in iOS underlying frameworks, most commonly GCD, such as dispatch_group
Crashed: com.apple.main-thread
0  libdispatch.dylib              0x18316fae4 dispatch_group_leave$VARIANT$mp + 76
2  libdispatch.dylib              0x18316cb24 _dispatch_call_block_and_release + 24
Swfit code also has this exception in the following cases:
- Assign nil to a non-optional value type
- Failed Mandatory Type Conversion
Killed [SIGKILL]
Processes are forced to be killed by the system. Usually, Termination Reason can find the reason for the killing:
- 0x8badf00d indicates a watch dog timeout, usually when the main thread is stuck or the startup time exceeds 20s.