theme
Default theme
By default, two sets of themes are built in ECharts: light dark
It can be indicated in the initialization object method init
var chart = echarts.init(box, 'light')
var chart = echarts.init(box, 'dark')
light effect
var box=echarts.init(document.getElementById("box") ,'light');

dark effect
var box=echarts.init(document.getElementById("box") ,'dark');

Custom theme
Edit a topic in the topic editor
The address of the topic editor is: https://echarts.apache.org/zh/theme-builder.html
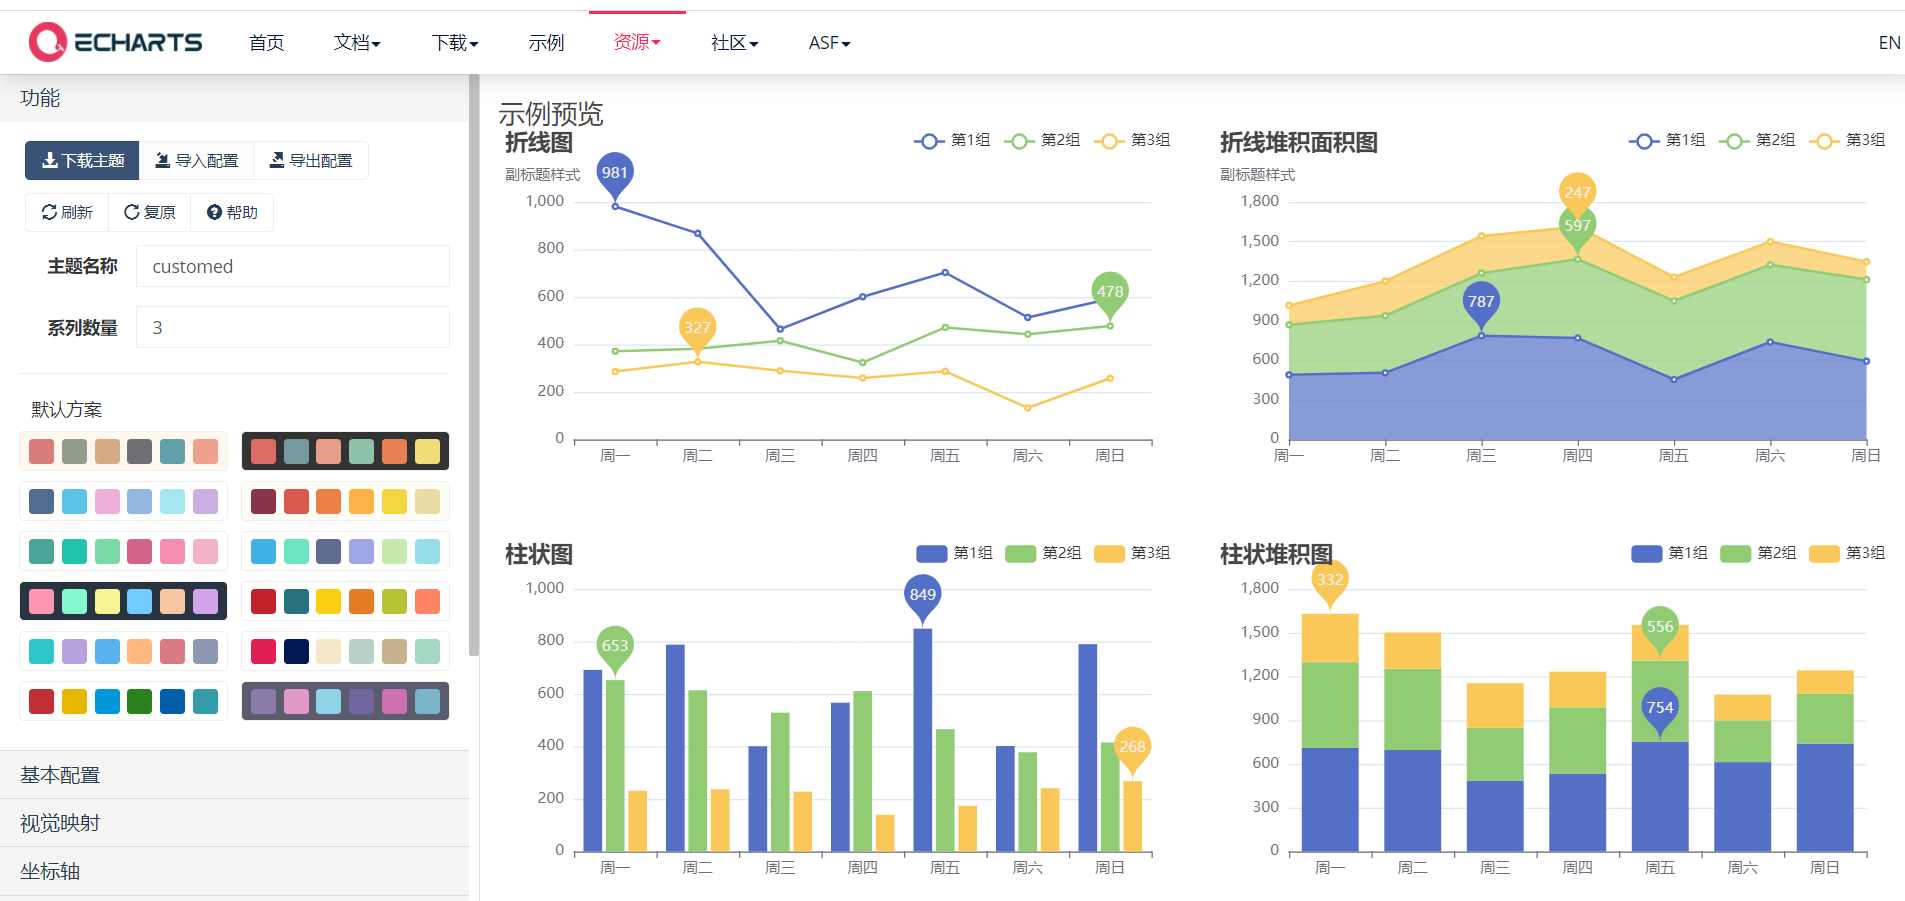
1> In this address, many aspects of a topic are defined:

2> Download the theme, which is a js file
After setting the desired theme style, click download to download js format

3> Import theme js file
<script src="./lib/customed.js"></script>
4> Using themes in init methods
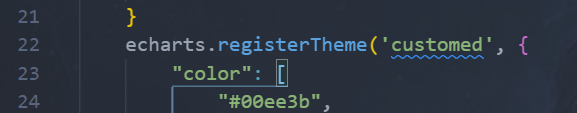
var box=echarts.init(document.getElementById("box") ,'customed');

The second parameter customized in the init method is the name of the topic. We can see the name in the code of itcast.js
Palette
It is a group of colors. Graphics and series will automatically select colors from them, and continue to cycle from beginning to end, and then from beginning to end
Themes palette
In the theme just customized and downloaded, set the color we want

After introducing the theme file, we can see
Before it was introduced After introduction


Global color palette
The global palette is an array of color s added under option
If the global palette is configured, it overrides the theme palette
var option = {
    color:['red','blue','green'],
  series: [
   {
      type: 'pie',
      data: pieData
   }
 ]
}
The globally defined colors will be displayed,

Local palette
The local palette is to add an array of color s under series
var option = {
    color:['red','blue','green'],
  series: [
   {
      type: 'pie',
      data: pieData,
    color:['pink','skyblue','orange'],

   }
 ]
}
The local color palette overrides the global color palette

Note: local > Global > topic, adopt the principle of proximity
Gradient color
In ECharts, linear gradient and radial gradient are supported
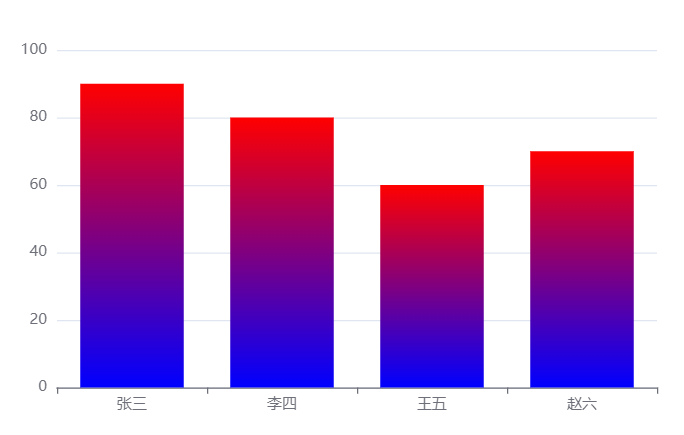
Linear gradient
The type of linear gradient is linear. It needs to configure the linear direction through X, y, X2 and Y2. The range of X, y, X2 and Y2 is 0 - 1, which is equivalent to the percentage in the graphic bounding box. If global is true, the four values are absolute pixel positions. 90 in the following code, 0 0 0 1 means gradient from top to bottom
 series: [
  {
    type: 'bar',
    data: yDataArr,
    itemStyle: {
     color: {
      type: 'linear',  //Gradient type, linear
      x: 0,  //Determines the direction of the linear gradient
      y: 0,//Determines the direction of the linear gradient
      x2: 0,//Determines the direction of the linear gradient
      y2: 1,//Determines the direction of the linear gradient
      colorStops: [{
       offset: 0, color: 'red' // Color at 0%
     }, {
       offset: 1, color: 'blue' // Color at 100%
     }],
      globalCoord: true
    }
   }
  }
 ]
Radial Gradient
The type of linear gradient is radial. It needs to configure the radial direction through X, y and R. the first three parameters are circle center x, y and radius, and the values are the same as those of linear gradient
 series: [
  {
    type:'bar',
    data:yDataArr,
     itemStyle: {
       color: {
         type: 'radial',
         x: 0.5,
         y: 0.5,
         r: 0.5,
         colorStops: [{
           offset: 0, color: 'red' // Color at 0%
        }, {
           offset: 1, color: 'blue' // Color at 100%
        }],
      globalCoord: false
      }
    }
  }
]

style
Direct style
- itemStyle: controls the style of an area
- textStyle: the title style of the chart
- lineStyle: controls the style of lines
- areaStyle: controls the style of the area
- label: text style in pie chart
Take Taobao as an example
 data: [{
            value: 100,
            name: "TaoBao",
            itemStyle: { // Control the style of Taobao area
              color: 'blue'
            },
            label: {
              color: 'red'
            },
]

Highlight style
Wrap the original itemStyle in emphasis, etc
data: [{
            value: 100,
            name: "TaoBao",
            itemStyle: { // Control the style of Taobao area
              color: 'blue'
            },
            label: {
              color: 'red'
            },
            emphasis: {
              itemStyle: { //The mouse changes color
                color: 'orange'
              },
              label: {//The mouse changes color
                color: 'blue'
              }
            }
          },
]

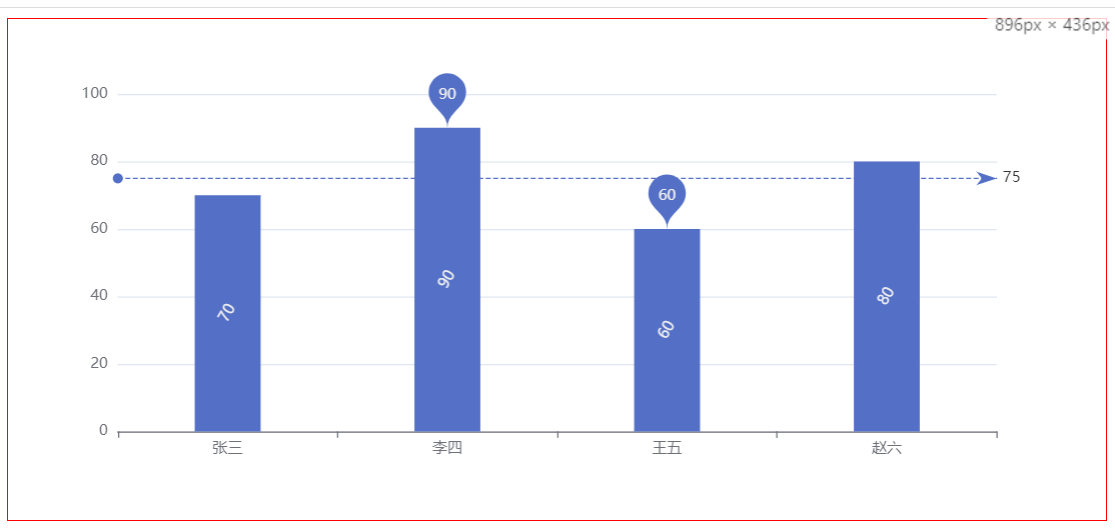
self-adaption
When the size of the browser changes, if you want the chart to adapt to the change
<script>
var box = echarts.init(document.getElementById("box"))
var xDataArr = ['Zhang San', 'Li Si', 'Wang Wu', 'Zhao Liu']
var yDataArr = [70, 90, 60, 80]
var option = {
xAxis: {
type: 'category',
data: xDataArr
},
yAxis: {
type: 'value'
},
series: [
{
type: 'bar',
data: yDataArr,
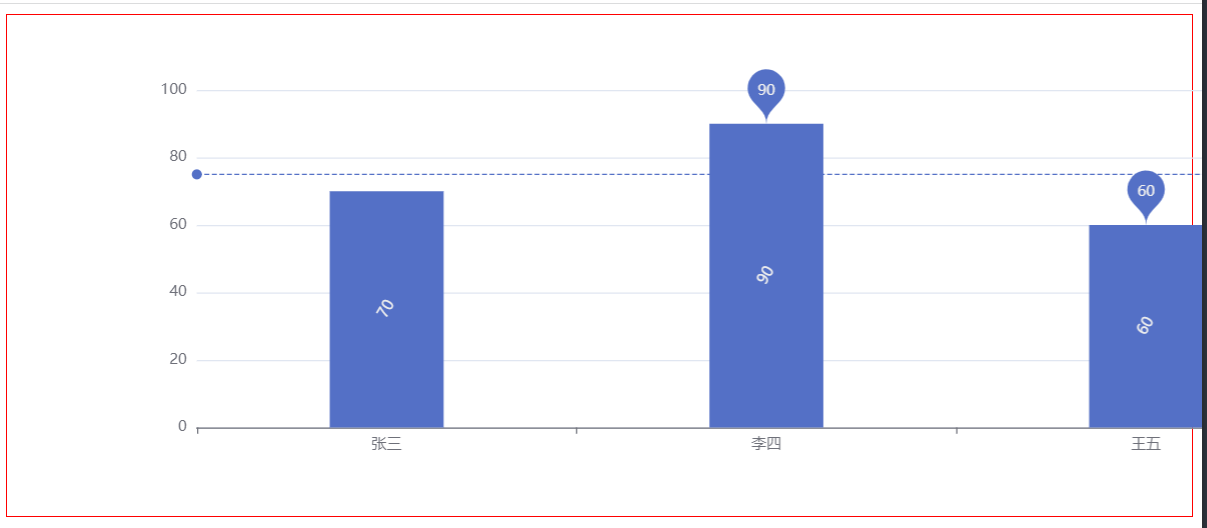
markPoint: {
data: [
{
type: 'max', name: 'Maximum'
},
{
type: 'min', name: 'minimum value'
}
]
},
markLine: {
data: [
{
type: 'average', name: 'average value'
}
]
},
label: {
show: true,
rotate: 60
},
barWidth: '30%'
}
]
}
box.setOption(option)
</script>
When the browser window changes, you also want to adapt the chart
1> Listen for window size change events
2> calls the ECharts instance object's resize in the event handler.
 window.onresize=function(){
        // console.log(window.onresize)
        //Call the resize method of the ecarts instance object
        box.resize()
    }
The chart changes with the change of the window
It's the same with that
window.onresize=box.resize
Here is the reference assignment of the function. When the browser window changes, the resize function will be called. Note that "()" cannot be added after resize