Distributed applications have a variety of problems.To solve these problems, besides applying some monitoring buried points by yourself, there should be some peripheral systems for active detection and discovery.
That's what APM tools do. SkyWalking is an excellent APM application from open source and has become a top-level project for apache.
Today let's practice SkyWalking.
Practice goal: To monitor several existing systems, understand the call relationships, and find performance issues.
Practice steps:
-
SkyWalking server installation runs;
-
Application-side access;
-
Background view effect;
-
Analyzing and troubleshooting problems;
-
Deep understanding (if in a mood);
- SkyWalking Service-side Installation
Download the application package:
# Home Download Page
 http://skywalking.apache.org/downloads/
 # Click on the specific download address to download, such as:
 wget http://mirrors.tuna.tsinghua.edu.cn/apache/skywalking/6.5.0/apache-skywalking-apm-6.5.0.tar.gz
Unzip the installation package:
tar -xzvf apache-skywalking-apm-6.5.0.tar.gz
Start the service directly using the default configuration port, default storage h2:
./bin/startup.sh
Good products are so simple!
The server is now up and can open the background address for viewing (port 8080 by default): http://localhost:8080 The interface is as follows: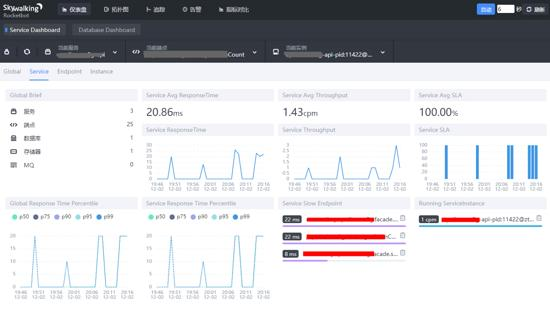
Of course, the page above is where the app already exists.You can't see any apps right now because you haven't connected yet.
- Application-side access
We only practice using java application access.
Start directly with javaagent:
java -javaagent:/root/skywalking/agent/skywalking-agent.jar -Dskywalking.agent.service_name=app1 -Dskywalking.collector.backend_service=localhost:11800 -jar myapp.jar
Parameter description:
#Parameter Interpretation
 skywalking.agent.service_name: The name of this application in skywalking
 skywalking.collector.backend_service: skywalking service end address, grpc report address, default port is 1180
 #The above two parameters can also be represented in another way
 SW_AGENT_COLLECTOR_BACKEND_SERVICES: Same meaning as skywalking.collector.backend_service
 SW_AGENT_NAME: Same meaning as skywalking.agent.service_name
Access several interfaces or pages at will so that monitoring can grab data.
Go back to the administration page and you'll see that there are nodes.The screenshot above.
Now we can also see the relationship between the apps!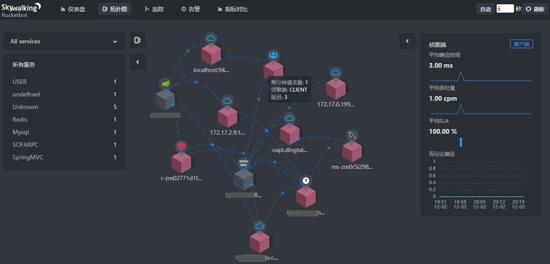
Clear relationship!At a glance, the code can be as complex as it is.
We can also track specific links: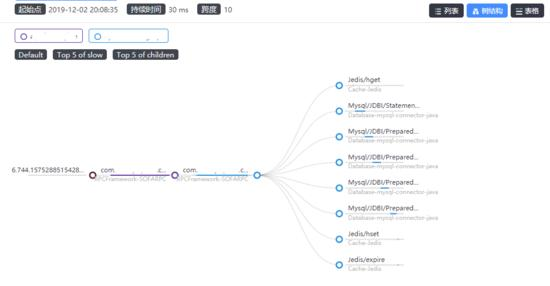
As long as you know when the problem occurs, you can quickly locate the interface and system where the problem occurs and solve it quickly.
- SkyWalking Profile
As mentioned above, we did not change any configuration files and let the system run.Fortunately, at the same time, we should know more!At least configuration is known.
config/application.yml: Collector server configuration
webapp/webapp.yml: Configure the Web port and the IP and port of the OAP(Collector) that gets the data
agent/config/agent.config: Configure Agent information such as the address and name of Skywalking OAP(Collector)
Here's the default configuration for skywalking so we can run without changing it!Change to Productive Configuration!
config/application.yml
cluster:
 standalone:
 # Please check your ZooKeeper is 3.5+, However, it is also compatible with ZooKeeper 3.4.x. Replace the ZooKeeper 3.5+
 # library the oap-libs folder with your ZooKeeper 3.4.x library.
# zookeeper:
# nameSpace: ${SW_NAMESPACE:""}
# hostPort: ${SW_CLUSTER_ZK_HOST_PORT:localhost:2181}
# #Retry Policy
# baseSleepTimeMs: ${SW_CLUSTER_ZK_SLEEP_TIME:1000} # initial amount of time to wait between retries
# maxRetries: ${SW_CLUSTER_ZK_MAX_RETRIES:3} # max number of times to retry
# # Enable ACL
# enableACL: ${SW_ZK_ENABLE_ACL:false} # disable ACL in default
# schema: ${SW_ZK_SCHEMA:digest} # only support digest schema
# expression: ${SW_ZK_EXPRESSION:skywalking:skywalking}
# kubernetes:
# watchTimeoutSeconds: ${SW_CLUSTER_K8S_WATCH_TIMEOUT:60}
# namespace: ${SW_CLUSTER_K8S_NAMESPACE:default}
# labelSelector: ${SW_CLUSTER_K8S_LABEL:app=collector,release=skywalking}
# uidEnvName: ${SW_CLUSTER_K8S_UID:SKYWALKING_COLLECTOR_UID}
# consul:
# serviceName: ${SW_SERVICE_NAME:"SkyWalking_OAP_Cluster"}
# Consul cluster nodes, example: 10.0.0.1:8500,10.0.0.2:8500,10.0.0.3:8500
# hostPort: ${SW_CLUSTER_CONSUL_HOST_PORT:localhost:8500}
# nacos:
# serviceName: ${SW_SERVICE_NAME:"SkyWalking_OAP_Cluster"}
# hostPort: ${SW_CLUSTER_NACOS_HOST_PORT:localhost:8848}
# # Nacos Configuration namespace
# namespace: 'public'
# etcd:
# serviceName: ${SW_SERVICE_NAME:"SkyWalking_OAP_Cluster"}
# etcd cluster nodes, example: 10.0.0.1:2379,10.0.0.2:2379,10.0.0.3:2379
# hostPort: ${SW_CLUSTER_ETCD_HOST_PORT:localhost:2379}
core:
 default:
 # Mixed: Receive agent data, Level 1 aggregate, Level 2 aggregate
 # Receiver: Receive agent data, Level 1 aggregate
 # Aggregator: Level 2 aggregate
 role: ${SW_CORE_ROLE:Mixed} # Mixed/Receiver/Aggregator
 restHost: ${SW_CORE_REST_HOST:0.0.0.0}
 restPort: ${SW_CORE_REST_PORT:12800}
 restContextPath: ${SW_CORE_REST_CONTEXT_PATH:/}
 gRPCHost: ${SW_CORE_GRPC_HOST:0.0.0.0}
 gRPCPort: ${SW_CORE_GRPC_PORT:11800}
 downsampling:
 - Hour
 - Day
 - Month
 # Set a timeout on metrics data. After the timeout has expired, the metrics data will automatically be deleted.
 enableDataKeeperExecutor: ${SW_CORE_ENABLE_DATA_KEEPER_EXECUTOR:true} # Turn it off then automatically metrics data delete will be close.
 dataKeeperExecutePeriod: ${SW_CORE_DATA_KEEPER_EXECUTE_PERIOD:5} # How often the data keeper executor runs periodically, unit is minute
 recordDataTTL: ${SW_CORE_RECORD_DATA_TTL:90} # Unit is minute
 minuteMetricsDataTTL: ${SW_CORE_MINUTE_METRIC_DATA_TTL:90} # Unit is minute
 hourMetricsDataTTL: ${SW_CORE_HOUR_METRIC_DATA_TTL:36} # Unit is hour
 dayMetricsDataTTL: ${SW_CORE_DAY_METRIC_DATA_TTL:45} # Unit is day
 monthMetricsDataTTL: ${SW_CORE_MONTH_METRIC_DATA_TTL:18} # Unit is month
 # Cache metric data for 1 minute to reduce database queries, and if the OAP cluster changes within that minute,
 # the metrics may not be accurate within that minute.
 enableDatabaseSession: ${SW_CORE_ENABLE_DATABASE_SESSION:true}
storage:
# elasticsearch:
# nameSpace: ${SW_NAMESPACE:""}
# clusterNodes: ${SW_STORAGE_ES_CLUSTER_NODES:localhost:9200}
# protocol: ${SW_STORAGE_ES_HTTP_PROTOCOL:"http"}
# trustStorePath: ${SW_SW_STORAGE_ES_SSL_JKS_PATH:"../es_keystore.jks"}
# trustStorePass: ${SW_SW_STORAGE_ES_SSL_JKS_PASS:""}
# user: ${SW_ES_USER:""}
# password: ${SW_ES_PASSWORD:""}
# indexShardsNumber: ${SW_STORAGE_ES_INDEX_SHARDS_NUMBER:2}
# indexReplicasNumber: ${SW_STORAGE_ES_INDEX_REPLICAS_NUMBER:0}
# # Those data TTL settings will override the same settings in core module.
# recordDataTTL: ${SW_STORAGE_ES_RECORD_DATA_TTL:7} # Unit is day
# otherMetricsDataTTL: ${SW_STORAGE_ES_OTHER_METRIC_DATA_TTL:45} # Unit is day
# monthMetricsDataTTL: ${SW_STORAGE_ES_MONTH_METRIC_DATA_TTL:18} # Unit is month
# # Batch process setting, refer to https://www.elastic.co/guide/en/elasticsearch/client/java-api/5.5/java-docs-bulk-processor.html
# bulkActions: ${SW_STORAGE_ES_BULK_ACTIONS:1000} # Execute the bulk every 1000 requests
# flushInterval: ${SW_STORAGE_ES_FLUSH_INTERVAL:10} # flush the bulk every 10 seconds whatever the number of requests
# concurrentRequests: ${SW_STORAGE_ES_CONCURRENT_REQUESTS:2} # the number of concurrent requests
# resultWindowMaxSize: ${SW_STORAGE_ES_QUERY_MAX_WINDOW_SIZE:10000}
# metadataQueryMaxSize: ${SW_STORAGE_ES_QUERY_MAX_SIZE:5000}
# segmentQueryMaxSize: ${SW_STORAGE_ES_QUERY_SEGMENT_SIZE:200}
 h2:
 driver: ${SW_STORAGE_H2_DRIVER:org.h2.jdbcx.JdbcDataSource}
 url: ${SW_STORAGE_H2_URL:jdbc:h2:mem:skywalking-oap-db}
 user: ${SW_STORAGE_H2_USER:sa}
 metadataQueryMaxSize: ${SW_STORAGE_H2_QUERY_MAX_SIZE:5000}
# mysql:
# properties:
# jdbcUrl: ${SW_JDBC_URL:"jdbc:mysql://localhost:3306/swtest"}
# dataSource.user: ${SW_DATA_SOURCE_USER:root}
# dataSource.password: ${SW_DATA_SOURCE_PASSWORD:root@1234}
# dataSource.cachePrepStmts: ${SW_DATA_SOURCE_CACHE_PREP_STMTS:true}
# dataSource.prepStmtCacheSize: ${SW_DATA_SOURCE_PREP_STMT_CACHE_SQL_SIZE:250}
# dataSource.prepStmtCacheSqlLimit: ${SW_DATA_SOURCE_PREP_STMT_CACHE_SQL_LIMIT:2048}
# dataSource.useServerPrepStmts: ${SW_DATA_SOURCE_USE_SERVER_PREP_STMTS:true}
# metadataQueryMaxSize: ${SW_STORAGE_MYSQL_QUERY_MAX_SIZE:5000}
receiver-sharing-server:
 default:
receiver-register:
 default:
receiver-trace:
 default:
 bufferPath: ${SW_RECEIVER_BUFFER_PATH:../trace-buffer/} # Path to trace buffer files, suggest to use absolute path
 bufferOffsetMaxFileSize: ${SW_RECEIVER_BUFFER_OFFSET_MAX_FILE_SIZE:100} # Unit is MB
 bufferDataMaxFileSize: ${SW_RECEIVER_BUFFER_DATA_MAX_FILE_SIZE:500} # Unit is MB
 bufferFileCleanWhenRestart: ${SW_RECEIVER_BUFFER_FILE_CLEAN_WHEN_RESTART:false}
 sampleRate: ${SW_TRACE_SAMPLE_RATE:10000} # The sample rate precision is 1/10000. 10000 means 100% sample in default.
 slowDBAccessThreshold: ${SW_SLOW_DB_THRESHOLD:default:200,mongodb:100} # The slow database access thresholds. Unit ms.
receiver-jvm:
 default:
receiver-clr:
 default:
service-mesh:
 default:
 bufferPath: ${SW_SERVICE_MESH_BUFFER_PATH:../mesh-buffer/} # Path to trace buffer files, suggest to use absolute path
 bufferOffsetMaxFileSize: ${SW_SERVICE_MESH_OFFSET_MAX_FILE_SIZE:100} # Unit is MB
 bufferDataMaxFileSize: ${SW_SERVICE_MESH_BUFFER_DATA_MAX_FILE_SIZE:500} # Unit is MB
 bufferFileCleanWhenRestart: ${SW_SERVICE_MESH_BUFFER_FILE_CLEAN_WHEN_RESTART:false}
istio-telemetry:
 default:
envoy-metric:
 default:
# alsHTTPAnalysis: ${SW_ENVOY_METRIC_ALS_HTTP_ANALYSIS:k8s-mesh}
#receiver_zipkin:
# default:
# host: ${SW_RECEIVER_ZIPKIN_HOST:0.0.0.0}
# port: ${SW_RECEIVER_ZIPKIN_PORT:9411}
# contextPath: ${SW_RECEIVER_ZIPKIN_CONTEXT_PATH:/}
query:
 graphql:
 path: ${SW_QUERY_GRAPHQL_PATH:/graphql}
alarm:
 default:
telemetry:
 none:
configuration:
 none:
# apollo:
# apolloMeta: http://106.12.25.204:8080
# apolloCluster: default
# # apolloEnv: # defaults to null
# appId: skywalking
# period: 5
# nacos:
# # Nacos Server Host
# serverAddr: 127.0.0.1
# # Nacos Server Port
# port: 8848
# # Nacos Configuration Group
# group: 'skywalking'
# # Nacos Configuration namespace
# namespace: ''
# # Unit seconds, sync period. Default fetch every 60 seconds.
# period : 60
# # the name of current cluster, set the name if you want to upstream system known.
# clusterName: "default"
# zookeeper:
# period : 60 # Unit seconds, sync period. Default fetch every 60 seconds.
# nameSpace: /default
# hostPort: localhost:2181
# #Retry Policy
# baseSleepTimeMs: 1000 # initial amount of time to wait between retries
# maxRetries: 3 # max number of times to retry
# etcd:
# period : 60 # Unit seconds, sync period. Default fetch every 60 seconds.
# group : 'skywalking'
# serverAddr: localhost:2379
# clusterName: "default"
# consul:
# # Consul host and ports, separated by comma, e.g. 1.2.3.4:8500,2.3.4.5:8500
# hostAndPorts: ${consul.address}
# # Sync period in seconds. Defaults to 60 seconds.
# period: 1

#exporter:
# grpc:
# targetHost: ${SW_EXPORTER_GRPC_HOST:127.0.0.1}
# targetPort: ${SW_EXPORTER_GRPC_PORT:9870}
webapp/webapp.yml
 server:
 port: 8080

collector:
 path: /graphql
 ribbon:
 ReadTimeout: 10000
 # Point to all backend's restHost:restPort, split by ,
 listOfServers: 127.0.0.1:12800
agent/config/agent.config
 # The agent namespace
# agent.namespace=${SW_AGENT_NAMESPACE:default-namespace}

# The service name in UI
agent.service_name=${SW_AGENT_NAME:Your_ApplicationName}

# The number of sampled traces per 3 seconds
# Negative number means sample traces as many as possible, most likely 100%
# agent.sample_n_per_3_secs=${SW_AGENT_SAMPLE:-1}

# Authentication active is based on backend setting, see application.yml for more details.
# agent.authentication = ${SW_AGENT_AUTHENTICATION:xxxx}

# The max amount of spans in a single segment.
# Through this config item, skywalking keep your application memory cost estimated.
# agent.span_limit_per_segment=${SW_AGENT_SPAN_LIMIT:300}

# Ignore the segments if their operation names end with these suffix.
# agent.ignore_suffix=${SW_AGENT_IGNORE_SUFFIX:.jpg,.jpeg,.js,.css,.png,.bmp,.gif,.ico,.mp3,.mp4,.html,.svg}

# If true, skywalking agent will save all instrumented classes files in `/debugging` folder.
# Skywalking team may ask for these files in order to resolve compatible problem.
# agent.is_open_debugging_class = ${SW_AGENT_OPEN_DEBUG:true}

# The operationName max length
# agent.operation_name_threshold=${SW_AGENT_OPERATION_NAME_THRESHOLD:500}

# Backend service addresses.
collector.backend_service=${SW_AGENT_COLLECTOR_BACKEND_SERVICES:127.0.0.1:11800}

# Logging file_name
logging.file_name=${SW_LOGGING_FILE_NAME:skywalking-api.log}

# Logging level
logging.level=${SW_LOGGING_LEVEL:DEBUG}

# Logging dir
# logging.dir=${SW_LOGGING_DIR:""}

# Logging max_file_size, default: 300 * 1024 * 1024 = 314572800
# logging.max_file_size=${SW_LOGGING_MAX_FILE_SIZE:314572800}

# The max history log files. When rollover happened, if log files exceed this number,
# then the oldest file will be delete. Negative or zero means off, by default.
# logging.max_history_files=${SW_LOGGING_MAX_HISTORY_FILES:-1}

# mysql plugin configuration
# plugin.mysql.trace_sql_parameters=${SW_MYSQL_TRACE_SQL_PARAMETERS:false}- SkyWalking architecture
Pictures from the official website, feel it!Needless to elaborate, the general principle is that different indicators are collected for different clients, sent to apm server through grpc/http, stored in es/h2/mysql and other storage systems after analysis engine, and finally displayed by front end through query engine.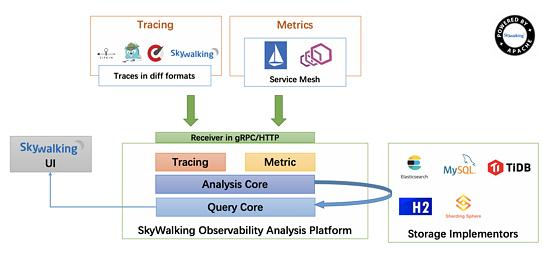
- What can I do with it
Discover how long the system takes or where the bottleneck is.
Found call relationships between systems.
Monitor service exceptions.
Troubleshooting system failure.