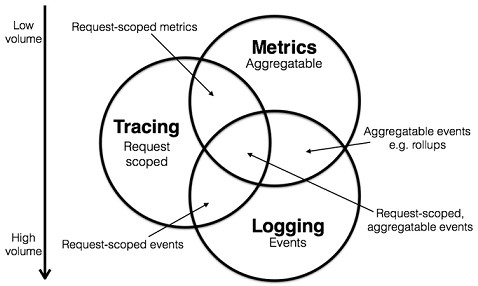
Logging, Metrics and Tracing relationships
Same: to improve the observability of infrastructure and Applications
Difference:
| ---- | Logging | Metrics | Tracing |
|---|---|---|---|
| Characteristic | Record discrete events | Record aggregable data | Record information within the scope of the request |
| Typical Indicators | User-printed debugging information... | QPS, Interface Delay Distribution | Procedures in a specific RPC call: The percentage of time consumed by each service |
| Typical applications | ELK (collection, analysis), log4j (record)... | Prometheus... | Dapper, OpenZipkin,Jaeger... |
They overlap, but each focuses differently
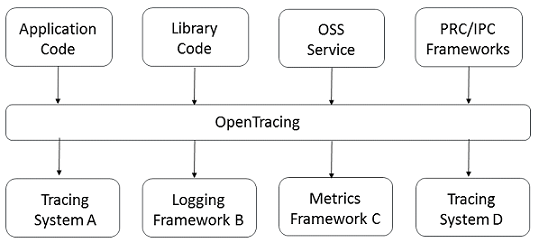
What is OpenTracing
- Today is the world of micro services, Tracing provides a solution for tracking across processes and services
- The OpenTracing API provides a standard, vendor-neutral specification. It allows multiple distributed tracing schemes to exist in the system - as long as the specification is met
OpenTracing Data Model
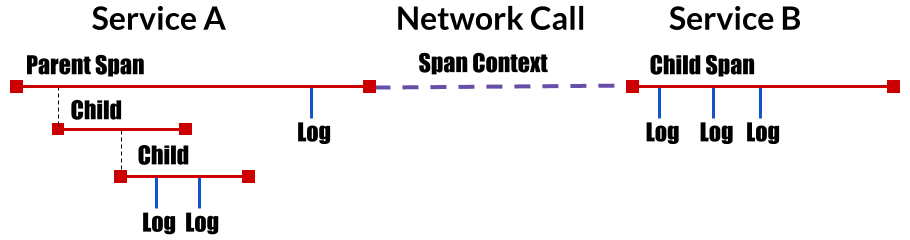
Trace: A call chain represents the execution of a transaction or process in a (distributed) system. In the OpenTracing standard, a call chain is a Directed Acyclic Graph (DAG) composed of multiple Span s.
Span: A name, time-enabled operation that represents a part of the workflow. There is usually the following information on a space: the name of the space, the start and end time of the space, the reference relationship between tag, log, span context, and space.
SpanContext: Along with distributed tracking information, it transmits context information over the network or through the message bus. The space context contains the tracing identifier, the space identifier, and any other data that the tracking system needs to propagate to downstream services.
The relationship between span s:
single Trace in Span Causality between


        [Span A]  ←←←(The root span)
            |
     +------+------+
     |             |
 [Span B]      [Span C] ←←←(Span C yes Span A Child nodes, ChildOf)
     |             |
 [Span D]      +---+-------+
               |           |
           [Span E]    [Span F] >>> [Span G] >>> [Span H]
                                       ↑
                                       ↑
                                       ↑
                         (Span G stay Span F Then called, FollowsFrom)
What is Jaeger
Inspired by Dapper and OpenZipkin, Jaeger is Uber's open source distributed tracking system and has become a supported project by CNCF of the Cloud Harbor Foundation with renowned projects such as k8s and Prometheus. It is used to monitor and troubleshoot failures in micro-service-based distributed systems, including:
- Distributed Context Propagation
- Distributed Transaction Monitoring
- Root Cause Analysis
- Service Dependency Analysis
- Performance/Delay Optimization
Characteristic:
- Compatible with OpenTracing
- High scalability
- Supports multiple storage components: Cassandra, Elasticsearch, memory...
- Modern web interface
- Cloud Native Deployment
- System Topology Diagram
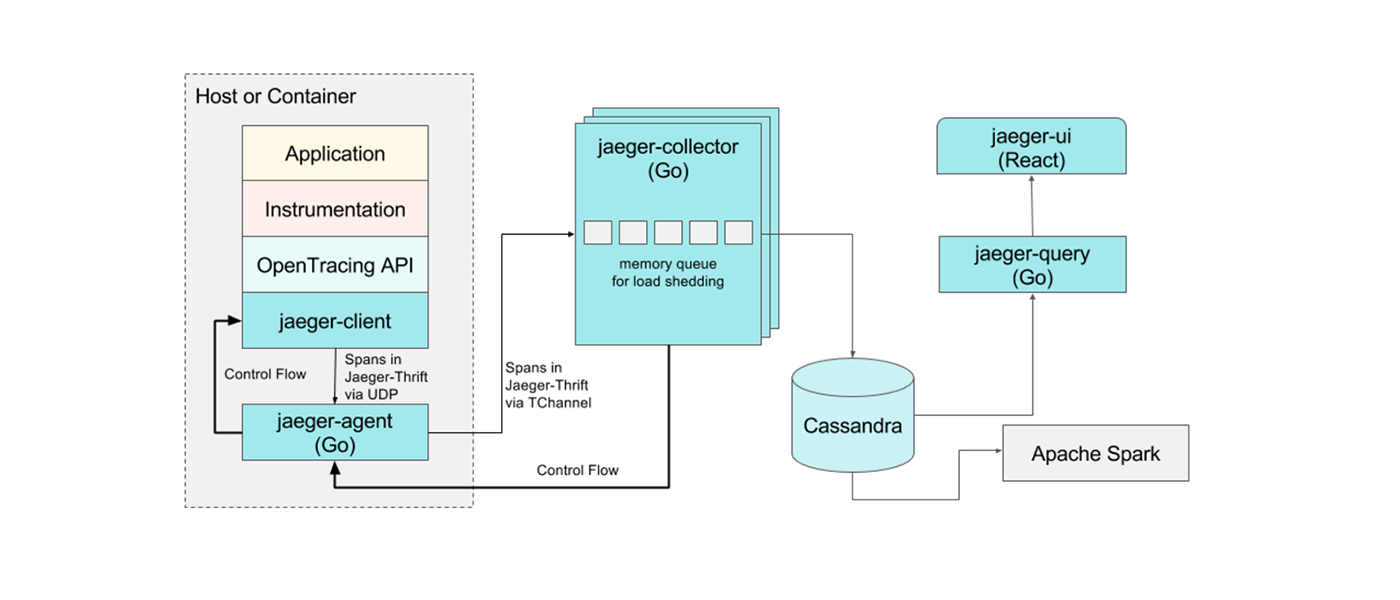
Overall architecture
Geting Start
- docker starts jaeger collector
docker run -d --name jaeger \
  -e COLLECTOR_ZIPKIN_HOST_PORT=:9411 \
  -p 5775:5775/udp \
  -p 6831:6831/udp \
  -p 6832:6832/udp \
  -p 5778:5778 \
  -p 16686:16686 \
  -p 14268:14268 \
  -p 14250:14250 \
  -p 9411:9411 \
  jaegertracing/all-in-one:1.28
- UI interface: http://localhost:16686
- The application uses jaeger-client to report data directly, where the demo example does not use jaeger-agent
There is a simple web application with two interfaces, api1 and api2
package main

import (
	"net/http"
)

func main() {
	// web example
	http.HandleFunc("/api1", http.HandlerFunc(api1))
	http.HandleFunc("/api2", http.HandlerFunc(api2))
	err := http.ListenAndServe(":1234", nil)
	if err != nil {
		panic(err)
	}
}
package main

import (
	"fmt"
	"net/http"
)

func api1(w http.ResponseWriter, r *http.Request) {
	fmt.Println("hello api1")
}

func api2(w http.ResponseWriter, r *http.Request) {
	fmt.Println("hello api2")
}
Use jaeger client to monitor each interface, referencing the following two packages
 go get github.com/uber/jaeger-client-go
go get github.com/opentracing/opentracing-go
Initialization and simple use of jaeger client
package main

import (
	"net/http"

	"github.com/opentracing/opentracing-go"
	"github.com/uber/jaeger-client-go/config"
)

func main() {
  // Initialize jaeger client, parameter requires service name, sampling mechanism, report data address
	tracing, closer, err := config.Configuration{
		ServiceName: "hello.service",
		Sampler:     &config.SamplerConfig{Type: "const", Param: 1},
		Reporter:    &config.ReporterConfig{CollectorEndpoint: "http://localhost:14268/api/traces"},
	}.NewTracer()
	if err != nil {
		panic(err)
	}
	defer closer.Close()
  // Set to Global Default
	opentracing.SetGlobalTracer(tracing)
	// web example
	http.HandleFunc("/api1", jaegerTracing(http.HandlerFunc(api1)))
	http.HandleFunc("/api2", jaegerTracing(http.HandlerFunc(api2)))
	err = http.ListenAndServe(":1234", nil)
	if err != nil {
		panic(err)
	}
}

// Add jaeger distributed tracking Middleware
func jaegerTracing(handler http.Handler) http.HandlerFunc {
	return func(w http.ResponseWriter, r *http.Request) {
    // Record a space report in tracing
		span := opentracing.StartSpan(r.URL.String())
    // span End
		defer span.Finish()
		handler.ServeHTTP(w, r)
	}
}
The purpose of jaeger is to track the call relationships between services. This is not meaningful. Here's what it does to simulate the use of jaeger in multiple service calls
package main

import (
	"context"
	"fmt"
	"net/http"
	"time"

	"github.com/opentracing/opentracing-go"
)

func api1(w http.ResponseWriter, r *http.Request) {
	// Root ctx
	ctx := context.Background()
	// Record sever1. Information such as api's call time
	span, c := opentracing.StartSpanFromContext(ctx, "server1.api1")
	defer span.Finish()
	fmt.Println("hello api1")
	time.Sleep(time.Second)
	// Simulate a cross-service call, ctx context information transfer
	service2XXX(c)
}

func service2XXX(ctx context.Context) {
	// Get span from ctx so you can aggregate spans in a call chain
	span, c := opentracing.StartSpanFromContext(ctx, "server2.XXX")
	defer span.Finish()
	time.Sleep(time.Second * 2)
	fmt.Println("hello server2 xxx", c)
}

func api2(w http.ResponseWriter, r *http.Request) {
	fmt.Println("hello api2")
}
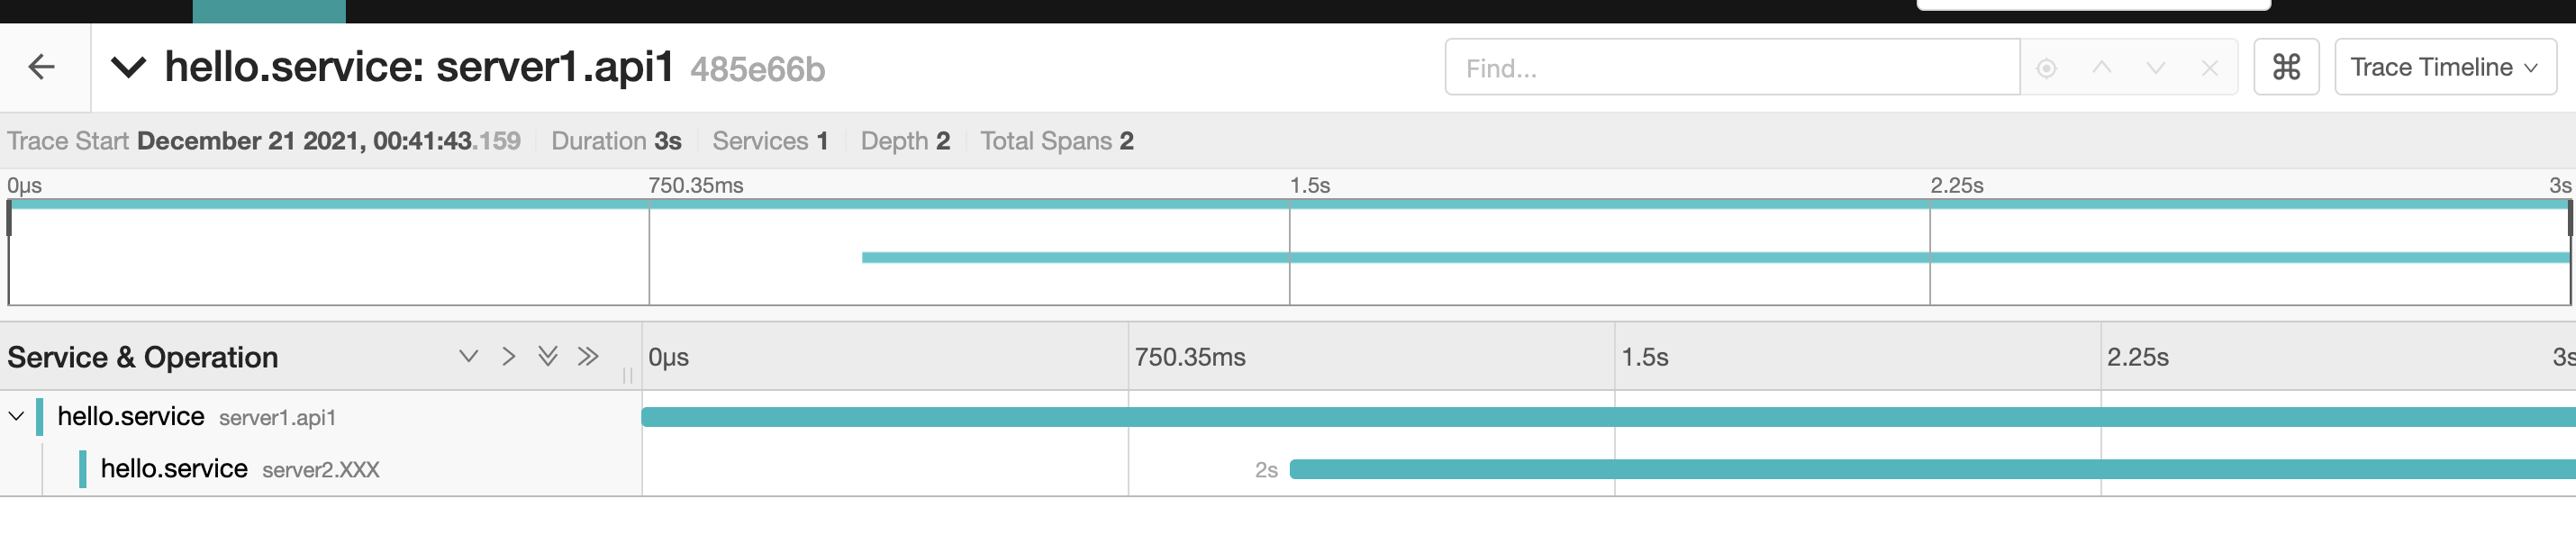
The effect is as follows
Reference resources
- https://github.com/jaegertracing/jaeger
- https://www.jaegertracing.io/docs/1.29/
- https://opentracing.io/
- https://github.com/yurishkuro/opentracing-tutorial/tree/master/go