origin
At present, most companies are distributed services. For the analysis of production logs, a log collection system needs to be built to facilitate development, operation and maintenance to analyze and monitor production problems. This blog uses filebeat + Kafka + logstash + elastic search + kibana to build a distributed log collection system.
This practice is based on filebeat: 6.0 1 logstash: 6.0. 1 elasticsearch 6.0. 1 kibana 6.0. 1 the log collection architecture of kafak 2.11 has changed greatly due to different versions. It is recommended that readers use this version.
framework
Framework architecture
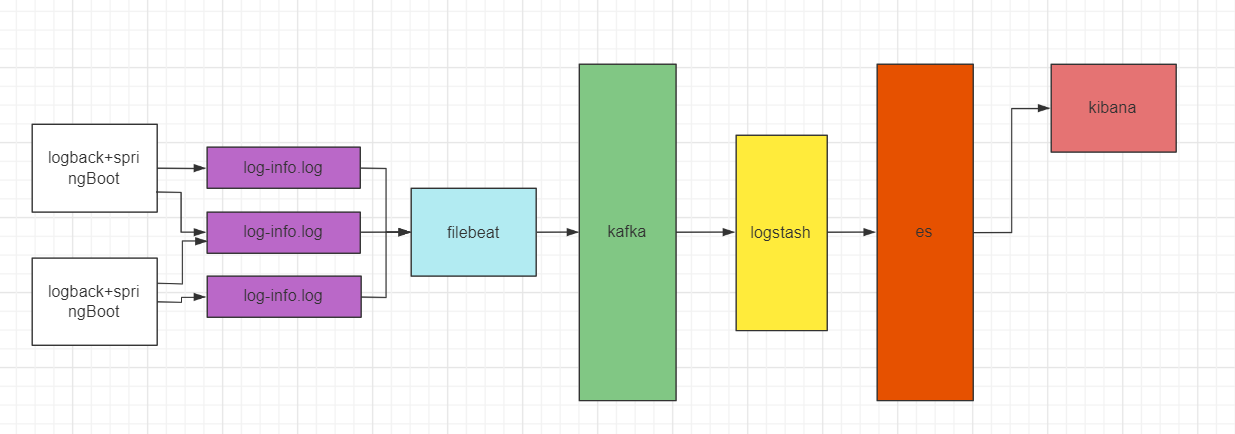
- Filebeat is a log file shipping tool. After installing the client on your server, filebeat will monitor the log directory or specified log files and track the reading of these files (track the changes of files and keep reading)
- Kafka is a high-throughput distributed publish subscribe message system, which can process all action flow data in consumer scale websites
- Logstash is a pipeline with real-time data transmission capability, which is responsible for transmitting data information from the input end of the pipeline to the output end of the pipeline; At the same time, this pipeline can also allow you to add filters in the middle according to your own needs. Logstash provides many powerful filters to meet your various application scenarios
- ElasticSearch provides a distributed multi-user full-text search engine based on RESTful web interface
- Kibana is the user interface of ElasticSearch
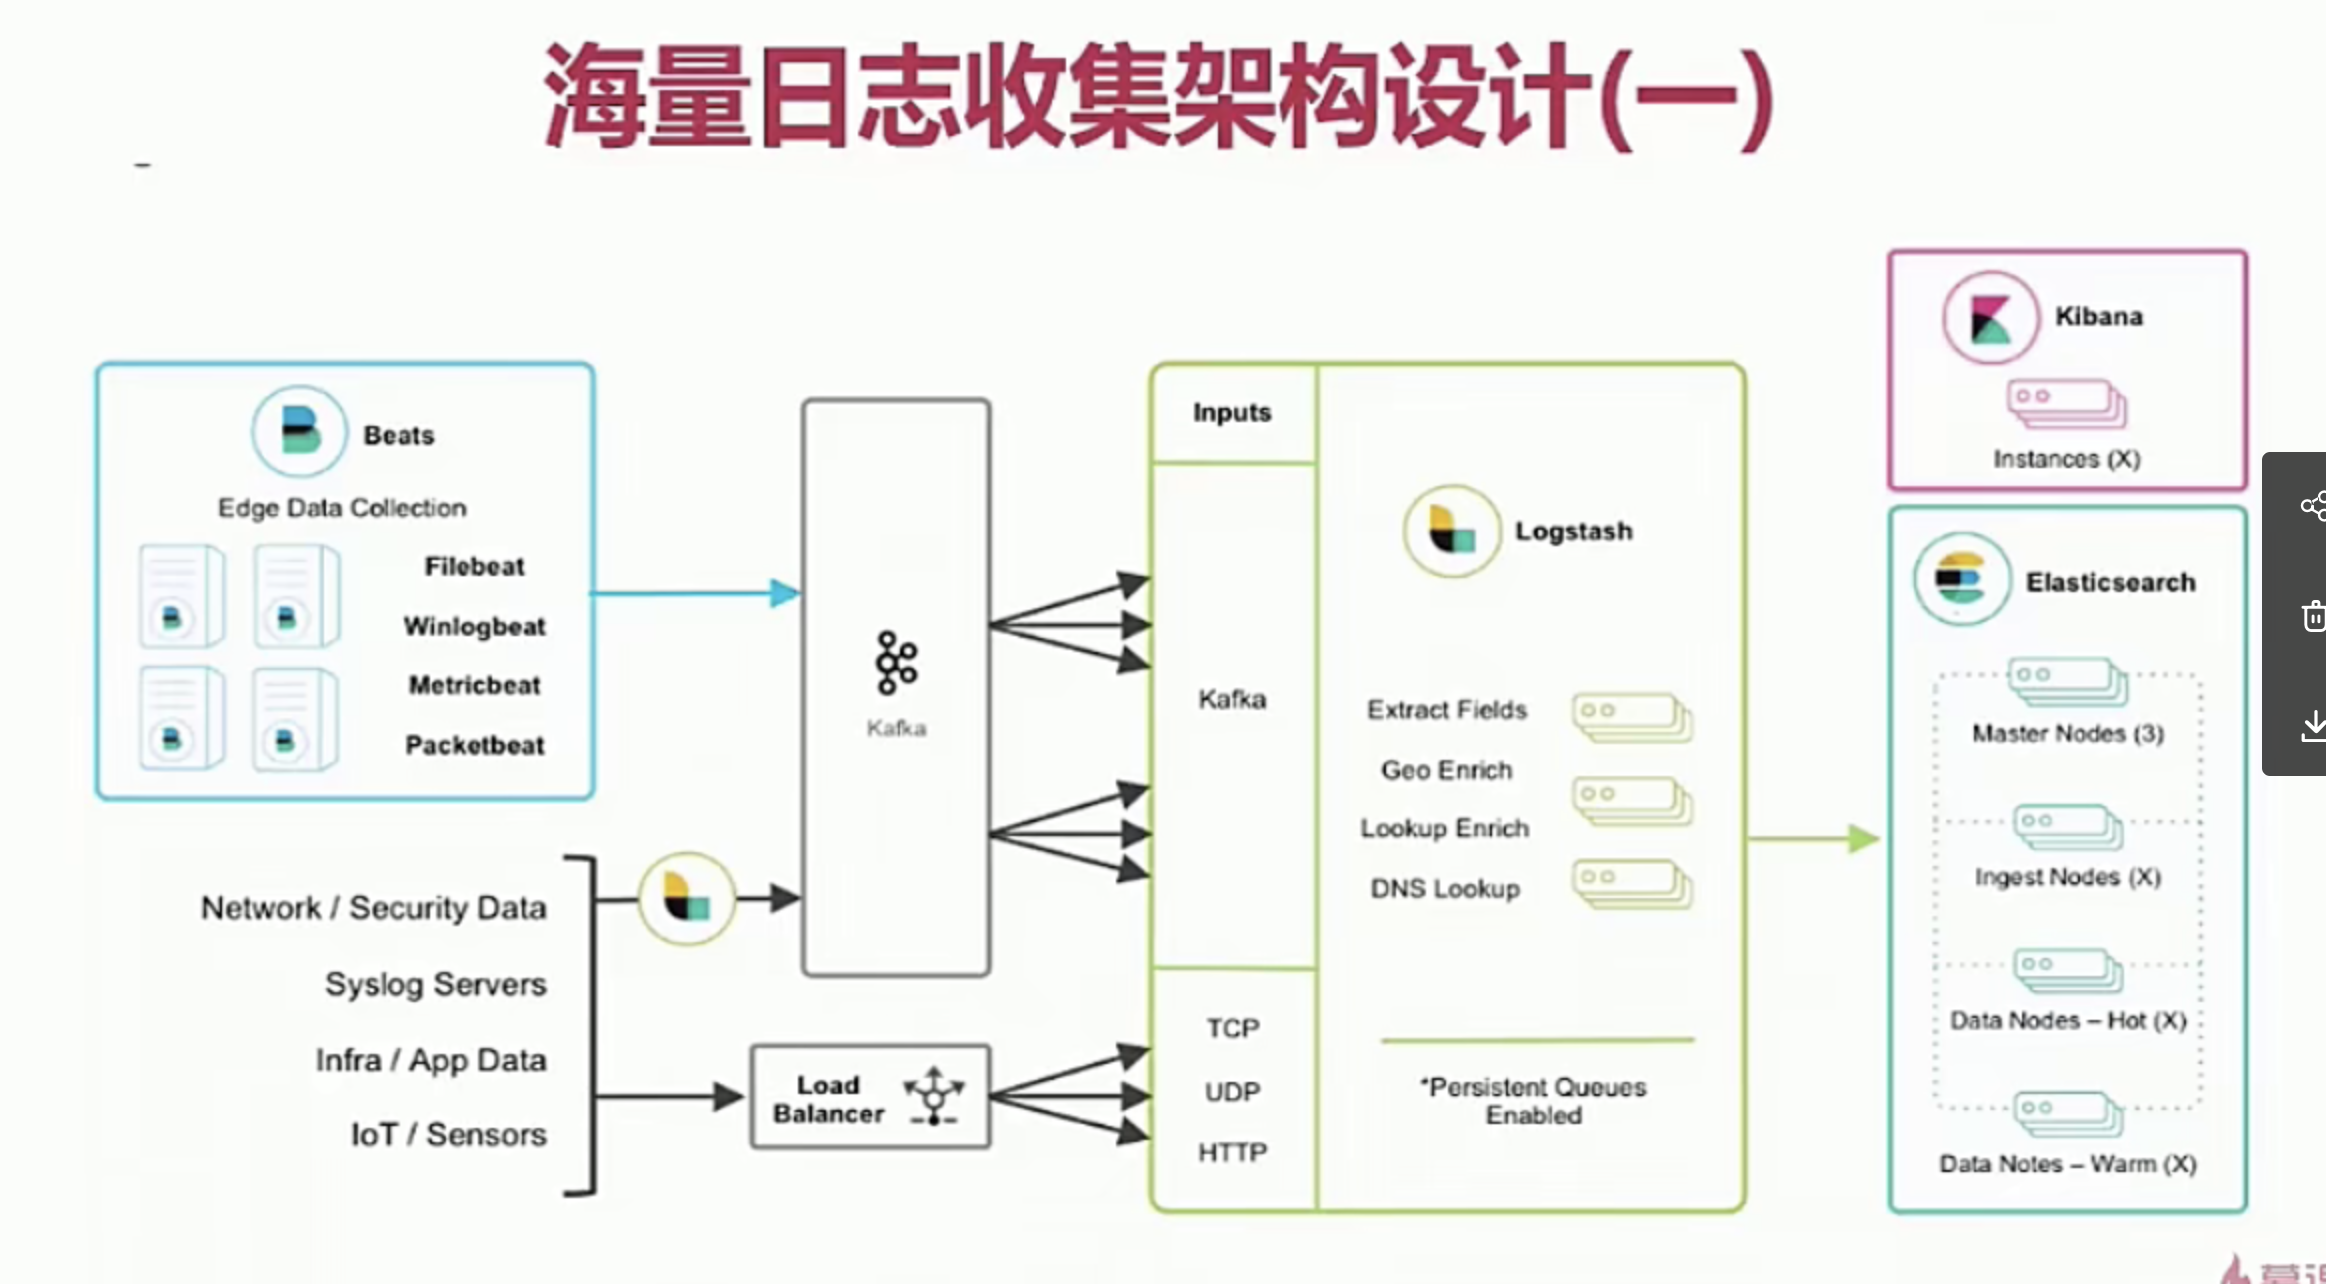
In the actual application scenario, in order to meet the real-time retrieval scenario of big data, Filebeat is used to monitor log files, and Kafka is used as the output of Filebeat. Kafka receives Filebeat in real time and outputs Logstash as the output. The data to Logstash may not be the data we want to format or specific business, At this time, you can filter the data through some plug-ins of Logstash, and finally achieve the desired data format. Take ElasticSearch as the output, and the data can be rich distributed retrieval when it is sent to ElasticSearch.
1 project creation
In this paper, logback is used as the log output framework and the springBoot architecture is adopted. The springBoot project is very simple. Only the logback log configuration is posted here (the classification and log format of each line in the configuration are very important for later log collection and kafka distribution)
1.1 logback configuration
The default logback is not used here XML auto import (auto import doesn't feel how the configuration works) set the name to logback-spring.xml and manually configure it into the springboot project
<?xml version="1.0" encoding="UTF-8"?>
<configuration scan="true" scanPeriod="10 seconds">
    <contextName>logback</contextName>
    <!--Attribute variables are used directly below, which can be used later ${app.name}use -->
    <property name="LOG_PATH" value="logs" />
    <property name="FILE_NAME" value="collector" />
    <property name="PATTERN_LAYOUT" value="[%d{yyyy-MM-dd'T'HH:mm:ss.SSSZZ}] [%level{length=5}] [%thread] [%logger] [%hostName] [%ip] [%applicationName] [%F,%L,%C,%M] %m ## '%ex'%n" />
    <!-- Color log -->
    <!-- Configure custom log format parameters, such as the following ip,Host name application name  -->
    <!--<conversionRule conversionWord="tid" converterClass="com.xiu.distributed.logcollection.config.LogBackIpConfig" />-->
    <conversionRule conversionWord="ip" converterClass="com.xiu.distributed.logcollection.config.LogBackIpConfig" />
    <conversionRule conversionWord="hostName" converterClass="com.xiu.distributed.logcollection.config.LogBackHostNameConfig" />
    <conversionRule conversionWord="applicationName" converterClass="com.xiu.distributed.logcollection.config.LogBackAppNameConfig" />

    <!--Output to console-->
    <appender name="CONSOLE" class="ch.qos.logback.core.ConsoleAppender">
        <!--A filter is defined,stay LEVEL The log output below will not be printed-->
        <!--Defined here DEBUG,That is, the console will not output ratio ERROR Low level logs-->
        <filter class="ch.qos.logback.classic.filter.ThresholdFilter">
            <level>info</level>
        </filter>
        <encoder>
            <!--Define console output format-->
            <Pattern>${PATTERN_LAYOUT}</Pattern>
            <charset>UTF-8</charset>
        </encoder>
    </appender>

    <!--output to a file-->
    <!-- Time scrolling output level by DEBUG journal -->
    <appender name="DEBUG_FILE" class="ch.qos.logback.core.rolling.RollingFileAppender">
        <file>${LOG_PATH}/log_debug.log</file>
        <!--Log file output format-->
        <encoder>
            <pattern>${PATTERN_LAYOUT}</pattern>
            <charset>UTF-8</charset> <!-- Set character set -->
        </encoder>
        <!-- The rolling strategy of the logger, recording by date and by size -->
        <rollingPolicy class="ch.qos.logback.core.rolling.TimeBasedRollingPolicy">
            <!-- Log archiving -->
            <fileNamePattern>${LOG_PATH}/log_debug_%d{yyyy-MM-dd}.%i.log</fileNamePattern>
            <timeBasedFileNamingAndTriggeringPolicy class="ch.qos.logback.core.rolling.SizeAndTimeBasedFNATP">
                <maxFileSize>100MB</maxFileSize>
            </timeBasedFileNamingAndTriggeringPolicy>
            <!--Log file retention days-->
            <maxHistory>7</maxHistory>
        </rollingPolicy>
        <!-- This log file only records debug Rank -->
        <filter class="ch.qos.logback.classic.filter.LevelFilter">
            <level>debug</level>
            <onMatch>ACCEPT</onMatch>
            <onMismatch>DENY</onMismatch>
        </filter>
    </appender>

    <!-- Time scrolling output level by INFO journal -->
    <appender name="INFO_FILE" class="ch.qos.logback.core.rolling.RollingFileAppender">
        <!-- The path and file name of the log file being recorded -->
        <file>${LOG_PATH}/log_info.log</file>
        <!--Log file output format-->
        <encoder>
            <pattern>${PATTERN_LAYOUT}</pattern>
            <charset>UTF-8</charset>
        </encoder>
        <!-- The rolling strategy of the logger, recording by date and by size -->
        <rollingPolicy class="ch.qos.logback.core.rolling.TimeBasedRollingPolicy">
            <!-- Daily log archive path and format -->
            <fileNamePattern>${LOG_PATH}/log_info_%d{yyyy-MM-dd}.%i.log</fileNamePattern>
            <timeBasedFileNamingAndTriggeringPolicy class="ch.qos.logback.core.rolling.SizeAndTimeBasedFNATP">
                <maxFileSize>100MB</maxFileSize>
            </timeBasedFileNamingAndTriggeringPolicy>
            <!--Log file retention days-->
            <maxHistory>7</maxHistory>
        </rollingPolicy>
        <!-- This log file only records info Rank -->
        <filter class="ch.qos.logback.classic.filter.LevelFilter">
            <level>info</level>
            <onMatch>ACCEPT</onMatch>
            <onMismatch>DENY</onMismatch>
        </filter>
    </appender>

    <!-- Time scrolling output level by WARN journal -->
    <appender name="WARN_FILE" class="ch.qos.logback.core.rolling.RollingFileAppender">
        <!-- The path and file name of the log file being recorded -->
        <file>${LOG_PATH}/log_warn.log</file>
        <!--Log file output format-->
        <encoder>
            <pattern>${PATTERN_LAYOUT}</pattern>
            <charset>UTF-8</charset> <!-- Set character set here -->
        </encoder>
        <!-- The rolling strategy of the logger, recording by date and by size -->
        <rollingPolicy class="ch.qos.logback.core.rolling.TimeBasedRollingPolicy">
            <fileNamePattern>${LOG_PATH}/log_warn_%d{yyyy-MM-dd}.%i.log</fileNamePattern>
            <timeBasedFileNamingAndTriggeringPolicy class="ch.qos.logback.core.rolling.SizeAndTimeBasedFNATP">
                <maxFileSize>100MB</maxFileSize>
            </timeBasedFileNamingAndTriggeringPolicy>
            <!--Log file retention days-->
            <maxHistory>7</maxHistory>
        </rollingPolicy>
        <!-- This log file only records warn Rank -->
        <filter class="ch.qos.logback.classic.filter.LevelFilter">
            <level>warn</level>
            <onMatch>ACCEPT</onMatch>
            <onMismatch>DENY</onMismatch>
        </filter>
    </appender>

    <!-- Time scrolling output level by ERROR journal -->
    <appender name="ERROR_FILE" class="ch.qos.logback.core.rolling.RollingFileAppender">
        <!-- The path and file name of the log file being recorded -->
        <file>${LOG_PATH}/log_error.log</file>
        <!--Log file output format-->
        <encoder>
            <pattern>${PATTERN_LAYOUT}</pattern>
            <charset>UTF-8</charset> <!-- Set character set here -->
        </encoder>
        <!-- The rolling strategy of the logger, recording by date and by size -->
        <rollingPolicy class="ch.qos.logback.core.rolling.TimeBasedRollingPolicy">
            <fileNamePattern>${LOG_PATH}/log_error_%d{yyyy-MM-dd}.%i.log</fileNamePattern>
            <timeBasedFileNamingAndTriggeringPolicy class="ch.qos.logback.core.rolling.SizeAndTimeBasedFNATP">
                <maxFileSize>100MB</maxFileSize>
            </timeBasedFileNamingAndTriggeringPolicy>
            <!--Log file retention days-->
            <maxHistory>7</maxHistory>
        </rollingPolicy>
        <!-- This log file only records ERROR Rank -->
        <filter class="ch.qos.logback.classic.filter.LevelFilter">
            <level>ERROR</level>
            <onMatch>ACCEPT</onMatch>
            <onMismatch>DENY</onMismatch>
        </filter>
    </appender>

    <!--For Classpaths, use xxxx initial  Logger,The output level is set to info,And only output to the console-->
    <!--this logger Not specified appender,It will inherit root Those defined in the node appender-->
    <!--additivity Indicates whether to use rootLogger Configured appender Output-->
    <logger name="org.apache.ibatis" level="INFO" additivity="false" />
    <logger name="org.mybatis.spring" level="INFO" additivity="false" />
    <logger name="com.github.miemiedev.mybatis.paginator" level="INFO" additivity="false" />

    <!-- root Is a default logger-->
    <root level="info">
        <appender-ref ref="CONSOLE" />
        <appender-ref ref="DEBUG_FILE" />
        <appender-ref ref="INFO_FILE" />
        <appender-ref ref="WARN_FILE" />
        <appender-ref ref="ERROR_FILE" />
        <!--<appender-ref ref="METRICS_LOG" />-->
    </root>

    <!--production environment :output to a file-->
    <!--<springProfile name="pro">-->
        <!--<root level="info">-->
            <!--<appender-ref ref="CONSOLE" />-->
            <!--<appender-ref ref="DEBUG_FILE" />-->
            <!--<appender-ref ref="INFO_FILE" />-->
            <!--<appender-ref ref="ERROR_FILE" />-->
            <!--<appender-ref ref="WARN_FILE" />-->
        <!--</root>-->
    <!--</springProfile>-->
</configuration>
Above, we focus on two points
Log format pattern:
[2021-12-30t22:05:01.025 + 0800] [error] [http-nio-8099-exec-1] [com.xiu.distributed.logcollection.web.indexcontroller] [pc-lr0940rk] [XX. XX. X.xx] [log collection] [indexcontroller.java, 31, com.xiu.distributed.logcollection.web.indexcontroller, err] arithmetic exception ##'java lang.ArithmeticException: / by zero
-
[%d{yyyy MM DD'T 'HH:mm:ss.SSSZZ}]: timestamp [2021-12-30T22:05:01.025+0800]
-
[% level{length=5}] log level info, warn, error, debug [ERROR]
-
[% thread] thread name [http-nio-8099-exec-1]
-
[% logger] current class [com.xiu.distributed.logcollection.web.IndexController]
-
[% hostName] hostName [PC-LR0940RK]
-
[% ip] host ip [xxx.xxxx.xx]
-
[% applicationName] application name [log collection]
-
[% F,%L,%C,%M] F class name abbreviation L number of calling lines C class name full name m calling method name [IndexController.java,31,com.xiu.distributed.logcollection.web.IndexController,err]
-
%m log printing information arithmetic exception
-
##'% ex' throw exception information if there is an exception ## 'Java lang.ArithmeticException: / by zero
-
%n newline
Log custom data settings
The above ip, hostname and applicationName need to be dynamically configured for different projects to obtain the inherited ClassicConverter
/**
 * @author xieqx
 * @className LogBackAppNameConfig
 * @desc Get the current application name and put it into logback
 * @date 2021/12/27 17:09
 **/
@Component
public class LogBackAppNameConfig extends ClassicConverter implements EnvironmentAware {
    private static Environment environment;
    private static String appName = "unKnownAppName";

    @Override
    public String convert(ILoggingEvent event) {
        try{
            appName = environment.getProperty("spring.application.name");
        }catch (Exception e){
        }
        return appName;
    }

    @Override
    public void setEnvironment(Environment environment) {
        LogBackAppNameConfig.environment = environment;
    }
}
1.2 springBoot integration logback
spring:
  application:
    name: log-collection
# tomcat service configuration
server:
  port: 8099
  tomcat:
    accept-count: 1000
    max-connections: 10000
    max-threads: 800
    min-spare-threads: 100

# logback log configuration
logging:
  config: classpath:logback-spring.xml
2. Filebeat installation
### 2.1 filebeat concept
Filebeat is a lightweight collector of log data for local files. Collect log events by monitoring the specified log file or location, and forward them to es, Logstash, kafka, etc. for subsequent processing.
2.2 working principle
When you start the filebeat program, It will start one or more probes to detect the specified log directory or file. For each log file, filebeat will start the harvester. Each harvesting process will read the new content of a log file and send these new log data to the handler (spooler), the handler will collect these events, and finally filebeat will send the collected data to the location you specify.
- prospector: responsible for managing the harvester and finding the source of all files to be read.
- harvester: responsible for reading the contents of a single file. Read each file and send the contents to the output.
2.3 installation and startup
#Download filebeat
wget https://artifacts.elastic.co/downloads/beats/filebeat/filebeat-6.0.1-linux-x86_64.tar.gz

#decompression
tar -zxvf filebeat-6.2.1-linux-x86_64.tar.gz -C /usr/local/filebeat

#Setting related configurations (modifying filebeat.yml) will be given separately later

#Check whether the filebeat configuration is correct
./filebeat -c filebeat.yml -configtest
Config OK #normal

#Start filebeat
./filebeat -e -c filebeat.yml >/dev/null 2>&1 &
2.4 filebeat configuration
Configure directly from log_info.log,log_warn.log,log_error.log is output to kafka's log info topic, log warn topic and log error topic respectively.
##################### Filebeat Configuration Example#########################

# For more available modules and options, please see the filebeat.reference.yml sample

#======================== Filebeat prospectors=======================

filebeat.prospectors
- input-type: log
### Multiline options
paths: '/home/coreapp/app/logs/log_info.log'
#Defines the type value written to kafka
document_type: log-info-topic
multiline:
 #Regular expression matching log
 pattern: '^\['
 # Match to
 negate: true
 #Merge to the end of the previous line
 match: after
 #Maximum number of rows
 max_lines: 2000
 #Timeout
 timeout: 2s
fields:
 # kafka service
 logbiz: log-collection
 # Kafka topic corresponding to the service
 logtopic: log-info-topic
 evn: dev


- input-type: log
paths: '/home/coreapp/app/logs/log_warn.log'
#Defines the type value written to es
document_type: log-warn-topic
multiline:
 #Regular expression matching log
 pattern: '^\['
 # Match to
 negate: true
 #Merge to the end of the previous line
 match: after
 #Maximum number of rows
 max_lines: 2000
 #Timeout
 timeout: 2s
fields:
 # kafka service
 logbiz: log-collection
 # Kafka topic corresponding to the service
 logtopic: log-warn-topic
 evn: dev

- input-type: log
paths: '/home/coreapp/app/logs/log_error.log'
#Defines the type value written to kafka
document_type: log-error-topic
multiline:
 #Regular expression matching log
 pattern: '^\['
 # Match to
 negate: true
 #Merge to the end of the previous line
 match: after
 #Maximum number of rows
 max_lines: 2000
 #Timeout
 timeout: 2s
fields:
 # kafka service
 logbiz: log-collection
 # Kafka topic corresponding to the service
 logtopic: log-error-topic
 evn: dev


#============================= Filebeat modules ===============================

filebeat.config.modules:
# Glob pattern for configuration loading
path: ${path.config}/modules.d/*.yml

# Set to true to enable config reloading
reload.enabled: false

# Period on which files under path should be checked for changes
#reload.period: 10s

#==================== Elasticsearch template setting==========================

setup.template.settings:
index.number_of_shards: 3
#index.codec: best_compression
#_source.enabled: false


#================================Output configuration=====================================
#--------------------------Output to kafka------------------------------
# Output log to kafka
output.kafka:
# kafka service node
hosts: ["xxx.xx.x.xxx:9092","xxx.xx.x.xxx:9093","xxx.xx.x.xxx:9094"]
# The topic of fields introduced by the above three different levels (info, warn and error) is dynamically referenced
topic: '%{[fields.logtopic]}'
partition.round_robin:
 reachable_only: true
# Compress file
compression: gzip
max_message_bytes: 1000000
#Number of ack acknowledgments received by the cluster
required_acks: 1

logging.to_files: true
kafaka installation configuration
3 logstash installation
3.1 logstash concept
Logstash is a real-time data collection engine, which can collect various types of data, analyze, filter and summarize them. Analyze and filter the qualified data according to their own conditions and import it into the visual interface.
3.2 working principle of logstash
3.3 installation and startup
# download
wget https://artifacts.elastic.co/downloads/logstash/logstash-6.0.1.tar.gz

# decompression
tar -zxvf logstash-6.0.1.tar.gz -C /usr/local/logstash/

# See 3.4 configuration details for configuration details

#Start logstash service
./bin/logstash -f script/logstash-script.conf &
3.4 configuration details
logstash configuration structure
#It is mainly divided into the following three modules
input {
  ...#To read data, logstash has provided many plug-ins, such as reading data from file, redis, syslog, etc
}

filter {
  ...#If you want to extract the concerned data from the irregular log, you need to process it here. Commonly used are grok, mutate, etc
}

output {
  ...#Output data, and output the data processed above to file, elastic search, etc
}
logstash detailed configuration
## Input the settings to logstash and configure kafka here
input {
  kafka {
    #Regular matching kafka topic
    topics => ["log-info-topic","log-warn-topic","log-error-topic"]
    # kafka service node configuration
    bootstrap_servers => "xxx.xx.x.xxx:9092,xxx.xx.x.xxx:9093,xxx.xx.x.xxx:9094"
    #Used to process json data
    codec => json
    #Set the number of parallel consumption threads of the consumer
    consumer_threads => 2
    decorate_events => true
    #Which offset of consumption kafka from message
    auto_offset_reset => "latest"
    #Consumption grouping
    group_id => "log-topic-group"
  }
}

# Output filtering
filter {
   ## Time zone conversion
   ruby {
     code => "event.set('index_time',event.timestamp.time.localtime.strftime('%Y.%M.%d'))"
   }

   if "log-info-topic" in [fields][logtopic]{
     grok {
        ## The expression will not be output to es until the batch is successful
        #The format is based on the log output format configured by logback above
       match => ["message", "\[%{NOTSPACE:currentDateTime}\] \[%{NOTSPACE:level}\] \[%{NOTSPACE:thread-id}\] \[%{NOTSPACE:class}\] \[%{DATA:hostName}\] \[%{DATA:ip}\] \[%{DATA:applicationName}\] \[%{DATA:location}\] \[%{DATA:messageInfo}\] ## (\'\'|%{QUOTEDSTRING:throwable})"]
     }
   }
   if "log-warn-topic" in [fields][logtopic]{
     grok {
        ## expression
        match => ["message","\[%{NOTSPACE:currentDateTime}]\[%{NOTSPACE:level}]\[%{NOTSPACE:thread-id}]\[%{NOTSPACE:class}]\[%{DATA:hostName}]\[%{DATA:ip}]\[%{DATA:applicationName}]\[%{DATA:location}]\[%{DATA:messageInfo}]## (\'\'|%{QUOTEDSTRING:throwable}"]
     }
   }
   if "log-error-topic" in [fields][logtopic]{
     grok {
        ## expression
        match => ["message","\[%{NOTSPACE:currentDateTime}]\[%{NOTSPACE:level}]\[%{NOTSPACE:thread-id}]\[%{NOTSPACE:class}]\[%{DATA:hostName}]\[%{DATA:ip}]\[%{DATA:applicationName}]\[%{DATA:location}]\[%{DATA:messageInfo}]## (\'\'|%{QUOTEDSTRING:throwable}"]
     }
   }
}

#Set multiple input streams
#Set the output stream output console of logstash (convenient for debugging and viewing)
output {
  stdout { codec => rubydebug }
}


#Set the output stream of logstash. The configuration here is es
output {
  if "log-info-topic" in [fields][logtopic]{
     ## es plug-in
     elasticsearch {
       # es service address
       hosts => ["xxx.xx.x.xxx:9200"]
       #Username and password
       #user => "elastic"
       #password => "123456"
       ## Set index prefix
       index => "log-topic-%{[fields][logbiz]}-%{index_time}"
       # Load balancing of es cluster through sniffing mechanism and sending log information
       sniffing => true
       # logstash comes with a mapping template by default to overwrite the template
       template_overwrite => true
     }
  }
  if "log-warn-topic" in [fields][logtopic]{
     ## es plug-in
     elasticsearch {
       # es service address
       hosts => ["xxx.xx.x.xxx:9200"]
       #Username and password
       #user => "elastic"
       #password => "123456"
       ## Set index prefix
       index => "log-topic-%{[fields][logbiz]}-%{index_time}"
       # Load balancing of es cluster through sniffing mechanism and sending log information
       sniffing => true
       # logstash comes with a mapping template by default to overwrite the template
       template_overwrite => true
     }
  }
   if "log-error-topic" in [fields][logtopic]{
     ## es plug-in
     elasticsearch {
       # es service address
       hosts => ["xxx.xx.x.xxx:9200"]
       #Username and password
       #user => "elastic"
       #password => "123456"
       ## Set index prefix
       index => "log-topic-%{[fields][logbiz]}-%{index_time}"
       # Load balancing of es cluster through sniffing mechanism and sending log information
       sniffing => true
       # logstash comes with a mapping template by default to overwrite the template
       template_overwrite => true
     }
  }
}
4 es installation
4.1 es framework concept
Elasticsearch is an open source system with search engine and NoSQL database functions. It is built based on Java/Lucene and can be used for full-text search, structured search and near real-time analysis
4.2 installation and startup
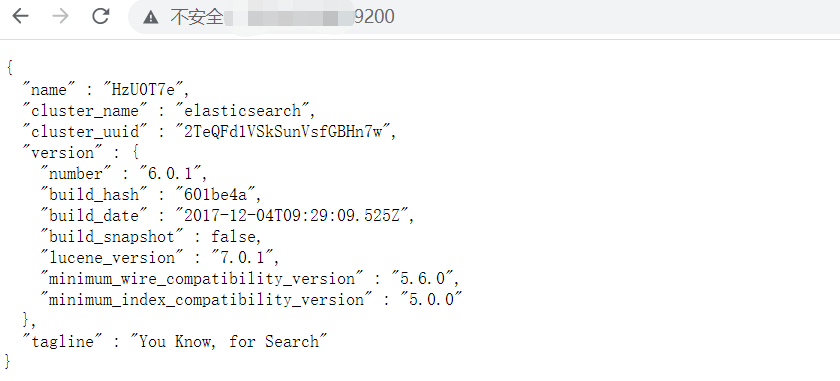
#Download es
https://artifacts.elastic.co/downloads/elasticsearch/elasticsearch-6.0.1.tar.gz

#Unzip project
tar -zxvf elasticsearch-6.0.1.tar.gz -C /usr/local/elasticSearch/

#Because the es service cannot be started directly by the root user
#Therefore, you need to create a new user es and give the user es permission
adduser es
chown -R es /usr/local/elasticSearch/elasticsearch-6.0.1

#Start es and switch to es user
su es
./bin/elasticsearch &


#Set up remote access
#Modify elasticsearch. In config yml
#Configure ip
network.host: xxx.xx.x.xxx
#configure port
http.port: 9200

#Restart es
# Possible startup error
#max virtual memory areas vm.max_map_count [65530] is too low, increase to at #least [262144]


vi /etc/sysctl.conf
vm.max_map_count=655360
sysctl -p
#Restart again
Successful browser access is shown as follows
5,kbnana
5.1 introduction to kibana framework
Kibana is an open source analysis and visualization platform designed for and Elasticsearch Used together. You can use kibana to search, view and interact with the data stored in the Elasticsearch index. Kibana can easily display advanced data analysis and visualization by using various charts, tables, maps, etc.
5.2 installation and startup
#download
wget https://artifacts.elastic.co/downloads/kibana/kibana-6.0.1-linux-x86_64.tar.gz

#Enter the directory and unzip
tar -zxvf kibana-6.0.1-linux-x86_64.tar.gz

#Modify configuration
#Configure native ip
server.port:9201
server.host: "xxx.xxx.xxx.xxx"
#Configure es cluster url
elasticsearch.url: "http://xxx.xxx.xxx.xxx:9200"

# Start es service
./bin/kibnana &
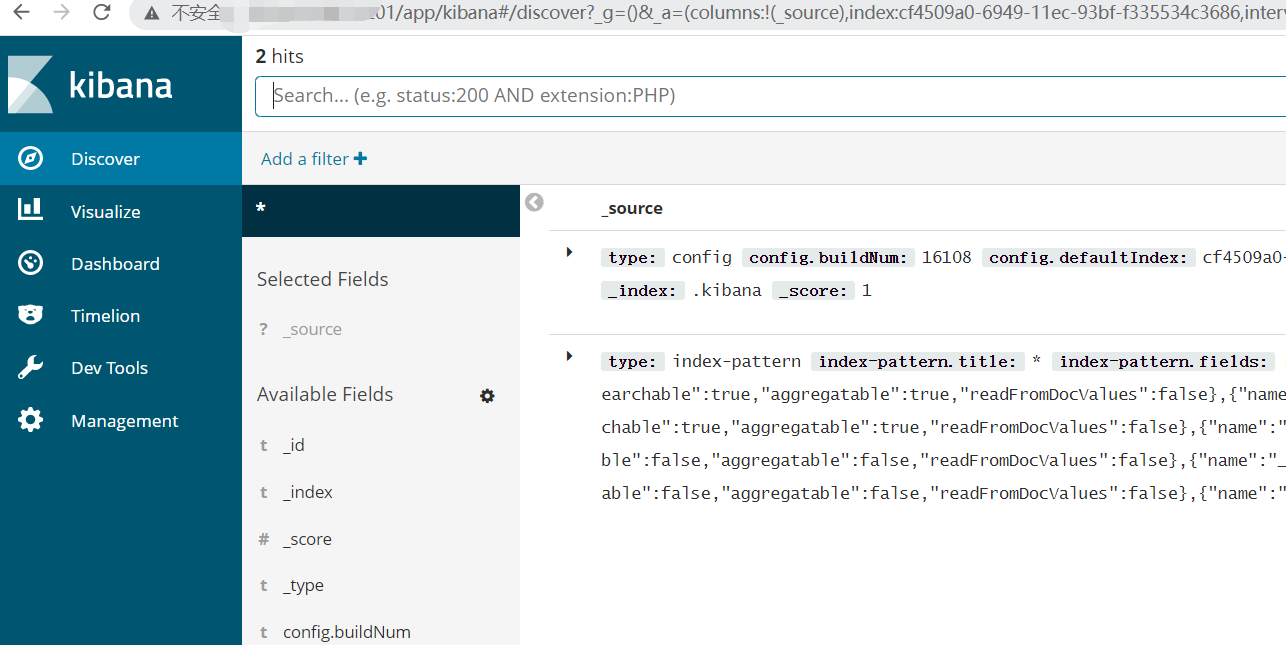
verification
Start successfully accessing ip port
6 log collection verification
Add http interface to trigger log collection
@Slf4j
@RestController
public class IndexController {
   @RequestMapping(value = "/index")
   public String index() {
      log.info("I am a info journal");
      log.warn("I am a warn journal");
      log.error("I am a error journal");
      return "idx";
   }
   @RequestMapping(value = "/err")
   public String err() {
      try {
         int a = 1/0;
      } catch (Exception e) {
         log.error("Arithmetic anomaly", e);
         log.info("Arithmetic anomaly", e);
         log.warn("Arithmetic anomaly", e);
      }
      return "err";
   }
}
Request the url address through the page to trigger the log output. Finally, check whether the log is collected through kibana, and see the log successfully from kibana
