@
Distributed log ELK Stack of Elasticsearch: https://blog.csdn.net/weixin_...
Elasticsearch official user manual: https://www.elastic.co/guide/...
Kibana official user manual: https://www.elastic.co/guide/...
Basic introduction
- What is distributed logging
In distributed applications, logs are distributed on different storage devices. If you manage dozens or hundreds of servers, you are still using the traditional method of logging in to each machine in turn. Does this feel cumbersome and inefficient. Therefore, we use centralized log management. Distributed log is to collect, track and process large-scale log data.
- Why use distributed logging
Generally, we need log analysis scenarios: you can get the information you want directly in the log file grep and awk. However, in large-scale scenarios, this method is inefficient and faces problems, including how to archive if the log volume is too large, what to do if the text search is too slow, and how to query in multiple dimensions. Centralized log management is required to collect and summarize logs on all servers. The common solution is to establish a centralized log collection system to collect, manage and access the logs on all nodes.
- ELK distributed log
In fact, ELK is the abbreviation of three software, which are composed of Elasticsearch, Logstash and Kibana.
Elasticsearch is an open source distributed search engine based on java. Its characteristics include: distributed, zero configuration, automatic discovery, automatic index fragmentation, index copy mechanism, restful style interface, multiple data sources, automatic search load, etc.
Kibana is an open source and free tool based on nodejs. Kibana can provide log analysis friendly Web interface for Logstash and ElasticSearch, and can summarize, analyze and search important data logs.
Based on java, Logstash is an open source tool for collecting, analyzing and storing logs.
The following is how ELK works: 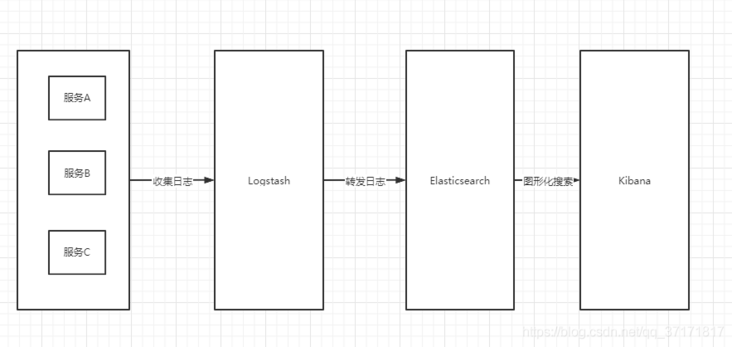
ElasticSearch
brief introduction
Elasticsearch is a Lucene based search server. It provides a distributed multi-user full-text search engine based on RESTful web interface. Elasticsearch is developed in Java and released as an open source under the Apache license terms. It is a popular enterprise search engine. Designed for cloud computing, it can achieve real-time search, stable, reliable, fast, easy to install and use.
We build a website or application and add search function, but it is very difficult to complete the creation of search work. We want the search solution to run fast. We want to have a zero configuration and a completely free search mode. We want to simply use JSON to index data through HTTP. We want our search server to be always available. We want to start from one and expand to hundreds. We want real-time search and we want simple multi tenancy, We want to build a cloud solution. Therefore, we use Elasticsearch to solve all these problems and more other problems that may arise.
Elasticsearch is the core of Elastic Stack. At the same time, Elasticsearch is a distributed and RESTful search and data analysis engine, which can solve various emerging use cases. As the core of Elastic Stack, it centrally stores your data and helps you find unexpected and unexpected situations.
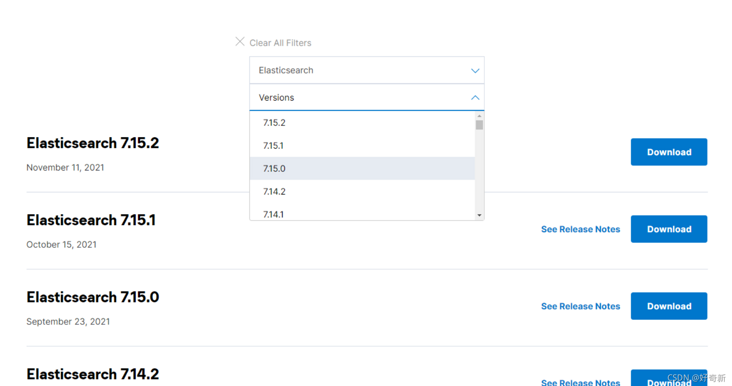
download
Select the required version. At present, the higher version already needs JDK11 support
I use 7.13 + JDK 1.8 both locally and on the server. I tried version 7.15, which is not supported
install
Windows
/elasticsearch
perhaps
bin/elasticsearch.bat
Linux
- Unzip to the appropriate directory
tar -zxvf elasticsearch-7.10.2-linux-x86_64.tar.gz -C /usr/local
- Modify configuration
cd /usr/local/elasticsearch-7.10.2/config/
vim elasticsearch.yml
node.name: node-1
path.data: /usr/local/elasticsearch-7.10.2/data
path.logs: /usr/local/elasticsearch-7.10.2/logs
network.host: 127.0.0.1
http.host: 0.0.0.0
http.port: 9200
discovery.seed_hosts: ["127.0.0.1"]
cluster.initial_master_nodes: ["node-1"]
- Create an es user. Because ElasticSearch does not support direct operation by Root users, we need to create an es user
useradd es
chown -R es:es /usr/local/elasticsearch-7.10.2
start-up
- Switch user to es user for operation
su - es
/usr/local/elasticsearch-7.10.2/bin/elasticsearch
- Background start
/usr/local/elasticsearch-7.10.2/bin/elasticsearch -d
Open 9200 port address in browser:( http://120.78.129.95:9200/ (opens new window) ), if the following message appears, it indicates that it has been started successfully 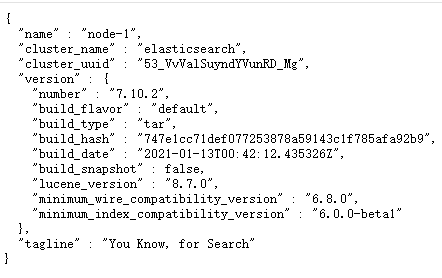
security setting
Modify profile
Modify the elasticsearch.yml file under the config directory, add the following contents to it, and restart
Turn off security
xpack.security.enabled: false
Turn on security settings
xpack.security.enabled: true
xpack.license.self_generated.type: basic
xpack.security.transport.ssl.enabled: true
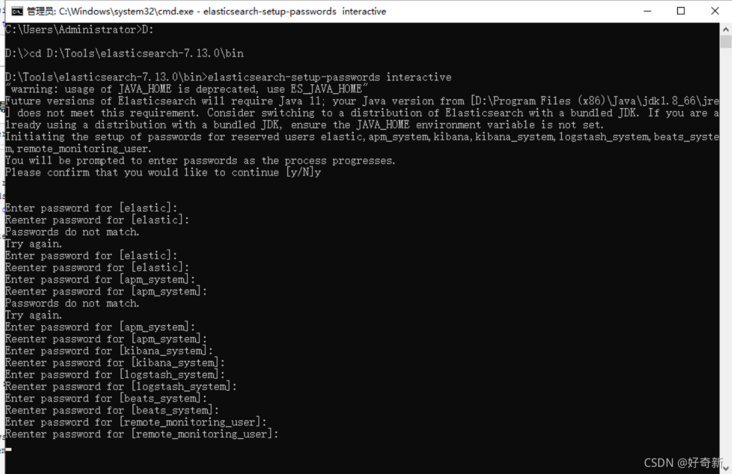
Set user name and password
Here, you need to set passwords for four users, elastic, kibana and logstash_ system,beats_ system
elastic account: it has the super user role and is a built-in super user.
Kibana account: own kibana_system role. Kibana is used to connect and communicate with elasticsearch. The kibana server submits a request as the user to access the cluster monitoring API and the. Kibana index. Cannot access index.
logstash_system account: own logstash_system role. The user Logstash is used when storing monitoring information in Elasticsearch.
cmd command line, enter the ES installation directory, and run the following command line
The user name and password are set implicitly here, not the keyboard
bin/elasticsearch-setup-passwords interactive
Modify user name and password
Linux server
-- Create superuser TestSuper
elasticsearch-users useradd TestSuper -r superuser
-- Change password through interface
 curl -H "Content-Type:application/json" -XPOST -u elastic:now_password 'http://10.10.17.19:9200/_xpack/security/user/elastic/_password' -d '{ "password" : "123456" }'
windows
Reassembly method
Incomplete, crashed, restarting...
Logstash
brief introduction
Logstash is an open source server-side data processing pipeline, which can collect data from multiple sources at the same time, convert data, and then send data to your favorite repository (our repository is ElasticSearch of course)
download
Download from the official website:( https://www.elastic.co/cn/downloads/logstash (opens new window))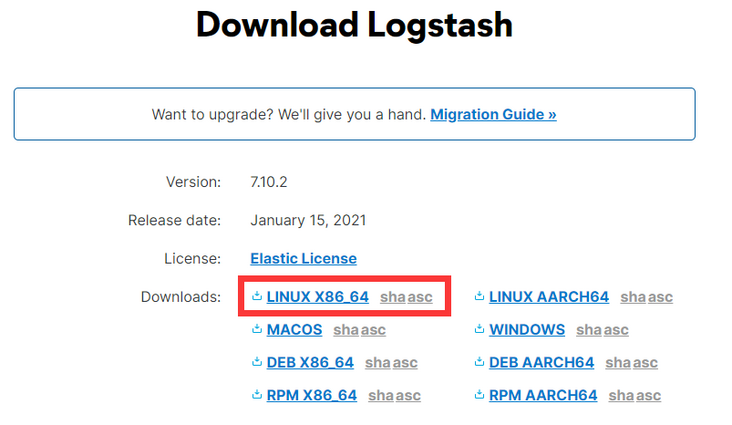
install
- Unzip to the appropriate directory
tar -zxvf logstash-7.10.2.tar.gz -C /usr/local
- New profile
cd /usr/local/logstash-7.10.2/bin
vim logstash-elasticsearch.conf
input {
    stdin {}
}
output {
    elasticsearch {
        hosts => '120.78.129.95:9200'
    }
    stdout {
        codec => rubydebug
    }
}
start-up
./logstash -f logstash-elasticsearch.conf
Kibana
brief introduction
Kibana is an open source data analysis and visualization platform. It is a member of Elastic Stack and is designed to cooperate with Elasticsearch. You can use kibana to search, view and interact with the data in Elasticsearch index. You can easily use charts, tables and maps to analyze and present the data in a variety of ways.
download
The same version as es is required
Download from the official website:( https://www.elastic.co/cn/downloads/kibana (opens new window))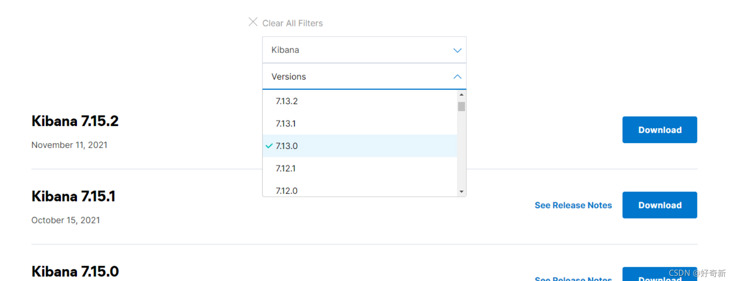
install
- Unzip to the appropriate directory
tar -zxvf kibana-7.10.2-linux-x86_64.tar.gz -C /usr/local
mv /usr/local/kibana-7.10.2-linux-x86_64 /usr/local/kibana-7.10.2
- Modify configuration
cd /usr/local/kibana-7.10.2/config
vim kibana.yml
server.port: 5601
server.host: "0.0.0.0"
elasticsearch.hosts: ["http://120.78.129.95:9200"]
kibana.index: ".kibana"
- Authorized es user
chown -R es:es /usr/local/kibana-7.10.2/
start-up
- Switch user to es user for operation
su - es
/usr/local/kibana-7.10.2/bin/kibana
- Background start
/usr/local/kibana-7.10.2/bin/kibana &
Open 5601 port address in browser:( http://120.78.129.95:5601/ (opens new window) ), if the following message appears, it indicates that it has been started successfully 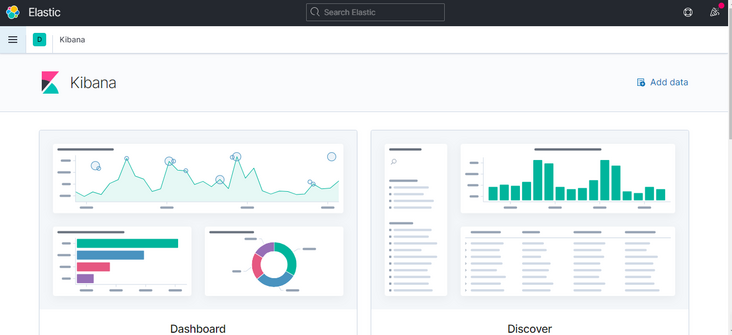
Switch Chinese
Add in config/kibana.yml
i18n.locale: "zh-CN"
Log collection
Install logstash on the corresponding server and configure rules, for example, create a new logstash-apache.conf
input {
  file {
    path => "/home/ruoyi/logs/sys-*.log"
    start_position => beginning
    sincedb_path => "/dev/null"
    codec => multiline {
      pattern => "^\d{4}-\d{2}-\d{2} \d{2}:\d{2}:\d{2}"
      negate => true
      auto_flush_interval => 3
      what => previous
    }
  }
}

filter {
  if [path] =~ "info" {
    mutate { replace => { type => "sys-info" } }
    grok {
      match => { "message" => "%{COMBINEDAPACHELOG}" }
    }
    date {
      match => [ "timestamp" , "dd/MMM/yyyy:HH:mm:ss Z" ]
    }
  } else if [path] =~ "error" {
    mutate { replace => { type => "sys-error" } }
  } else {
    mutate { replace => { type => "random_logs" } }
  }
}

output {
  elasticsearch {
    hosts => '120.78.129.95:9200'
  }
  stdout { codec => rubydebug }
}- Start logstash
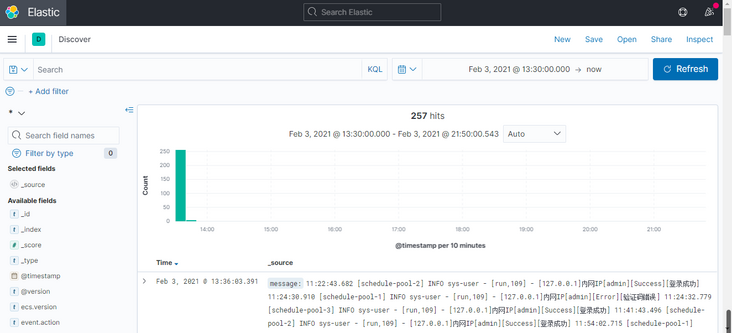
./logstash -f logstash-apache.conf
- Visual retrieval of service log data through kibana
reference resources