GrayLog brief introduction
GrayLog is a lightweight distributed log management platform, an open source log aggregation, analysis, audit, display and early warning tool. In terms of function, it is similar to ELK, but it is much simpler and lighter than ELK. Relying on the advantages of more concise, efficient and simple deployment and use, it is quickly favored by many companies.
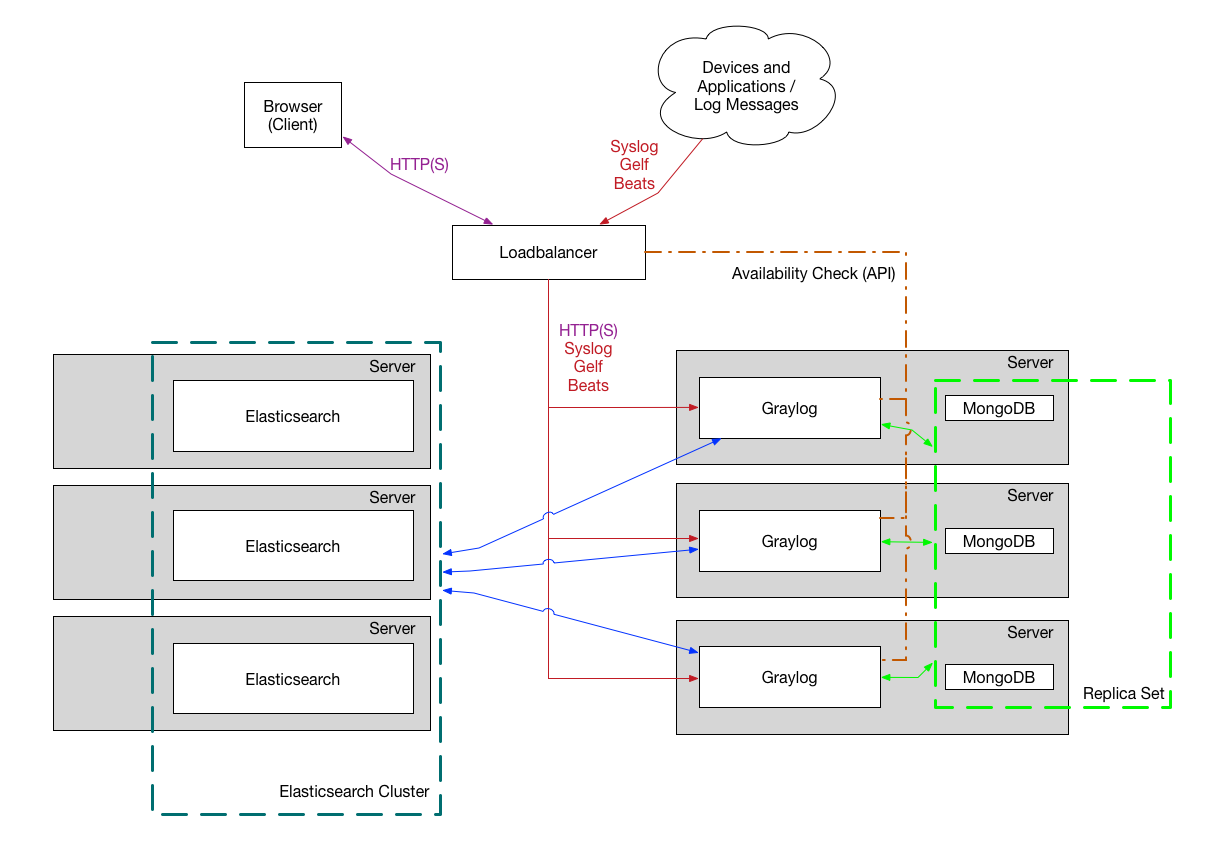
Graylog includes elasticsearch, MongoDb and Graylog modules. Elasticsearch is used to persistently store and retrieve log file data, MongoDb is used to store relevant configurations about Graylog, and Graylog is used to provide Web interface and external interface.
- Stand alone deployment

-
Cluster deployment

GrayLog function analysis
Simply put, Input represents the source of log data. For logs from different sources, you can use Extractors to convert the log fields. Then, different tag types are used to form different streams, and these log data are stored in the specified Elastic Index library for persistent storage.
| Component name | Function introduction | main features |
|---|---|---|
| Dashboards | Fixed display of data panel | It is mainly used to save the data panel of specific search conditions |
| Searching | Log information condition search | Keyword search, time search, search save, create panel, group query, result export, query highlight, custom time |
| Alert | Set alarm prompt mode | Support email alarm, HTTP callback and user-defined script triggering |
| Inputs | Log data capture and reception | Deploy Sidercar to actively capture or passively report using other services |
| Extractors | Log data format conversion | json parsing, kv parsing, timestamp parsing, regular parsing |
| Streams | Classification and grouping of log information | Set log classification conditions and send them to different index files |
| Indices | Persistent data storage | Set data storage performance |
| Outputs | Forwarding of log data | The parsed Stream is sent to other Graylog clusters or services |
| Pipelines | Filtering of log data | Establish filtering rules for data cleaning, field addition and deletion, conditional filtering, user-defined functions, etc |
| Sidecar | Lightweight log collector | Equivalent to C/S mode; Use in large scale |
| Lookup Tables | Service resolution | IP based Whois query and source IP based intelligence monitoring |
| Geolocation | Visual geographic location | Realize intelligence monitoring based on source IP |
reference resources: https://docs.graylog.org/docs/
https://blog.csdn.net/wjandy0211/article/details/108485836
https://blog.csdn.net/qianshangding0708/article/details/121312622
Single machine deployment GrayLog
Using docker compose is easy and fast to install. Refer to the official website document Docker - Installing Graylog
Statement: this installation is based on CentOS 8
Docker compose file
version: '3'
services:
    mongo:
      image: mongo:4.2
      networks:
        - graylog
    elasticsearch:
      image: docker.elastic.co/elasticsearch/elasticsearch-oss:7.10.2
      environment:
        - http.host=0.0.0.0
        - transport.host=localhost
        - network.host=0.0.0.0
        - "ES_JAVA_OPTS=-Dlog4j2.formatMsgNoLookups=true -Xms512m -Xmx512m"
      ulimits:
        memlock:
          soft: -1
          hard: -1
      deploy:
        resources:
          limits:
            memory: 1g
      networks:
        - graylog
    graylog:
      image: graylog/graylog:4.2
      environment:
        - GRAYLOG_PASSWORD_SECRET=somepasswordpepper
        - GRAYLOG_ROOT_PASSWORD_SHA2=8c6976e5b5410415bde908bd4dee15dfb167a9c873fc4bb8a81f6f2ab448a918 #Default password: admin
        - GRAYLOG_HTTP_EXTERNAL_URI=http://ip:9000/ 	#  Modify the IP address to your own
        - GRAYLOG_ROOT_TIMEZONE=Asia/Shanghai         #Set time zone
        - GRAYLOG_ALLOW_HIGHLIGHTING=true             #Search highlight
      entrypoint: /usr/bin/tini -- wait-for-it elasticsearch:9200 --  /docker-entrypoint.sh
      networks:
        - graylog
      restart: always
      depends_on:
        - mongo
        - elasticsearch
      ports:
        - 9000:9000
        - 1514:1514
        - 1514:1514/udp
        - 12201:12201
        - 12201:12201/udp
networks:
    graylog:
      driver: bridge
The file is copied from the official website document. I modified three places, namely, the ip and port of accessing the graylog web page, setting the time zone and turning on the highlighting of search content. For more configurations, including custom configuration files and persistent data, please refer to the official documents.
Run the following command in the directory where the docker compose file is located to start graylog
docker-compose up -d #-d start with daemon
After successful startup, access the ip:port set above to enter the background address of graylog. The default account password is admin/admin

Configure the input, that is, the data source of graylog, and use udp to receive logs. Then click the launch new input button, just enter the Title to save, and other defaults are OK.


spring integrates graylog
Generally, our programs will use logback or other logging frameworks to collect logs. To display our business logs, you only need to write the log data to graylog.
1. Introduce dependency
<dependency>
 <groupId>de.siegmar</groupId>
 <artifactId>logback-gelf</artifactId>
 <version>3.0.0</version>
</dependency>
GELF extension: a log format, which can avoid some problems of syslogs in the traditional sense. The Maven dependency we introduced is to format the log into GELF format and then append it to GrayLog
https://docs.graylog.org/docs/gelf
2. On logback Add the following code to the XML file
<appender name="GELF" class="de.siegmar.logbackgelf.GelfUdpAppender">
    <!-- Graylog Address of the service -->
    <graylogHost>IP</graylogHost>
    <!-- UDP Input port -->
    <graylogPort>12201</graylogPort>
    <!-- maximum GELF Data block size (in bytes), 508 is the recommended minimum and 65467 is the maximum -->
    <maxChunkSize>508</maxChunkSize>
    <!-- Use compression -->
    <useCompression>true</useCompression>
    <encoder class="de.siegmar.logbackgelf.GelfEncoder">
      <!-- Send native log information -->
      <includeRawMessage>false</includeRawMessage>
      <includeMarker>true</includeMarker>
      <includeMdcData>true</includeMdcData>
      <includeCallerData>false</includeCallerData>
      <includeRootCauseData>false</includeRootCauseData>
      <!-- Whether to send the name of the log level. Otherwise, the log level is represented by a number by default -->
      <includeLevelName>true</includeLevelName>
      <shortPatternLayout class="ch.qos.logback.classic.PatternLayout">
        <pattern>%m%nopex</pattern>
      </shortPatternLayout>
      <fullPatternLayout class="ch.qos.logback.classic.PatternLayout">
        <pattern>%d - [%thread] %-5level %logger{35} - %msg%n</pattern>
      </fullPatternLayout>

      <!-- Configure the application name (service name) through staticField The tag can customize some fixed log fields -->
      <staticField>app_name:boss</staticField>
    </encoder>
</appender>
Note: change the IP address to your own.
3. Start the program and open the background page of grayog to see the log information.

GrayLog common query syntax
Here are some query syntax commonly used by GrayLog. For more syntax, you can check the official website documents: https://docs.graylog.org/docs/query-language
1. Accurate query by field: full_message:"sys"
2. Query by log level: level_name:"ERROR"
3. Combined multi field query: app_name:"boss" AND full_message:"sys" AND level_name:"DEBUG"
More operations
The functions of GrayLog are far more than these, and more relevant usages can be explored by yourself.
https://blog.csdn.net/abu935009066/article/details/119030784
reference resources Official documents