1. Preface
When using Django for Web development, there is often a need to display charts to enrich the data display of Web pages. Common schemes include Highcharts, Matplotlib, Echarts and Pyecharts. The latter two schemes are used more frequently. This article will talk about the specific process of chart visualization by Django combined with # Echarts and Pyecharts
2. Echarts
Echarts is a very excellent visualization framework of Baidu open source, which can display very complex chart types. Take the simple histogram as an example, let's talk about the process of Django integrating echarts.
First, in an App's views Py write the view function. When the request method is POST, define the data value in the histogram, and then use JsonResponse to return the data
from django.http import JsonResponse
from django.shortcuts import render


def index_view(request):
    if request.method == "POST":

        #Histogram data
        datas = [5, 20, 36, 10, 10, 20]

        #Return data
        return JsonResponse({'bar_datas': datas})
    else:
        return render(request, 'index.html', )
In the template file, import the dependencies of} Echarts
PS: you can use local JS files or CDN acceleration services
{#Import js and echarts rely on#}
<script src="https://cdn.bootcdn.net/ajax/libs/jquery/3.6.0/jquery.js"></script>
<script src="https://cdn.bootcdn.net/ajax/libs/echarts/5.0.2/echarts.common.js"></script>
Then, rewrite window Onload function, send an} Ajax request to the back end, and display the returned results in the chart using Echarts
<script>
//Histogram
function show_bar(data) {
//control
var bar_widget = echarts.init(document.getElementById('bar_div'));
//Set option
option = {
title: {
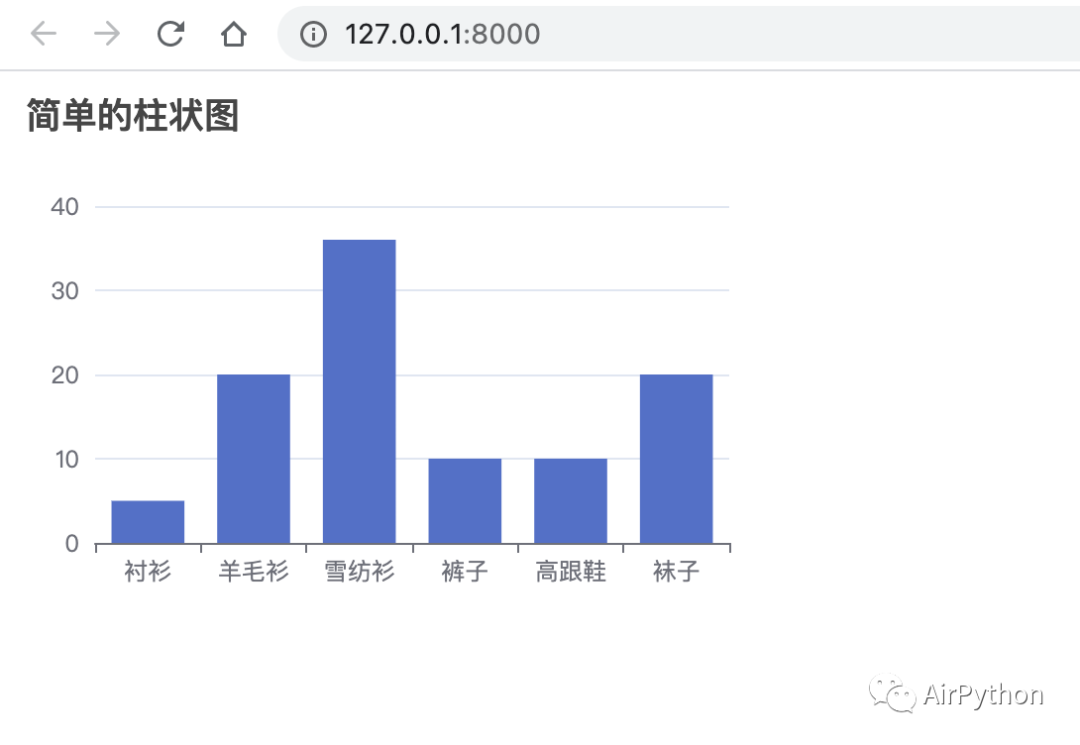
text: 'Simple histogram'
},
tooltip: {},
legend: {
data: ['sales volume']
},
xAxis: {
type: 'category',
data: ["shirt", "cardigan", "Chiffon shirt", "trousers", "high-heeled shoes", "Socks"]
},
yAxis: {
type: 'value'
},
series: [{
data: data,
type: 'bar'
}]
};
bar_widget.setOption(option)
}
//Load on display call
window.onload = function () {
//Send a post request with the address index (Jquery)
$.ajax({
url: "/",
type: "POST",
data: {},
success: function (data) {
//Histogram
show_bar(data['bar_datas']);
//Results returned by the backend
console.log(data)
}
})
}
</script>
Finally, write the routing URL and run the project
from django.contrib import admin
from django.urls import path, include

urlpatterns = [
    path('',include('index.urls')),
    path('admin/', admin.site.urls),
]
It is found that the home page shows a simple histogram
For more complex chart displays, please refer to the official
https://echarts.apache.org/examples/zh/index.html
3. Pyecharts
Pyecharts is an open source framework that encapsulates Echarts in Python
Compared with Echarts, Django integrates Pyecharts more quickly and conveniently
Django only needs 4} steps to integrate Pyecharts
3-1} installation dependency
#Installation dependency
pip(3) install pyecharts
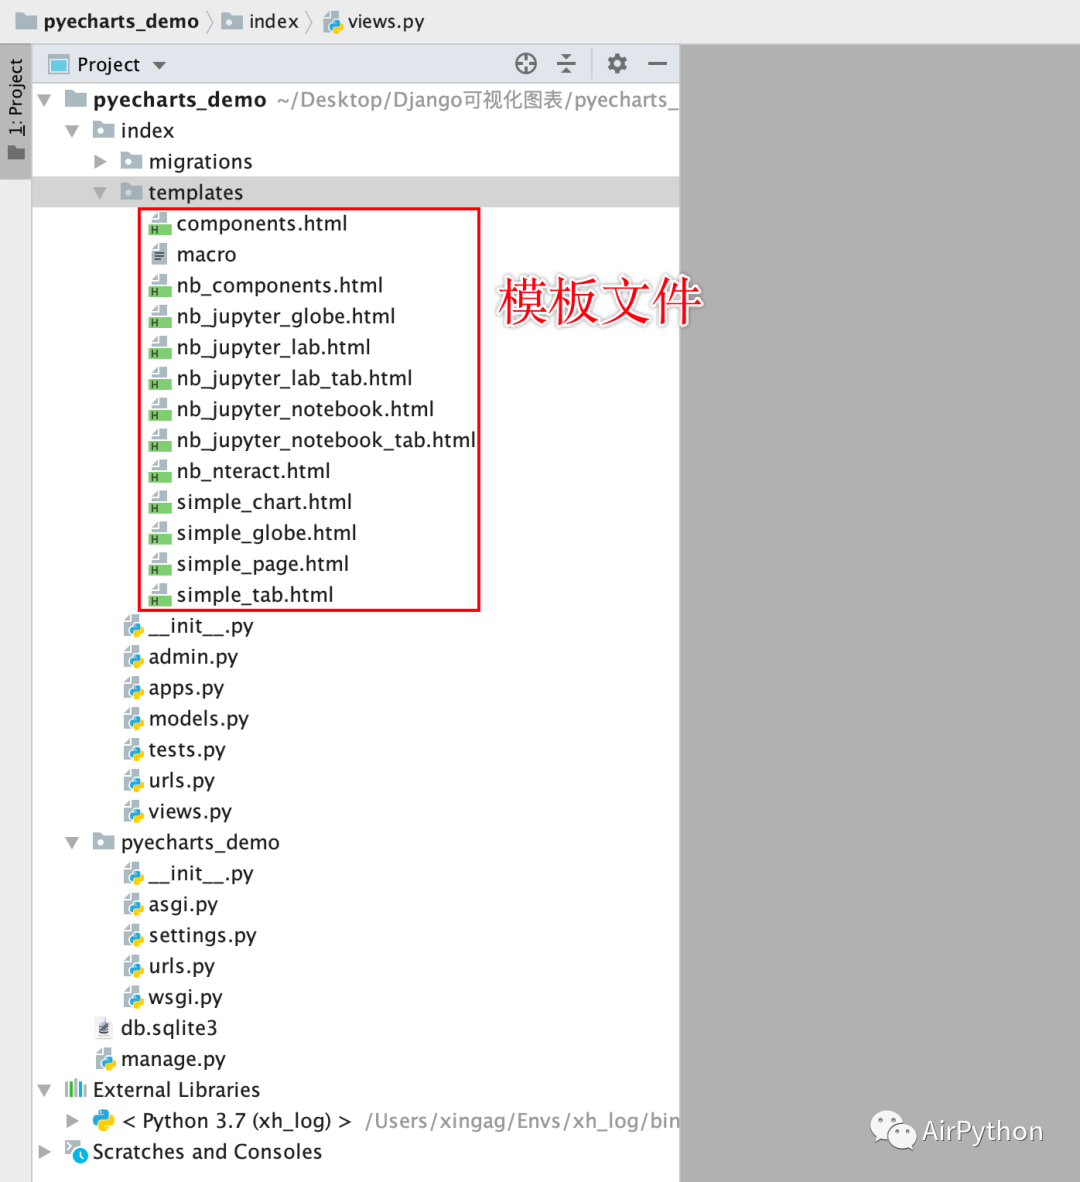
3-2 copy the template file of pyecharts to the project
Copy the template file of {pyecharts in the virtual environment to the template folder of the project
For example, the local path is as follows:
/Users/xingag/Envs/xh_log/lib/python3.7/site-packages/pyecharts/render/templates/
3-3 # write view functions and render charts
In the view file, create a histogram using the class Bar built into the pyecharts library
# Create your views here.
from django.http import HttpResponse
from jinja2 import Environment, FileSystemLoader
from pyecharts.globals import CurrentConfig
CurrentConfig.GLOBAL_ENV = Environment(loader=FileSystemLoader("./index/templates"))
from pyecharts import options as opts
from pyecharts.charts import Bar
# http://127.0.0.1:8000/demo/
def index(request):
c = (
Bar()
.add_xaxis(["shirt", "cardigan", "Chiffon shirt", "trousers", "high-heeled shoes", "Socks"])
.add_yaxis("business A", [5, 20, 36, 10, 75, 90])
.add_yaxis("business B", [15, 25, 16, 55, 48, 8])
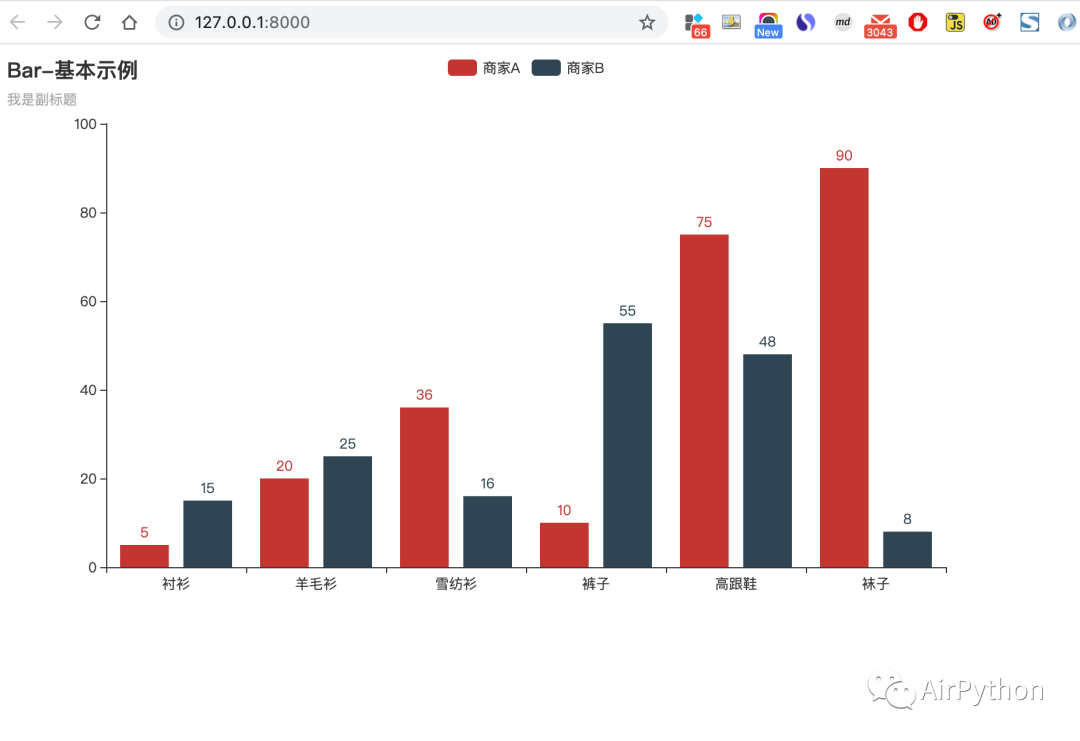
.set_global_opts(title_opts=opts.TitleOpts(title="Bar-Basic example", subtitle="I'm a subtitle"))
)
return HttpResponse(c.render_embed())
3-4. Operation items
Run the project, and the generated histogram is as follows:
This is just the simplest use example, more complex charts and examples of separation and update of front and back ends
You can refer to the official website:
https://pyecharts.org/#/zh-cn/web_django?id=django-%e5%89%8d%e5%90%8e%e7%ab%af%e5%88%86%e7%a6%bb
4. Finally
This paper introduces the basic steps of Django's rapid integration of Echarts and Pyecharts. In the actual project, some complex charts, front and rear separation data updates can be expanded with reference to the official website.