Set up ELK to do log analysis for recording. Installation of kafka and docker is not explained here.
- First, build elastic search
docker run -d elasticsearch- es has an official image, so there is no other requirement, so you can run an elastic search container, but I specify the port mapping and configuration file and data file volume, so use the following commands:
docker run -d -p 9200:9200 -p 9300:9300 --restart always --name es -v /home/docker/esdata/config:/usr/share/elasticsearch/config 192.168.187.108:5000/es:5.5.1-alpine192.168.187.108 is the ip of my private registry warehouse. If it is not built, it can be directly used on docker hub. So far, if the es is ready, then it is logstash. The configuration of logstash is the most.
Build logstash
Logstash is also officially mirrored. Since I started it by mounting external configuration files on data volumes, I first created a configuration file on the host, named logstash-kafka.conf.
- First look at my original log, as follows:
2017-09-26 14:26:02|sever1|192.168.187.108|{"id":"123456","token":"3fa0343fc93a4d7999e28d202edc8c11"}|check_app_version|okhttp/3.8.0|0|Success|2|- Since the logstash image has been downloaded, the logstash-input-kafka plug-in is included, so there is no need to install the plug-in separately (in fact, most of the commonly used plug-ins are already included in the image). For details of the logstash configuration, please refer to the official introduction of logstash and go directly to the logstash configuration file, logstash-kafka.conf:
input{
    kafka{
        group_id => "log-api-1"
        topics => ["log-api"]
        bootstrap_servers => "192.168.187.108:9092,192.168.187.109:9092,192.168.187.110:9092"
    }
}

filter {

  grok {
    match => { "message" => "%{DATA:timestamp}\|%{DATA:serverHost}\|%{IP:clientIp}\|%{DATA:auth}\|%{DATA:uri}\|%{DATA:userAgent}\|%{NUMBER:resultCode}\|%{DATA:resultMsg}\|%{NUMBER:costime}\|"}
  }

  date {
    match => [ "timestamp", "yyyy-MM-dd HH:mm:ss" ]
    target => "@timestamp"
  }

  geoip {
    source => "clientIp"
  }

  if [userAgent] != "-" {
    useragent {
      target => "ua"
      source => "userAgent"
    }
  }

  mutate {
    convert => ["costime", "integer"]
    convert => ["resultCode", "integer"]
  }

  json {
    source => "auth"
    target => "auth_content"
    remove_field => ["auth"]
  }


}

output {
  elasticsearch{
    hosts => ["192.168.187.108:9200"]
    index => "logstash-api-%{+YYYY.MM.dd}"
  }

  stdout{
    codec => rubydebug
  }
}- bootstrap_servers is the address of kafka. It's actually very simple. Okay, get ready. Let's start logstash:
docker run -it --rm -v "$PWD":/config-dir 10.45.53.221:5000/logstash -f /config-dir/logstash-kafka.conf- At this time, if there is data input in kafka, the log processed by logstash can be seen as follows:
{
           "geoip" => {
             "city_name" => "Shenzhen",
              "timezone" => "Asia/Shanghai",
                    "ip" => "192.168.187.108",
              "latitude" => 22.5333,
          "country_name" => "China",
         "country_code2" => "CN",
        "continent_code" => "AS",
         "country_code3" => "CN",
           "region_name" => "Guangdong",
              "location" => {
            "lon" => 114.1333,
            "lat" => 22.5333
        },
           "region_code" => "44",
             "longitude" => 114.1333
    },
      "resultCode" => 0,
         "costime" => 11,
       "userAgent" => "okhttp/3.8.0",
         "message" => "2017-09-26 11:53:46|server1|192.168.187.108|{\"id\":\"123456\",\"token\":\"e684379baeca4efb9ca3ec4dbe35b9b5\"}|/get_symp_dict|okhttp/3.8.0|0|Success|11|",
              "ua" => {
          "patch" => "0",
             "os" => "Other",
          "major" => "3",
          "minor" => "8",
          "build" => "",
           "name" => "okhttp",
        "os_name" => "Other",
         "device" => "Other"
    },
             "uri" => "get_symp_dict",
      "serverHost" => "iZ238h51mijZ",
       "resultMsg" => "Success",
    "auth_content" => {
           "id" => "59b90e24d7e29b7b4af80b4e",
        "token" => "e684379baeca4efb9ca3ec4dbe35b9b5"
    },
      "@timestamp" => 2017-09-26T11:53:46.000Z,
        "clientIp" => "183.12.64.236",
        "@version" => "1",
       "timestamp" => "2017-09-26 11:53:46"
}
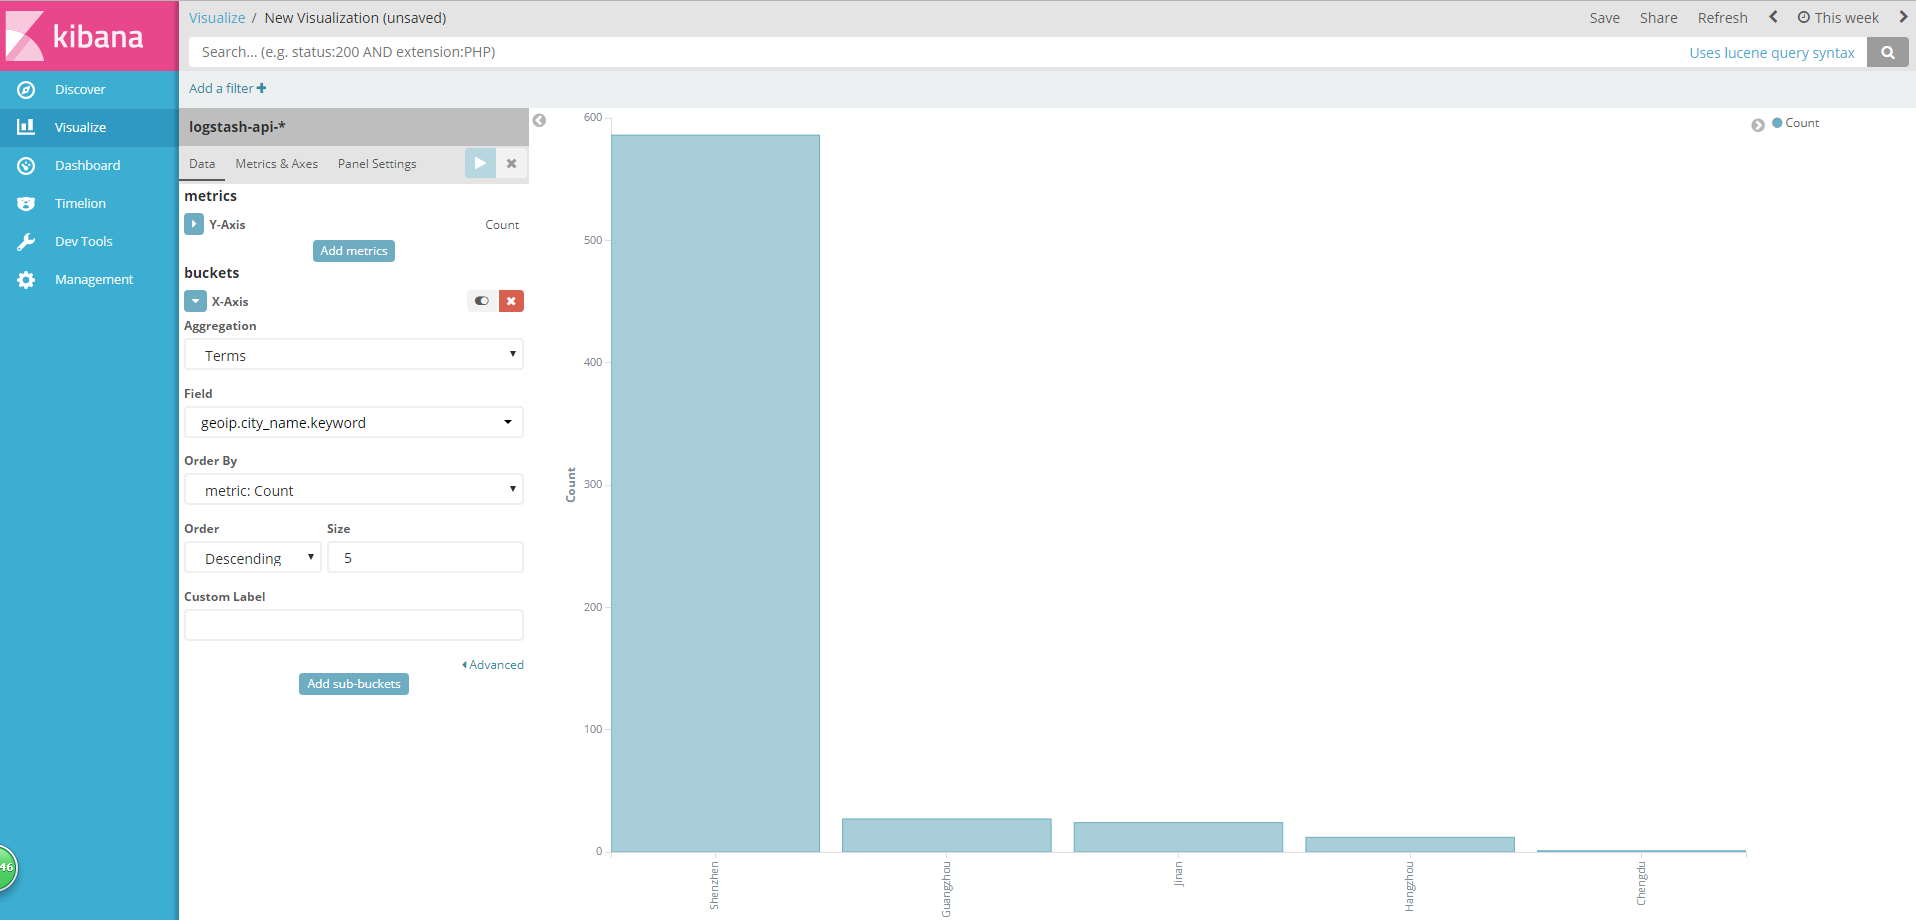
- This format in kibana is very good to do analysis, and then build kibana, because there are docker s, building kibana is also very convenient.
docker run --name kibana -e ELASTICSEARCH_URL=http://192.168.187.108:9200 -p 5601:5601 -d kibana-
In this way, Kibana has built ok, which can be accessed through 192.168.187.110:5601. Note, here is my local area network. Kibana is built on 192.168.187.110, so it can be accessed, depending on the specific situation. Let's finish with a picture of kibana.