I. description
Prometheus collects the data, and Grafana displays the data. The exporters in Prometheus include:
1) Node Exporter is responsible for collecting host hardware and operating system data. It will run as a container on all hosts.
2) C advisor is responsible for collecting container data. It will run as a container on all host s.
3) Alertmanager, responsible for alerting. It will run as a container on all host s.
For a complete list of exporters, refer to: https://prometheus.io/docs/instrumenting/exporters/
2. Install docker, docker compose
2.1 installing docker
First install a 64 bit Linux host. Its kernel must be higher than 3.10 and its memory must be no less than 1GB. Install Docker on this host.
# Install dependency package
yum install -y yum-utils device-mapper-persistent-data lvm2
# Add Docker package source
yum-config-manager --add-repo https://download.docker.com/linux/centos/docker-ce.repo
# Install Docker CE
yum install docker-ce -y
# start-up
systemctl start docker
# Boot up
systemctl enable docker
# View Docker information
docker info
2.2 install docker compose
curl -L https://github.com/docker/compose/releases/download/1.23.2/docker-compose-`uname -s`-`uname -m` -o /usr/local/bin/docker-compose
chmod +x /usr/local/bin/docker-compose
III. add configuration file
mkdir -p /usr/local/src/config
cd /usr/local/src/config
2.1 add the prometheus.yml configuration file,
vim prometheus.yml
# my global config
global:
  scrape_interval:     15s # Set the scrape interval to every 15 seconds. Default is every 1 minute.
  evaluation_interval: 15s # Evaluate rules every 15 seconds. The default is every 1 minute.
  # scrape_timeout is set to the global default (10s).

# Alertmanager configuration
alerting:
  alertmanagers:
  - static_configs:
    - targets: ['192.168.159.129:9093']
      # - alertmanager:9093

# Load rules once and periodically evaluate them according to the global 'evaluation_interval'.
rule_files:
  - "node_down.yml"
  # - "first_rules.yml"
  # - "second_rules.yml"

# A scrape configuration containing exactly one endpoint to scrape:
# Here it's Prometheus itself.
scrape_configs:
  # The job name is added as a label `job=<job_name>` to any timeseries scraped from this config.
  - job_name: 'prometheus'
    static_configs:
- targets: ['192.168.159.129:9090']

  - job_name: 'cadvisor'
    static_configs:
    - targets: ['192.168.159.129:8080']

  - job_name: 'node'
    scrape_interval: 8s
    static_configs:
      - targets: ['192.168.159.129:9100']
2.2 add email alarm profile
Add the configuration file config.yml to configure the e-mail mailbox
vim config.yml
global:
  smtp_smarthost: 'smtp.163.com:25'  #163 server
  smtp_from: 'tsiyuetian@163.com'        #Email address
  smtp_auth_username: 'tsiyuetian@163.com'  #Email user name, that is, your email
  smtp_auth_password: 'TPP***'        #Email password
  smtp_require_tls: false        #No tls validation

route:
  group_by: ['alertname']
  group_wait: 10s
  group_interval: 10s
  repeat_interval: 10m
  receiver: live-monitoring

receivers:
- name: 'live-monitoring'
  email_configs:
  - to: '1933306137@qq.com'        #Email received
2.3 add alarm rule
Add a node_down.yml to monitor prometheus targets
vim node_down.yml
groups:
- name: node_down
  rules:
  - alert: InstanceDown
    expr: up == 0
    for: 1m
    labels:
      user: test
    annotations:
      summary: "Instance {{ $labels.instance }} down"
      description: "{{ $labels.instance }} of job {{ $labels.job }} has been down for more than 1 minutes."
IV. writing docker compose
vim docker-compose-monitor.yml
version: '2'

networks:
    monitor:
        driver: bridge

services:
    prometheus:
        image: prom/prometheus
        container_name: prometheus
        hostname: prometheus
        restart: always
        volumes:
            - /usr/local/src/config/prometheus.yml:/etc/prometheus/prometheus.yml
            - /usr/local/src/config/node_down.yml:/etc/prometheus/node_down.yml
        ports:
            - "9090:9090"
        networks:
            - monitor

    alertmanager:
        image: prom/alertmanager
        container_name: alertmanager
        hostname: alertmanager
        restart: always
        volumes:
            - /usr/local/src/config/config.yml:/etc/alertmanager/config.yml
        ports:
            - "9093:9093"
        networks:
            - monitor

    grafana:
        image: grafana/grafana
        container_name: grafana
        hostname: grafana
        restart: always
        ports:
            - "3000:3000"
        networks:
            - monitor

    node-exporter:
        image: quay.io/prometheus/node-exporter
        container_name: node-exporter
        hostname: node-exporter
        restart: always
        ports:
            - "9100:9100"
        networks:
            - monitor

    cadvisor:
        image: google/cadvisor:latest
        container_name: cadvisor
        hostname: cadvisor
        restart: always
        volumes:
            - /:/rootfs:ro
            - /var/run:/var/run:rw
            - /sys:/sys:ro
            - /var/lib/docker/:/var/lib/docker:ro
        ports:
            - "8080:8080"
        networks:
            - monitor
V. start docker compose
#Start container:
docker-compose -f /usr/local/src/config/docker-compose-monitor.yml up -d
#To delete a container:
docker-compose -f /usr/local/src/config/docker-compose-monitor.yml down
#Restart container:
docker restart id
The container starts as follows:
The prometheus interface is as follows: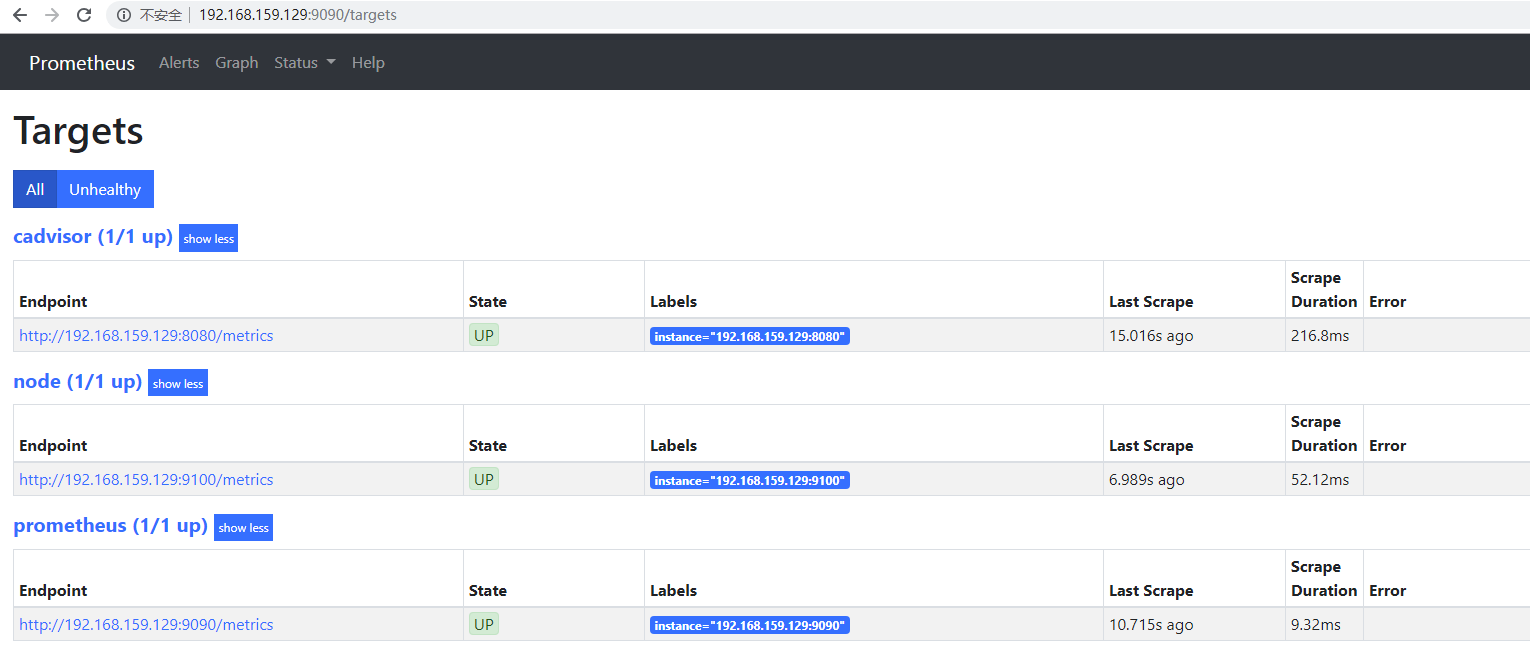
If State is Down, it should be a firewall problem. Refer to the firewall configuration below.
Vi. firewall configuration
6.1 turn off selinux
setenforce 0
vim /etc/sysconfig/selinux
6.2 configure iptables
#Remove the built-in firewall
systemctl stop firewalld.service
systemctl disable firewalld.service
#Install iptables
yum install -y iptables-services
#To configure
vim /etc/sysconfig/iptables
*filter
:INPUT ACCEPT [0:0]
:FORWARD ACCEPT [0:0]
:OUTPUT ACCEPT [24:11326]
-A INPUT -m state --state RELATED,ESTABLISHED -j ACCEPT
-A INPUT -p icmp -j ACCEPT
-A INPUT -i lo -j ACCEPT
-A INPUT -p tcp -m state --state NEW -m tcp --dport 22 -j ACCEPT
-A INPUT -p tcp -m state --state NEW -m tcp --dport 9090 -j ACCEPT
-A INPUT -p tcp -m state --state NEW -m tcp --dport 8080 -j ACCEPT
-A INPUT -p tcp -m state --state NEW -m tcp --dport 3000 -j ACCEPT
-A INPUT -p tcp -m state --state NEW -m tcp --dport 9093 -j ACCEPT
-A INPUT -p tcp -m state --state NEW -m tcp --dport 9100 -j ACCEPT
-A INPUT -j REJECT --reject-with icmp-host-prohibited
-A FORWARD -j REJECT --reject-with icmp-host-prohibited
COMMIT
#start-up
systemctl restart iptables.service
systemctl enable iptables.service
Appendix: command to start each container separately
#Start prometheus
docker run -d -p 9090:9090 --name=prometheus \
-v /usr/local/src/config/prometheus.yml:/etc/prometheus/prometheus.yml \
-v /usr/local/src/config/node_down.yml:/etc/prometheus/node_down.yml \
prom/prometheus

# Start grafana
docker run -d -p 3000:3000 --name=grafana grafana/grafana

#Start the alertmanager container
docker run -d -p 9093:9093 -v /usr/local/src/config/config.yml:/etc/alertmanager/config.yml --name alertmanager prom/alertmanager

#Start node exporter
docker run -d \
  -p 9100:9100 \
  -v "/:/host:ro,rslave" \
  --name=node_exporter \
  quay.io/prometheus/node-exporter \
  --path.rootfs /host

#Start cadviser
docker run                                    \
--volume=/:/rootfs:ro                         \
--volume=/var/run:/var/run:rw                 \
--volume=/sys:/sys:ro                         \
--volume=/var/lib/docker/:/var/lib/docker:ro  \
--publish=8080:8080                           \
--detach=true                                 \
--name=cadvisor                               \
google/cadvisor:latest