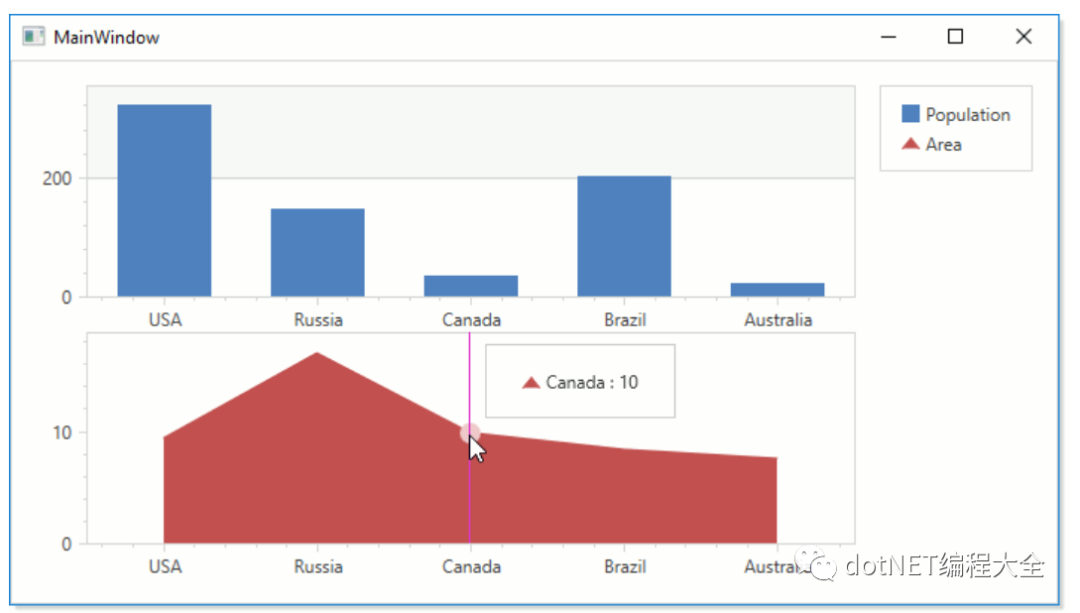
This article demonstrates the chart designer, which allows you to customize or create charts from scratch. This article demonstrates the steps required to create a simple unbound chart using the designer.
01 create chart using designer
Step 1. Create a new project and run the chart designer
- Create a new WPF application project.
- As described in Lesson 1, add the ChartControl component to the project (see Step 1).
- Call the smart tag menu or quick action of the chart control. Select Run designer link:
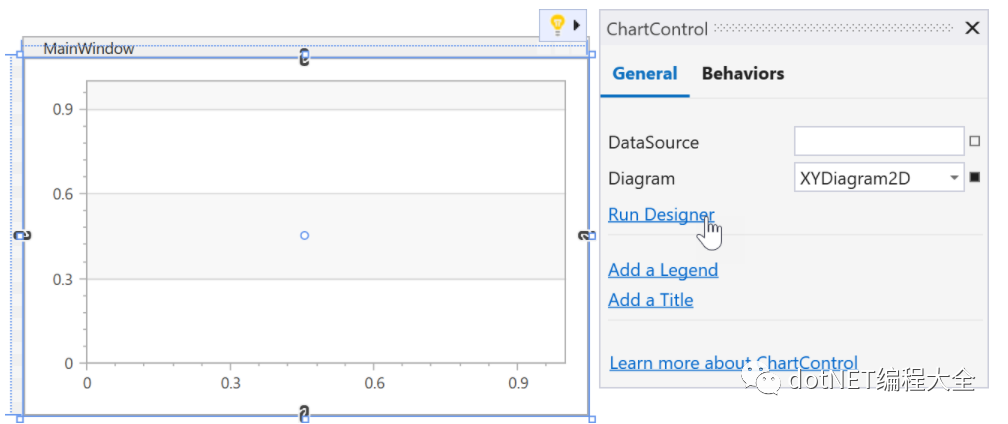
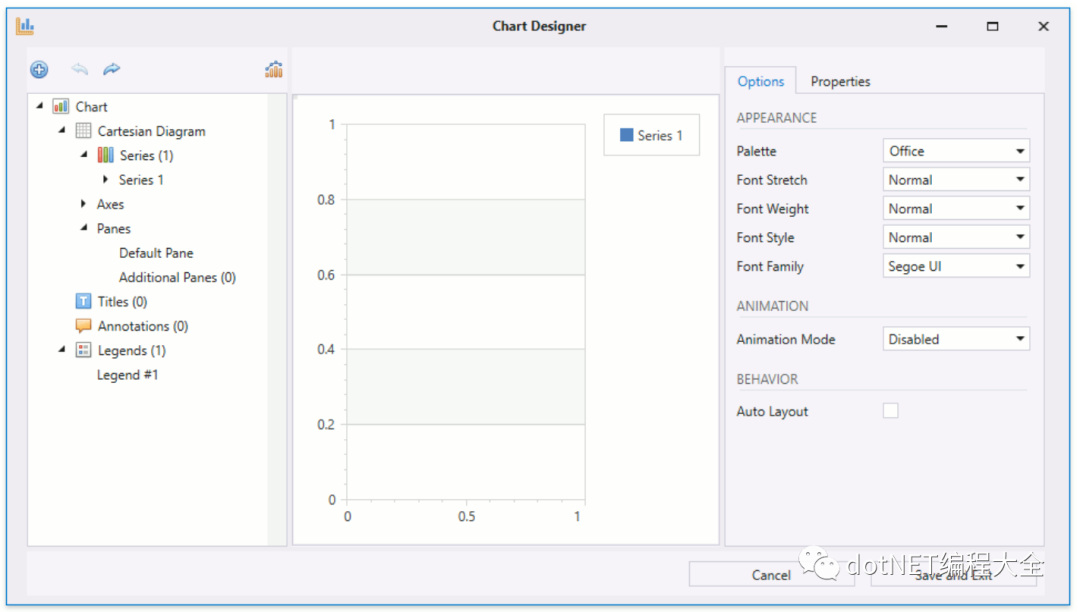
This invokes the chart designer.
You can see the side-by-side bar chart series (Series 1) in the chart element tree section. Note that series 1 has no series points.
Step 2. Add Series to chart
In this section, you add a second series to the chart and fill the two series with dots.
- Select series 1 in the tree, and on the Options tab, specify fill as the display name of the series.
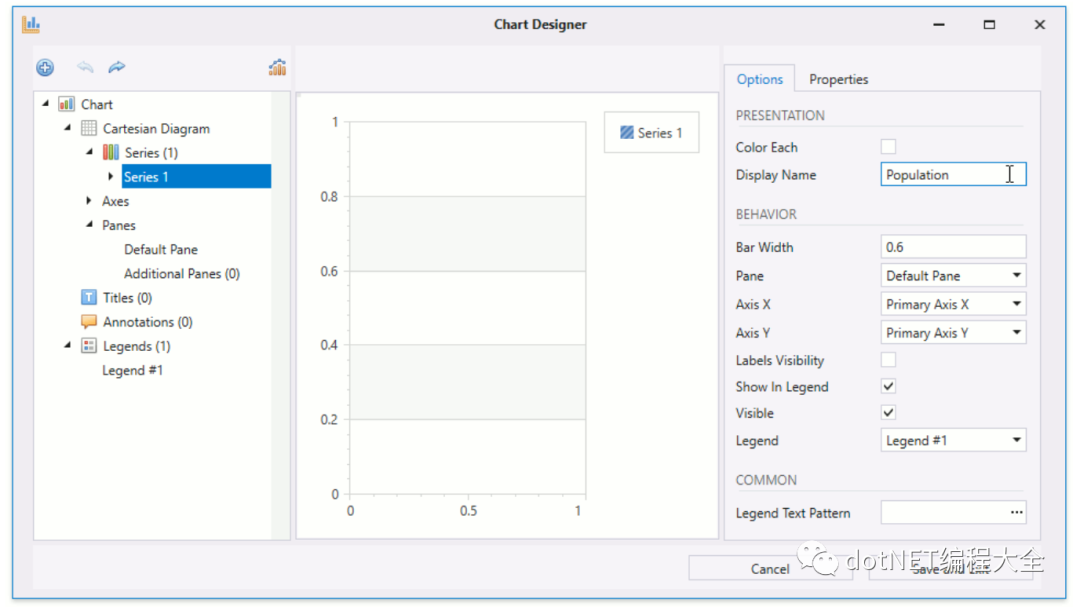
- Use the expand button to expand the fill series option and select the point item.
- In the data tab, populate the parameter and value columns with the following data:
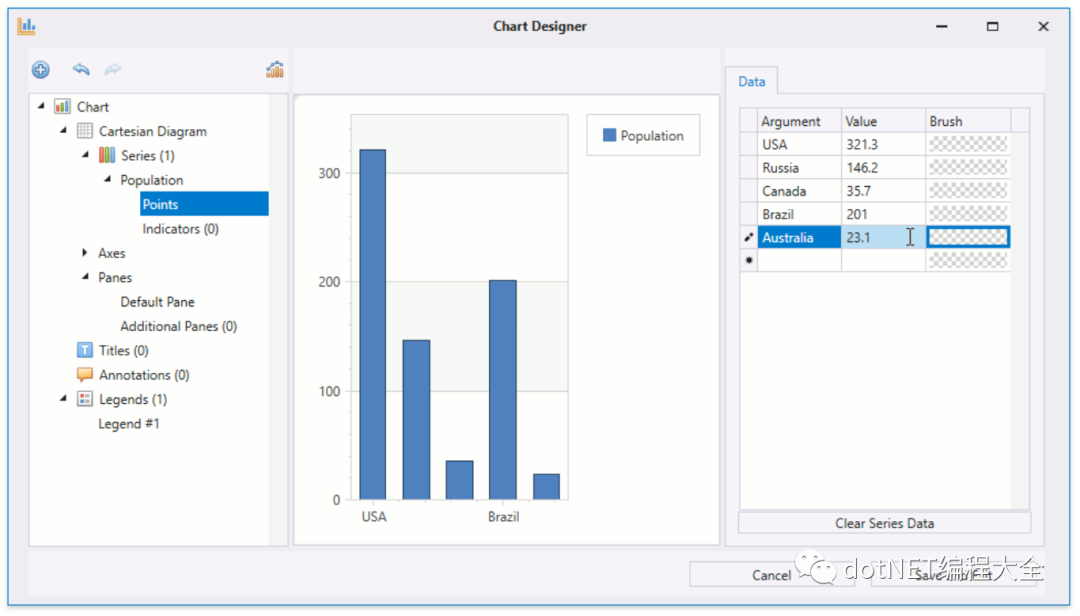
Then, add a second series to the chart (for example, an area Series). To do this:
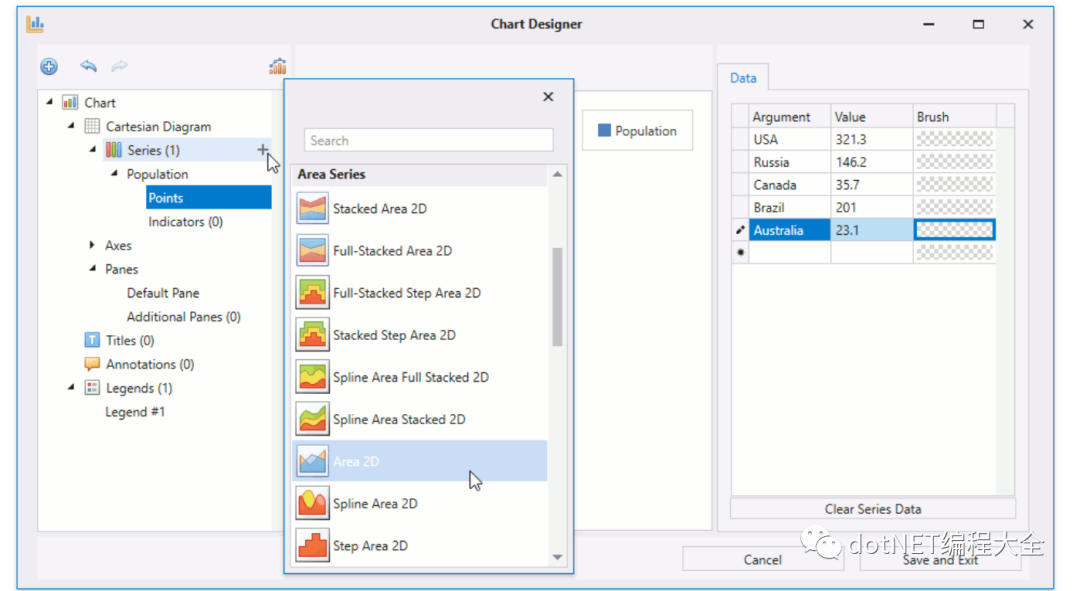
- Click the Add button for the series item in the element tree. In the invoke dialog box, click region 2D series type. This will add the area series (Series 2) to the chart using randomly generated data. Note that the axis scale type of the parameter is defined based on the qualitative data of the first series. The second series is hidden because it has numerical parameters.
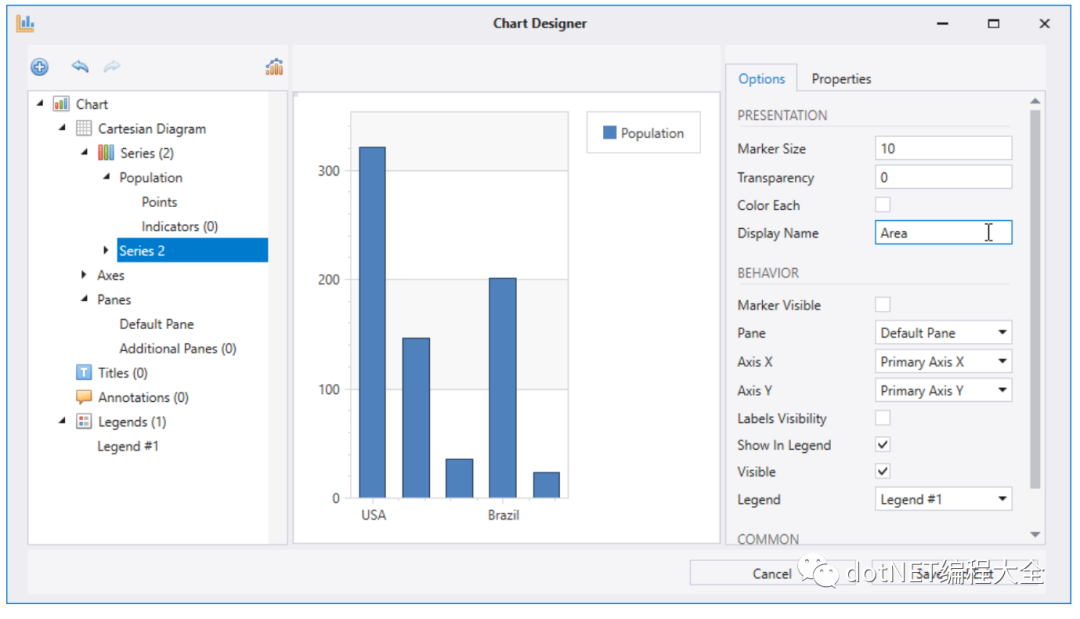
- Specify the display name of the second series as the area.
- Click the clear series data button to clear the automatically generated data.
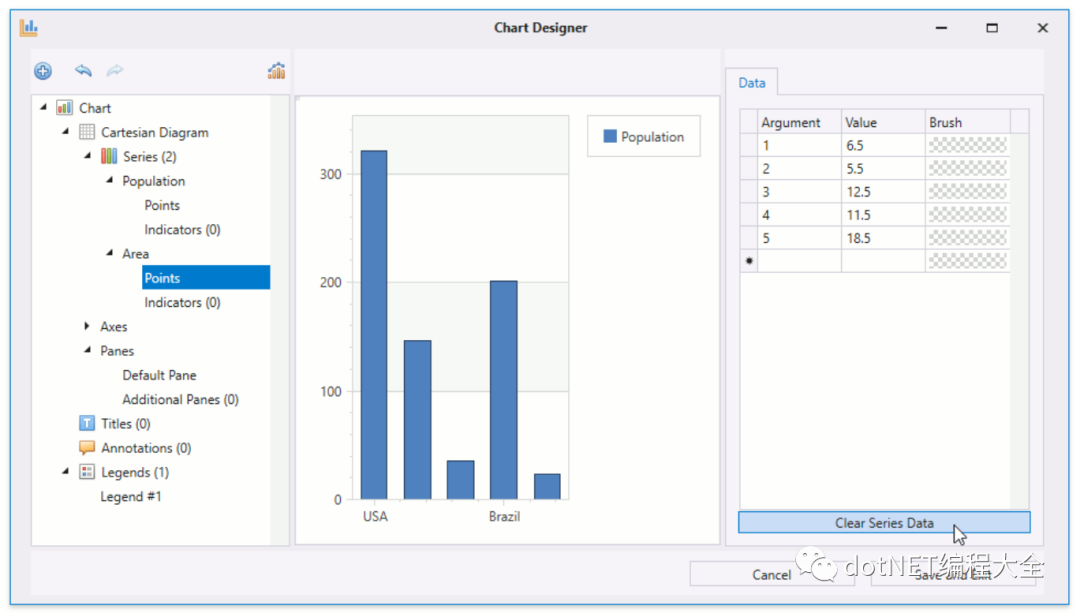
Then, define the data for the area series points as follows:
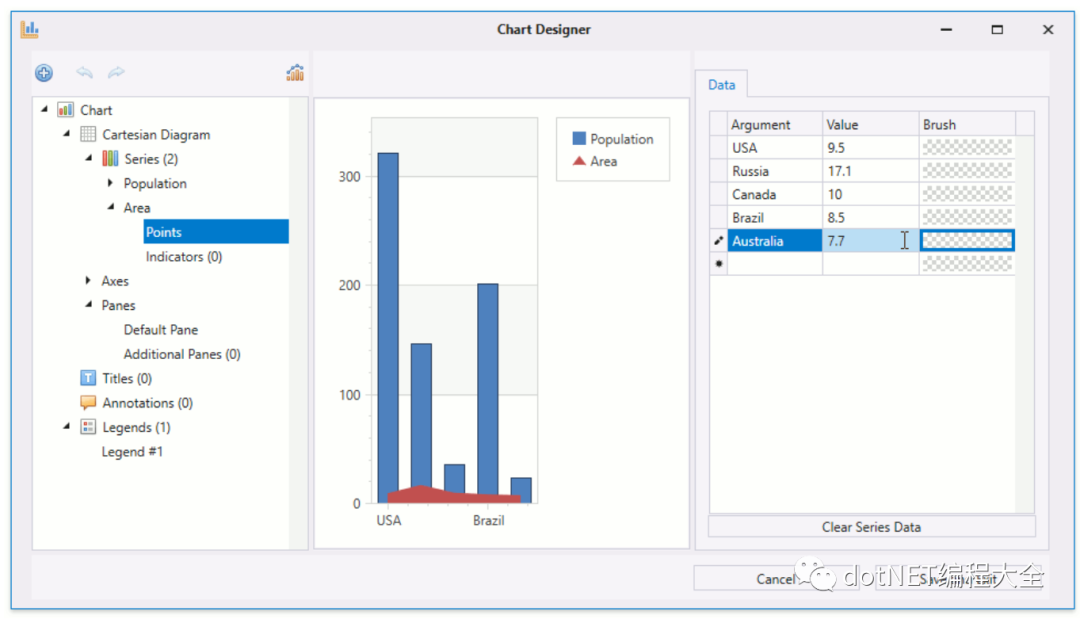
Step 3. Custom chart
This section describes how to customize the appearance of a chart.
#Show series in a separate pane
The following steps show how to display each series in a separate Pane:
- Expand the pane item. Click the Add button of the other panes item to create a new pane.
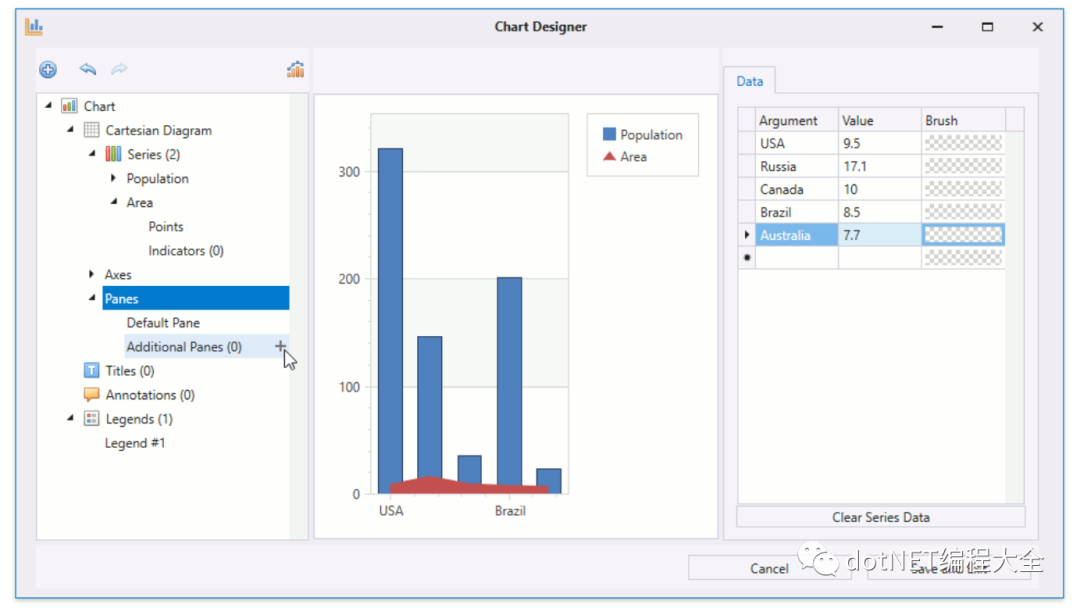
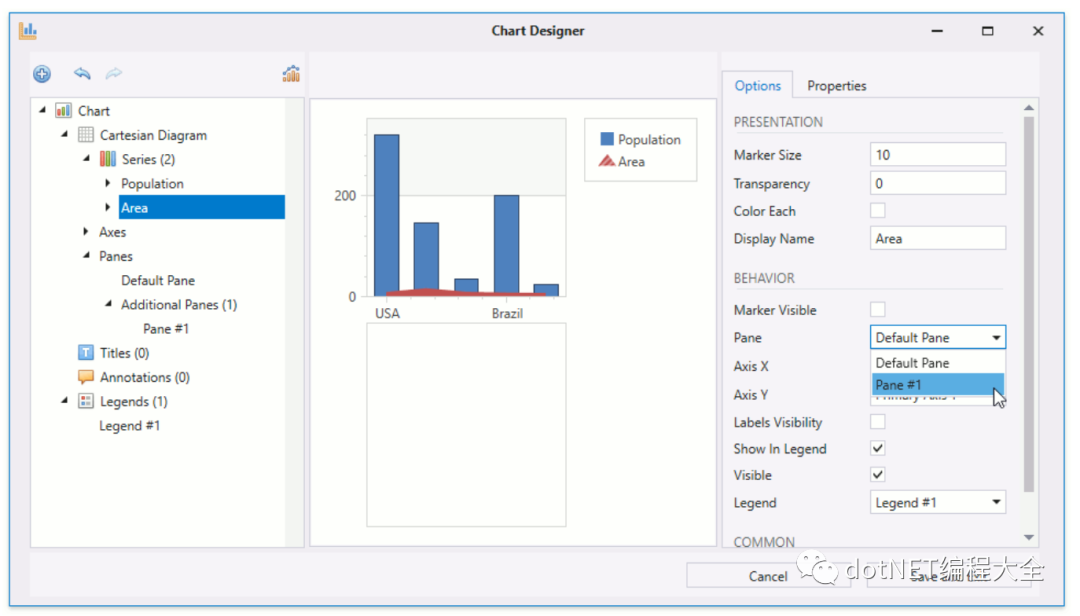
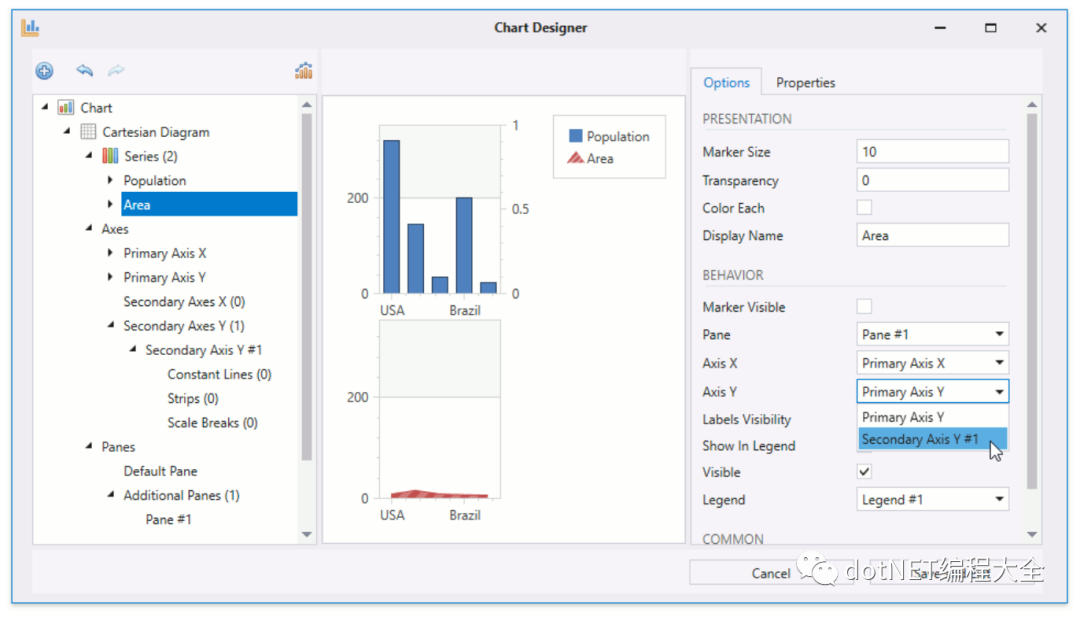
- Select the area series in the element tree. In the Options tab, locate the pane option and select the pane #1 item in its drop-down list.
Add secondary axis
Follow these steps to add and customize secondary axes:
- Expand the axis item. Click the Add button of the secondary Y axis item to add the secondary Y axis.
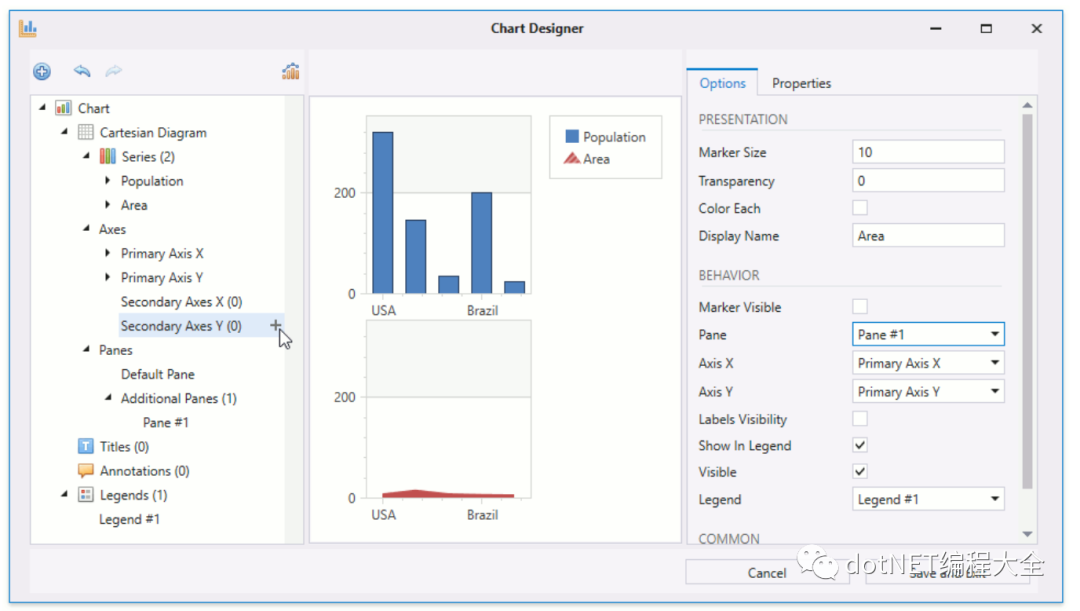
Select the area series. In the Options tab, use the drop-down list of options to set the Y axis option to the secondary axis Y#1.
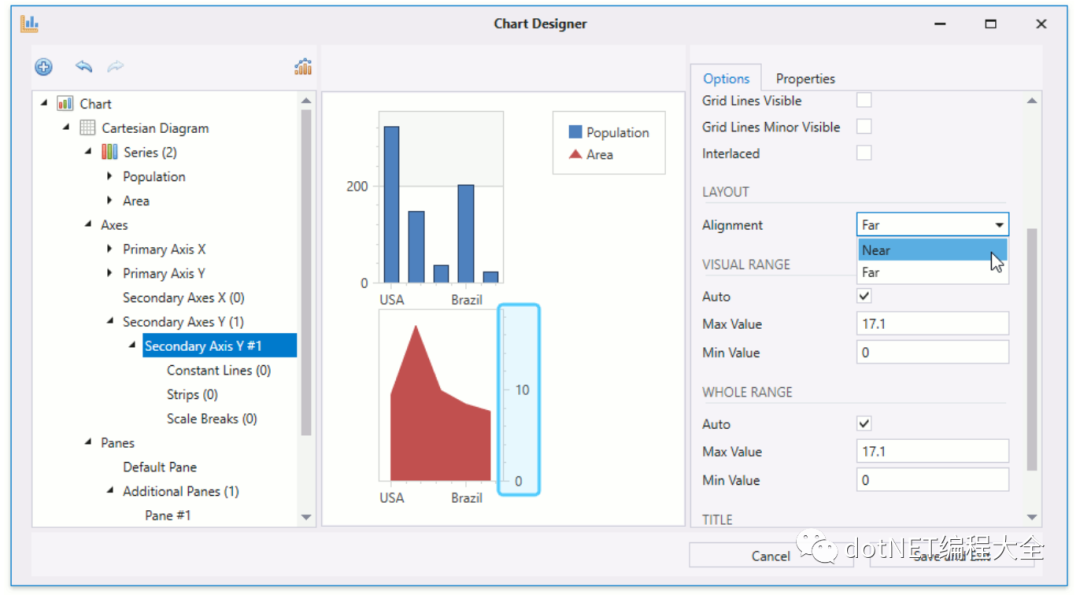
In the element tree, select the secondary axis Y#1. Then, set the axis alignment option to near.
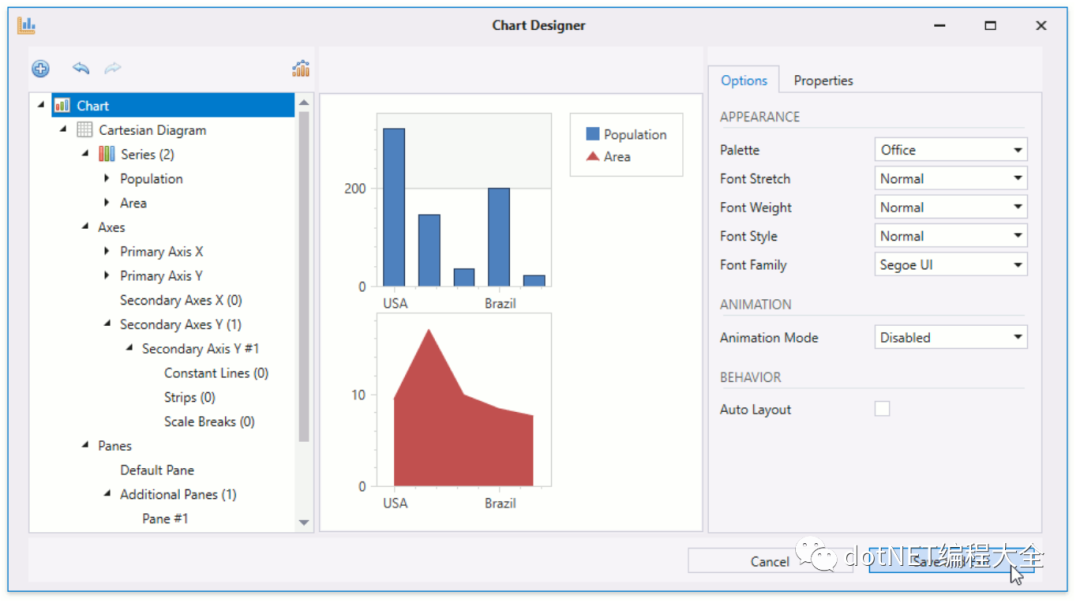
The following figure shows the results. Click the save and exit button to apply all changes and close the designer.
02 results
<Window xmlns="http://schemas.microsoft.com/winfx/2006/xaml/presentation"
        xmlns:x="http://schemas.microsoft.com/winfx/2006/xaml"
        xmlns:d="http://schemas.microsoft.com/expression/blend/2008"
        xmlns:mc="http://schemas.openxmlformats.org/markup-compatibility/2006"
        xmlns:local="clr-namespace:Lesson2"
        xmlns:dxc="http://schemas.devexpress.com/winfx/2008/xaml/charts"
        x:Class="Lesson2.MainWindow"
        mc:Ignorable="d"
        Title="MainWindow" Height="405" Width="720">
    <Grid>
        <dxc:ChartControl>
            <dxc:ChartControl.Legends>
                <dxc:Legend/>
            </dxc:ChartControl.Legends>
            <dxc:XYDiagram2D PaneOrientation="Vertical">
                <dxc:XYDiagram2D.SecondaryAxesY>
                    <dxc:SecondaryAxisY2D x:Name="axisy0" Alignment="Near"/>
                </dxc:XYDiagram2D.SecondaryAxesY>
                <dxc:XYDiagram2D.DefaultPane>
                    <dxc:Pane x:Name="pane"/>
                </dxc:XYDiagram2D.DefaultPane>
                <dxc:XYDiagram2D.Panes>
                    <dxc:Pane x:Name="pane0"/>
                </dxc:XYDiagram2D.Panes>
                <dxc:BarSideBySideSeries2D DisplayName="Population">
                    <dxc:SeriesPoint Argument="USA" Value="321.3"/>
                    <dxc:SeriesPoint Argument="Russia" Value="146.2"/>
                    <dxc:SeriesPoint Argument="Canada" Value="35.7"/>
                    <dxc:SeriesPoint Argument="Brazil" Value="201"/>
                    <dxc:SeriesPoint Argument="Australia" Value="23.1"/>
                </dxc:BarSideBySideSeries2D>
                <dxc:AreaSeries2D DisplayName="Area"
                                  dxc:XYDiagram2D.SeriesPane="{Binding ElementName=pane0}"
                                  dxc:XYDiagram2D.SeriesAxisY="{Binding ElementName=axisy0}">
                    <dxc:SeriesPoint Argument="USA" Value="9.5"/>
                    <dxc:SeriesPoint Argument="Russia" Value="17.1"/>
                    <dxc:SeriesPoint Argument="Canada" Value="10"/>
                    <dxc:SeriesPoint Argument="Brazil" Value="8.5"/>
                    <dxc:SeriesPoint Argument="Australia" Value="7.7"/>
                </dxc:AreaSeries2D>
            </dxc:XYDiagram2D>
        </dxc:ChartControl>
    </Grid>
</Window>
Run the application. The following figure shows the chart generated at run time:
