In the previous article, we talked about the basic usage of canvas and learned how to build a canvas environment.Now let's learn to draw some basic graphics.
coordinate
The coordinate origin of canvas is in the upper left corner, increasing from left to right X-axis coordinates and from top to bottom Y-axis coordinates.One unit of coordinates is 1 pixel.The diagram is as follows: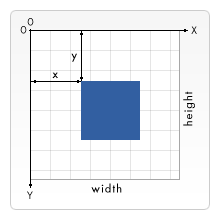
rectangle
The only polygons that canvas can draw are rectangles, and the rest are stitched together by segments.
Drawing a rectangle has three API s:
fillRect(x, y, width, height)
Draw a filled rectangle.

strokeRect(x, y, width, height)
Draw a rectangle with only a stroke.

clearRect(x, y, width, height)
Clear a specific rectangular area to make it transparent.
Parameter description:
x, y are the coordinates of the upper left corner of the rectangle, and width and height are the width and height of the rectangle.
Code example:
function draw() {
  var canvas = document.getElementById('canvas');
  if (canvas.getContext) {
    var ctx = canvas.getContext('2d');

    ctx.fillRect(25, 25, 100, 100);
    ctx.clearRect(45, 45, 60, 60);
    ctx.strokeRect(50, 50, 50, 50);
  }
}
The results are as follows:
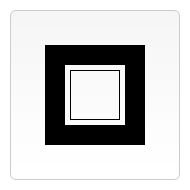
The outermost black rectangle is the filled rectangle drawn by the first line of code ctx.fillRect(25, 25, 100, 100).The middle transparent rectangle is the rectangle cleared by the second line of code ctx.clearRect(45, 45, 60, 60), and the middle describing rectangle is drawn by the third line of code ctx.strokeRect (50, 50, 50).
Route
The general steps for drawing a path are as follows:
- Create Path
- Draw Path
- Closed Path
- Fill or edge a path
The code drawn is as follows:
ctx.beginPath();    // Create Path
// Path drawing, omit first, then path drawing method
ctx.closePath();    // Closed Path
ctx.stroke();   // Stroke
// ctx.fill(); //Replace this line with Fill
In this general step, only the closed path step can be omitted, and the other steps cannot be omitted.If you do not need to draw a closed graph, you can unclosed the path.
Next, we describe how to draw a path.
moving the drawing pen
moveTo(x, y) This method moves the brush's coordinates and moves the brush to the coordinates (x, y).
When creating a path with beginPath(), the starting position is determined by moveTo(x, y), unless a path drawing method such as a circular arc does not require an initial point.
line segment
The lineTo(x, y) method draws a line segment, where x, y specifies the coordinates at the end of the segment.Line segments can be drawn with the moveTo(x, y) method.
Example:
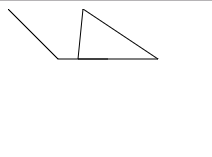
      var canvas = document.getElementById('canvas');
      if (canvas.getContext) {
        var ctx = canvas.getContext('2d');
        ctx.beginPath();
        ctx.moveTo(0,0)
        ctx.lineTo(50,50);
        ctx.lineTo(100,50);
        ctx.stroke();


        ctx.beginPath();
        ctx.moveTo(75,0)
        ctx.lineTo(70,50);
        ctx.lineTo(150,50);
        ctx.closePath();
        ctx.stroke();
      }
The results are as follows:
Draw another triangle:
var canvas = document.getElementById('canvas');
  if (canvas.getContext) {
    var ctx = canvas.getContext('2d');

    ctx.beginPath();
    ctx.moveTo(75, 50);
    ctx.lineTo(100, 75);
    ctx.lineTo(100, 25);
    ctx.fill();
  }
Effect: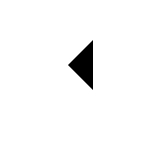
Rectangle******
Similarly, there are ways to draw rectangles in the path method.
rect(x, y, width, height)
x, y are the coordinates of the upper left corner of the rectangle, width is the width of the rectangle, and height is the height of the rectangle.
This method differs from the previous rectangle in that it is a path drawing method that is used in conjunction with methods such as beginPath() and stroke().First create the path, then draw the rectangle in this way, then stroke() or fill(), otherwise it will not be drawn.
Arc
There are two ways to draw an arc:
arc(x, y, radius, startAngle, endAngle, anticlockwise)

arcTo(x1, y1, x2, y2, radius)
The x, y parameters in the first method specify the center coordinates of the arc.
The radius parameter is the radius length of the arc.
The startAngle parameter is the radian from which the arc begins, and the endAngle is the radian from which the arc ends, in radians, not degrees.
Anticlockwise is a Boolean value that sets whether arcs are drawn clockwise or counterclockwise. When anticlockwise is true and false is clockwise, the default value is clockwise by default.
Tips:
The unit of the angle is radian, which can be converted to radians with this expression: radians = (Math.PI/180)*degrees
Here's an interesting example:
function draw() {
  var canvas = document.getElementById('canvas');
  if (canvas.getContext) {
    var ctx = canvas.getContext('2d');

    for (var i = 0; i < 4; i++) {
      for (var j = 0; j < 3; j++) {
        ctx.beginPath();
        var x = 25 + j * 50; // x coordinate
        var y = 25 + i * 50; // y coordinate
        var radius = 20; // Arc radius
        var startAngle = 0; // Starting point on circle
        var endAngle = Math.PI + (Math.PI * j) / 2; // End point on circle
        var anticlockwise = i % 2 !== 0; // clockwise or anticlockwise

        ctx.arc(x, y, radius, startAngle, endAngle, anticlockwise);

        if (i > 1) {
          ctx.fill();
        } else {
          ctx.stroke();
        }
      }
    }
  }
}
This code draws a total of four rows and three columns of arcs.The X axis and Y axis of the adjacent arc circle are 50 pixels apart, the radius of the arc is 20 pixels, and the radians of each column of arcs are 90 degrees apart.The first and third lines are clockwise, and the second and fourth lines are counterclockwise.First and second lines stroke, third and fourth lines fill.
The effect is as follows:
The second arc method is complex and difficult to control. It actually draws a straight arc.I try to make it clear.
arcTo(x1, y1, x2, y2, radius)
The parameters x1, y1, x2, y2 are the coordinates of the two control points, and radius is the radius length of the arc.
Here is an example of what a control point means:
ctx.beginPath();
ctx.moveTo(150, 20);
ctx.arcTo(150, 100, 50, 20, 30);
ctx.stroke();

ctx.fillStyle = 'blue';
// base point
ctx.fillRect(150, 20, 10, 10);

ctx.fillStyle = 'red';
// control point one
ctx.fillRect(150, 100, 10, 10);
// control point two
ctx.fillRect(50, 20, 10, 10);
The effect is as follows: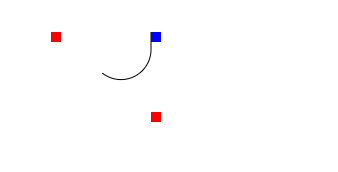
The upper left coordinate of the blue square is the coordinate of moveTo, the upper left coordinate of the lower right red square is the coordinate of the first control point, and the upper left coordinate of the upper left red square is the coordinate of the second control point.
Notice that there is a small straight line between the blue square and the arc.
Note that the beginning of this method is to use the moveTo method to specify the starting point, which is the position of the blue square, otherwise it cannot be drawn.
This method is difficult to control, so it is usually not used.
Bezier and conic
Now I'm going to talk about two more difficult drawing API s, Quadratic Bezier Curve and Cubic Bezier Curve.
quadraticCurveTo(cp1x, cp1y, x, y)

bezierCurveTo(cp1x, cp1y, cp2x, cp2y, x, y)
Above is a conic curve, below is a cubic curve.These two curve methods are illustrated in a diagram below.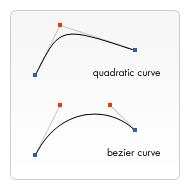
The difference between the two methods is that one has only one control point (the red point in the diagram) and the other has two control points.
The parameters cp1x, cp1y, cp2x, cp2y are the coordinates of the control points, and x, y are the coordinate values at the end of the curve, which is one of the blue dots in the graph.
Because control points cannot be visualized in graphics editing software such as Illustrator, drawing graphics using these two methods requires considerable patience.
Take an example of a conic drawing:
function draw() {
  var canvas = document.getElementById('canvas');
  if (canvas.getContext) {
    var ctx = canvas.getContext('2d');

    // Quadratric curves example
    ctx.beginPath();
    ctx.moveTo(75, 25);
    ctx.quadraticCurveTo(25, 25, 25, 62.5);
    ctx.quadraticCurveTo(25, 100, 50, 100);
    ctx.quadraticCurveTo(50, 120, 30, 125);
    ctx.quadraticCurveTo(60, 120, 65, 100);
    ctx.quadraticCurveTo(125, 100, 125, 62.5);
    ctx.quadraticCurveTo(125, 25, 75, 25);
    ctx.stroke();
  }
}
Effect:
I won't go into the cubic curve example.In general, you will not use these two methods to draw graphics.
2D Path Object
In the actual drawing process, many paths often need to be drawn, many of which may be duplicated.The purpose of the 2D path object is to store reused paths, improve performance, simplify code, which are supported by new browsers.
Let me start with three ways to initialize a 2D path object:
new Path2D(); // empty path object
new Path2D(path); // copy from another Path2D object
new Path2D(d); // path from SVG path data
Constructors can be parameterized, so that an empty path object is created, as well as a 2D path object can be passed as a parameter, so that a 2D path object is copied, and a SVG path data can be passed, such as var p = new Path2D('M10 10 h 80 v 80 h -80 Z');
Or use an example to illustrate that Path2D is a clearer object:
function draw() {
  var canvas = document.getElementById('canvas');
  if (canvas.getContext) {
    var ctx = canvas.getContext('2d');

    var rectangle = new Path2D();
    rectangle.rect(10, 10, 50, 50);

    var circle = new Path2D();
    circle.moveTo(125, 35);
    circle.arc(100, 35, 25, 0, 2 * Math.PI);

    ctx.stroke(rectangle);
    ctx.fill(circle);
  }
}
In this example, an object storing a rectangular path and a path object storing a circle are created as follows: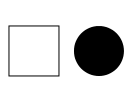
All the path drawing methods mentioned above, Path2D, work with this object.
There is also a splicing path for Path2D:
Path2D.addPath(path [, transform])
Adds a path to the current path with an optional transformation matrix.
By passing in a path, the two paths can be joined together, with an optional parameter, which is a SVG transformation matrix.
Lift a chestnut:
var canvas = document.getElementById('canvas');
var ctx = canvas.getContext('2d');

// Create a new path with a rect
var p1 = new Path2D();
p1.rect(0, 0, 100, 100);

// Create another path with a rect
var p2 = new Path2D();
p2.rect(0, 0, 100, 100);

// Create transformation matrix that moves vertically 300 points to the right
var m = document.createElementNS('http://www.w3.org/2000/svg', 'svg').createSVGMatrix();
m.a = 1; m.b = 0;
m.c = 0; m.d = 1;
m.e = 300; m.f = 0;

// add the second path to the first path
p1.addPath(p2, m);

// Finally, fill the first path onto the canvas
ctx.fill(p1);