Last article: Rectangular Tree Graph https://blog.csdn.net/zjw_python/article/details/98480632
Next article: funnel chart https://blog.csdn.net/zjw_python/article/details/98201470
The code structure and the introduction of the Chart object of the initialization canvas, see first https://blog.csdn.net/zjw_python/article/details/98182540
The complete source address of this figure: https://github.com/zjw666/D3_demo/tree/master/src/treeChart/basicTreeChart
1 Chart Effect
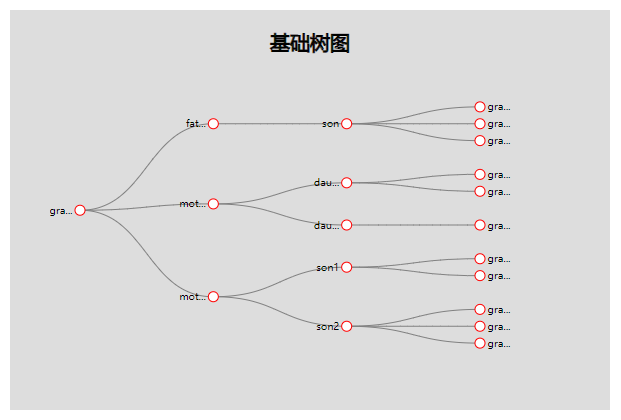
2 Data
{
    "name": "grandfather",
    "children": [
        {
            "name": "father",
            "children": [
                {
                    "name": "son",
                    "children": [
                        {"name": "grandson1", "house": 2},
                        {"name": "grandson2", "house": 3},
                        {"name": "grandson3", "house": 4}

                    ]
                }
            ]
        },
        {
            "name": "mother1",
            "children": [
                {
                    "name": "daughter1",
                    "children": [
                        {"name": "granddaughter1", "house": 4},
                        {"name": "granddaughter2", "house": 2}
                    ]
                },
                {
                    "name": "daughter2",
                    "children": [
                        {"name": "granddaughter3", "house": 4}
                    ]
                }
            ]
        },
        {
            "name": "mother2",
            "children": [
                {
                    "name": "son1",
                    "children": [
                        {"name": "grandson4", "house": 6},
                        {"name": "granddaughter4", "house": 1}
                    ]
                },
                {

                    "name": "son2",
                    "children": [
                        {"name": "granddaughter5", "house": 2},
                        {"name": "grandson5", "house": 3},
                        {"name": "granddaughter5", "house": 2}
                    ]

                }
            ]
        }

    ]
}
3 Key Codes
Import data
d3.json('./data.json').then(function(data){
....
Some style parameter configurations, such as node, line color, etc.
const config = {
        margins: {top: 80, left: 50, bottom: 50, right: 50},
        textColor: 'black',
        title: 'Base Tree Map',
        hoverColor: 'gray',
        animateDuration: 1000,
        pointSize: 5,
        pointFill: 'white',
        pointStroke: 'red',
        paddingLeft: 20,
        lineStroke: 'gray'
    }
Data conversion, tree graph is similar to matrix tree graph, it is a tree hierarchical data structure, so we need to convert data into a series of nodes. For tree graph, its layout algorithm is d3.tree. After passing in the processed data, layout information will be automatically added to each node.
/* ----------------------------Data Conversion  */
    const root = d3.hierarchy(data);

    const generateTree = d3.tree()
                    .size([chart.getBodyHeight(), chart.getBodyWidth()*0.8]);

    generateTree(root);
Rendering tree nodes, in fact, rendering tree nodes is very simple, just use circle element directly, the difficulty lies in the transitional animation effect, we want to make similar. Echart tree graph As a result, when you click on a node, you zoom in and reposition the subtree. To achieve this effect, the corresponding animation effects must be added to each stage of the node, enter, update and exit.
/* ----------------------------Rendering Node  */
    chart.renderNode = function(){

        const groups = chart.body().selectAll('.g')
                                    .data(root.descendants(), (d) => d.id || (d.id = ++chart._nodeId));

        const groupsEnter = groups.enter()
                                    .append('g')
                                    .attr('class', (d) => 'g g-' + d.id)
                                    .attr('transform-origin', (d) => {    //Subtree enlarges gradually from click position
                                        if (d.parent){
                                            return chart.oldY + config.paddingLeft + ' ' + chart.oldX;
                                        }
                                        return d.y + config.paddingLeft + ' ' + d.x;
                                    })
                                    .attr('transform', (d) => {    //The first rendering goes into non-zooming
                                        if (d.parent && chart.first) return 'scale(0.01)' + 'translate(' + (chart.oldY + config.paddingLeft) + ',' + chart.oldX + ')';
                                        return 'scale(1)' + 'translate(' + (d.y + config.paddingLeft) + ',' + d.x + ')';
                                    })

              groupsEnter.append('circle')
                            .attr('r', config.pointSize)
                            .attr('cx', 0)
                            .attr('cy', 0)
                            .attr('fill', config.pointFill)
                            .attr('stroke', config.pointStroke);

              groupsEnter.merge(groups)
                            .transition().duration(config.animateDuration)
                            .attr('transform', (d) => 'translate(' + (d.y + config.paddingLeft) + ',' + d.x + ')')
                            .select('circle')
                                .attr('fill', (d) => d._children ? config.hoverColor : config.pointFill);

              groups.exit()
                        .attr('transform-origin', (d) => (chart.targetNode.y + config.paddingLeft) + ' ' + chart.targetNode.x)  //The subtree gradually shrank to a new position
                        .transition().duration(config.animateDuration)
                        .attr('transform', 'scale(0.01)')
                        .remove();


    }
When the node of the tree is rendered, the location of the text label of the node is determined.
/* ----------------------------Rendering Text Labels  */
    chart.renderText = function(){
        d3.selectAll('.text').remove();

        const groups = d3.selectAll('.g');

        groups.append('text')
              .attr('class', 'text')
              .text((d) => d.data.name.length<5?d.data.name:d.data.name.slice(0,3) + '...')
              .attr('dy', function(){
                  return chart.textDy || (chart.textDy = this.getBBox().height/4);
              })
              .attr('text-anchor', (d) =>{
                  return d.children ? 'end' : 'start';
              })
              .attr('dx', (d) =>{
                return d.children ? -config.pointSize*1.5 : config.pointSize*1.5;
            });
    }
Next, render the lines between nodes. Here, we use d3.path to draw Bessel curve, and select the middle point of two nodes as the control point. Transition animation effect is similar to that of nodes, which is implemented by scale.
/* ----------------------------Rendering Wiring  */
    chart.renderLines = function(){
        const nodesExceptRoot = root.descendants().slice(1);

        const links = chart.body().selectAll('.link')
                                .data(nodesExceptRoot, (d) => d.id || (d.id = ++chart._nodeId));

              links.enter()
                     .insert('path', '.g')
                     .attr('class', 'link')
                     .attr('transform-origin', (d) => {
                        if (d.parent){           //Wiring enlarges gradually from the click position
                            return chart.oldY + config.paddingLeft + ' ' + chart.oldX;
                        }
                        return d.y + config.paddingLeft + ' ' + d.x;
                    })
                    .attr('transform', (d) => {                //The first rendering goes into non-zooming
                        if (d.parent && chart.first) return 'scale(0.01)';
                        return 'scale(1)';
                    })
                   .merge(links)
                     .transition().duration(config.animateDuration)
                     .attr('d', (d) => {
                        return generatePath(d, d.parent);
                     })
                     .attr('transform', 'scale(1)')
                     .attr('fill', 'none')
                     .attr('stroke', config.lineStroke)

              links.exit()
                     .attr('transform-origin', (d) => {    //Connections gradually narrowed to new locations
                         return chart.targetNode.y + config.paddingLeft + ' ' + chart.targetNode.x;
                     })
                     .transition().duration(config.animateDuration)
                     .attr('transform', 'scale(0.01)')
                     .remove();

        function generatePath(node1, node2){
            const path = d3.path();

            path.moveTo(node1.y + config.paddingLeft, node1.x);
            path.bezierCurveTo(
                                (node1.y + node2.y)/2 + config.paddingLeft, node1.x,
                                (node1.y + node2.y)/2 + config.paddingLeft, node2.x,
                                node2.y + config.paddingLeft, node2.x
                              );
            return path.toString();
        }
    }
Finally, the mouse interaction event is bound. When a node is clicked to hide the subtree, its children attribute is set to null, and its subtree data is temporarily saved to trigger the layout again. When clicking on a node to display the subtree, the temporary subtree data will be taken out and re-assigned to the child attribute, and re-layout, so as to achieve the effect of subtree switching.
/* ----------------------------Binding Mouse Interaction Events  */
    chart.addMouseOn = function(){

        d3.selectAll('.g circle')
            .on('click', function(d){
                toggle(d);
                generateTree(root);
                chart.renderNode();
                chart.renderLines();
                chart.renderText();
                chart.addMouseOn();
            });

        function toggle(d){
            chart.first = true;
            if (d.children){
                d._children = d.children;
                d.children = null;
            }else{
                d.children = d._children;
                d._children = null;
            }
            chart.oldX = d.x;  //Click on position x coordinates
            chart.oldY = d.y;  //Click on position y coordinates
            chart.targetNode = d;  //Clicked Node
        }
    }