preface
This chapter is the third Assignment of Introduction to Data Science in Python. The main task of this chapter is to select the appropriate method of summarizing and merging data tables based on the three tables given and on the understanding of various merging processes, that is, row data summary, clean and merge the data, and cluster the data by using the function of DataFrame, Calculate and view the statistical description value, find the maximum and minimum items and other data processing, which requires skilled use of various technologies.
1, Q1
1.1 problem description
Load the energy data from the file assets/Energy Indicators.xls, which is a list of indicators of energy supply and renewable electricity production from the United Nations for the year 2013, and should be put into a DataFrame with the variable name of Energy.
Keep in mind that this is an Excel file, and not a comma separated values file. Also, make sure to exclude the footer and header information from the datafile. The first two columns are unneccessary, so you should get rid of them, and you should change the column labels so that the columns are:
['Country', 'Energy Supply', 'Energy Supply per Capita', '% Renewable]
Convert Energy Supply to gigajoules (Note: there are 1,000,000 gigajoules in a petajoule). For all countries which have missing data (e.g. data with "...") make sure this is reflected as np.NaN values.
Rename the following list of countries (for use in later questions):
"Republic of Korea": "South Korea",
"United States of America": "United States",
"United Kingdom of Great Britain and Northern Ireland": "United Kingdom",
"China, Hong Kong Special Administrative Region": "Hong Kong"
There are also several countries with parenthesis in their name. Be sure to remove these, e.g. 'Bolivia (Plurinational State of)' should be 'Bolivia'.
Next, load the GDP data from the file assets/world_bank.csv, which is a csv containing countries' GDP from 1960 to 2015 from World Bank. Call this DataFrame GDP.
Make sure to skip the header, and rename the following list of countries:
"Korea, Rep.": "South Korea",
"Iran, Islamic Rep.": "Iran",
"Hong Kong SAR, China": "Hong Kong"
Finally, load the Sciamgo Journal and Country Rank data for Energy Engineering and Power Technology from the file assets/scimagojr-3.xlsx, which ranks countries based on their journal contributions in the aforementioned area. Call this DataFrame ScimEn.
Join the three datasets: GDP, Energy, and ScimEn into a new dataset (using the intersection of country names). Use only the last 10 years (2006-2015) of GDP data and only the top 15 countries by Scimagojr 'Rank' (Rank 1 through 15).
The index of this DataFrame should be the name of the country, and the columns should be ['Rank', 'Documents', 'Citable documents', 'Citations', 'Self-citations',
'Citations per document', 'H index', 'Energy Supply',
'Energy Supply per Capita', '% Renewable', '2006', '2007', '2008',
'2009', '2010', '2011', '2012', '2013', '2014', '2015'].
This function should return a DataFrame with 20 columns and 15 entries, and the rows of the DataFrame should be sorted by "Rank".
1.2 problem analysis
The first question mainly introduces the data contents of three data sets, namely:
- Energy: the data is taken from 'energy indicators' Xls', energy index, the task takes the fields ['Country', 'Energy Supply', 'Energy Supply per capital', 'Renewable'].
- GDP: data from 'world'_ bank. CSV ', this task takes the GDP of the top 10 countries from 2006 to 2015.
- ScimEn: the data is taken from 'scimagojr-3 Xlsx ', ranking them mainly according to the journal contributions of countries in the above fields, and taking all fields.
Next, standardize the data of each data set, normalize the names in the Energy and GDP tables, for example, change "Republic of Korea" to "South Korea", remove the () and [] comments in the country names in the Energy table, convert the units of 'Energy Supply', change the column names of Energy and GDP, and finally merge the three tables together.
1.3 code and detailed explanation
#Set the function to change the name
def change_country_values(item):
    dicts={"Republic of Korea": "South Korea",
            "United States of America": "United States",
            "United Kingdom of Great Britain and Northern Ireland": "United Kingdom",
            "China, Hong Kong Special Administrative Region": "Hong Kong",

            "Korea, Rep.": "South Korea",
            "Iran, Islamic Rep.": "Iran",
            "Hong Kong SAR, China": "Hong Kong"}
    #Using the iterator of dicts for matching
    for key,values in dicts.items():
        if item==key:
            return values
    return item

def answer_one():
    #Create Energy's DataFrame
    Energy=pd.read_excel('assets/Energy Indicators.xls',skiprows=16,usecols=[2,3,4,5])
    Energy=Energy[1:228]

    #Change column name
    Energy.columns=['Country', 'Energy Supply', 'Energy Supply per Capita', '% Renewable']
    #Remove the tail patch
    Energy.replace(to_replace=' \(.*\)$',value='',regex=True,inplace=True)
    Energy.replace(to_replace='[\d]+$',value='',regex=True,inplace=True)
    Energy.replace(to_replace='^[\.]+$',value=np.nan,regex=True,inplace=True)
    #Change unit
    Energy['Energy Supply']=Energy['Energy Supply'].apply(lambda x:x*1000000)
    #Change country name
    Energy['Country']=Energy['Country'].apply(change_country_values)
    #print(Energy)

    #Create DataFrame for GDP
    GDP=pd.read_csv('assets/world_bank.csv',skiprows=4)
    GDP['Country Name']=GDP['Country Name'].apply(change_country_values)
    GDP.rename(columns={'Country Name':'Country'},inplace=True)
    #print(GDP.head())

    #Create ScimEn's DataFrame
    ScimEn=pd.read_excel('assets/scimagojr-3.xlsx')
    #print(ScimEn)

    #Summarize the data columns to go into a list
    year=list(range(2006,2016))
    GDP_year=[str(i) for i in year]
    GDP_year.append('Country')

    #Take out the data from 2006 to 2015
    GDP=GDP.loc[:,GDP_year]
    #print(GDP_year)

    #Merge DataFrame by country name
    merge1=pd.merge(Energy,GDP,left_on='Country',right_on='Country',how='inner')
    #print(merge1.columns)

    #Merge DataFrame by country name
    merge2=pd.merge(ScimEn,merge1,on='Country',how='inner')
    #print(len(merge2))

    #Take the top 15 after merger
    merge2=merge2[merge2['Rank']<16]

    #Set index
    merge2.set_index('Country',inplace=True)
    #print(merge2.columns)

    #Returns the merged DataFrame
    return merge2
answer_one()
- Get the merged DataFrame
| Country | Rank | Documents | Citable documents | Citations | Self-citations | Citations per document | H index | Energy Supply | Energy Supply per Capita | % Renewable | 2006 | 2007 | 2008 | 2009 | 2010 | 2011 | 2012 | 2013 | 2014 | 2015 |
|---|---|---|---|---|---|---|---|---|---|---|---|---|---|---|---|---|---|---|---|---|
| China | 1 | 127050 | 126767 | 597237 | 411683 | 4.70 | 138 | 1.271910e+11 | 93 | 19.75491 | 3.992331e+12 | 4.559041e+12 | 4.997775e+12 | 5.459247e+12 | 6.039659e+12 | 6.612490e+12 | 7.124978e+12 | 7.672448e+12 | 8.230121e+12 | 8.797999e+12 |
| United States | 2 | 96661 | 94747 | 792274 | 265436 | 8.20 | 230 | 9.083800e+10 | 286 | 11.57098 | 1.479230e+13 | 1.505540e+13 | 1.501149e+13 | 1.459484e+13 | 1.496437e+13 | 1.520402e+13 | 1.554216e+13 | 1.577367e+13 | 1.615662e+13 | 1.654857e+13 |
| Japan | 3 | 30504 | 30287 | 223024 | 61554 | 7.31 | 134 | 1.898400e+10 | 149 | 10.23282 | 5.496542e+12 | 5.617036e+12 | 5.558527e+12 | 5.251308e+12 | 5.498718e+12 | 5.473738e+12 | 5.569102e+12 | 5.644659e+12 | 5.642884e+12 | 5.669563e+12 |
| United Kingdom | 4 | 20944 | 20357 | 206091 | 37874 | 9.84 | 139 | 7.920000e+09 | 124 | 10.60047 | 2.419631e+12 | 2.482203e+12 | 2.470614e+12 | 2.367048e+12 | 2.403504e+12 | 2.450911e+12 | 2.479809e+12 | 2.533370e+12 | 2.605643e+12 | 2.666333e+12 |
| Russian Federation | 5 | 18534 | 18301 | 34266 | 12422 | 1.85 | 57 | 3.070900e+10 | 214 | 17.28868 | 1.385793e+12 | 1.504071e+12 | 1.583004e+12 | 1.459199e+12 | 1.524917e+12 | 1.589943e+12 | 1.645876e+12 | 1.666934e+12 | 1.678709e+12 | 1.616149e+12 |
| Canada | 6 | 17899 | 17620 | 215003 | 40930 | 12.01 | 149 | 1.043100e+10 | 296 | 61.94543 | 1.564469e+12 | 1.596740e+12 | 1.612713e+12 | 1.565145e+12 | 1.613406e+12 | 1.664087e+12 | 1.693133e+12 | 1.730688e+12 | 1.773486e+12 | 1.792609e+12 |
| Germany | 7 | 17027 | 16831 | 140566 | 27426 | 8.26 | 126 | 1.326100e+10 | 165 | 17.90153 | 3.332891e+12 | 3.441561e+12 | 3.478809e+12 | 3.283340e+12 | 3.417298e+12 | 3.542371e+12 | 3.556724e+12 | 3.567317e+12 | 3.624386e+12 | 3.685556e+12 |
| India | 8 | 15005 | 14841 | 128763 | 37209 | 8.58 | 115 | 3.319500e+10 | 26 | 14.96908 | 1.265894e+12 | 1.374865e+12 | 1.428361e+12 | 1.549483e+12 | 1.708459e+12 | 1.821872e+12 | 1.924235e+12 | 2.051982e+12 | 2.200617e+12 | 2.367206e+12 |
| France | 9 | 13153 | 12973 | 130632 | 28601 | 9.93 | 114 | 1.059700e+10 | 166 | 17.02028 | 2.607840e+12 | 2.669424e+12 | 2.674637e+12 | 2.595967e+12 | 2.646995e+12 | 2.702032e+12 | 2.706968e+12 | 2.722567e+12 | 2.729632e+12 | 2.761185e+12 |
| South Korea | 10 | 11983 | 11923 | 114675 | 22595 | 9.57 | 104 | 1.100700e+10 | 221 | 2.279353 | 9.410199e+11 | 9.924316e+11 | 1.020510e+12 | 1.027730e+12 | 1.094499e+12 | 1.134796e+12 | 1.160809e+12 | 1.194429e+12 | 1.234340e+12 | 1.266580e+12 |
| Italy | 11 | 10964 | 10794 | 111850 | 26661 | 10.20 | 106 | 6.530000e+09 | 109 | 33.66723 | 2.202170e+12 | 2.234627e+12 | 2.211154e+12 | 2.089938e+12 | 2.125185e+12 | 2.137439e+12 | 2.077184e+12 | 2.040871e+12 | 2.033868e+12 | 2.049316e+12 |
| Spain | 12 | 9428 | 9330 | 123336 | 23964 | 13.08 | 115 | 4.923000e+09 | 106 | 37.96859 | 1.414823e+12 | 1.468146e+12 | 1.484530e+12 | 1.431475e+12 | 1.431673e+12 | 1.417355e+12 | 1.380216e+12 | 1.357139e+12 | 1.375605e+12 | 1.419821e+12 |
| Iran | 13 | 8896 | 8819 | 57470 | 19125 | 6.46 | 72 | 9.172000e+09 | 119 | 5.707721 | 3.895523e+11 | 4.250646e+11 | 4.289909e+11 | 4.389208e+11 | 4.677902e+11 | 4.853309e+11 | 4.532569e+11 | 4.445926e+11 | 4.639027e+11 | NaN |
| Australia | 14 | 8831 | 8725 | 90765 | 15606 | 10.28 | 107 | 5.386000e+09 | 231 | 11.81081 | 1.021939e+12 | 1.060340e+12 | 1.099644e+12 | 1.119654e+12 | 1.142251e+12 | 1.169431e+12 | 1.211913e+12 | 1.241484e+12 | 1.272520e+12 | 1.301251e+12 |
| Brazil | 15 | 8668 | 8596 | 60702 | 14396 | 7.00 | 86 | 1.214900e+10 | 59 | 69.64803 | 1.845080e+12 | 1.957118e+12 | 2.056809e+12 | 2.054215e+12 | 2.208872e+12 | 2.295245e+12 | 2.339209e+12 | 2.409740e+12 | 2.412231e+12 | 2.319423e+12 |
2, Q2
2.1 problem description
The previous question joined three datasets then reduced this to just the top 15 entries. When you joined the datasets, but before you reduced this to the top 15 items, how many entries did you lose?
This function should return a single number.

2.2 problem analysis
Some key fields only exist in one of the two tables. During internal connection, this field will not be connected and will be deleted; When making external connections, these fields will be retained. If there is no other table, NaN will be returned. In order to see how many rows of data have been deleted, just make external connections for all three tables and subtract the number of lists of internal connections. The code body is similar to the previous question.
2.3 code and detailed explanation
def answer_two():
    Energy=pd.read_excel('assets/Energy Indicators.xls',skiprows=16,usecols=[2,3,4,5])
    Energy=Energy[1:228]
    Energy.columns=['Country', 'Energy Supply', 'Energy Supply per Capita', '% Renewable']
    Energy.replace(to_replace=' \(.*\)$',value='',regex=True,inplace=True)
    Energy.replace(to_replace='[\d]+$',value='',regex=True,inplace=True)
    Energy.replace(to_replace='^[\.]+$',value=np.nan,regex=True,inplace=True)
    Energy['Energy Supply']=Energy['Energy Supply'].apply(lambda x:x*1000000)
    Energy['Country']=Energy['Country'].apply(change_country_values)
    #print(Energy)

    GDP=pd.read_csv('assets/world_bank.csv',skiprows=4)
    GDP['Country Name']=GDP['Country Name'].apply(change_country_values)
    GDP.rename(columns={'Country Name':'Country'},inplace=True)
    #print(GDP.head())

    ScimEn=pd.read_excel('assets/scimagojr-3.xlsx')
    #print(ScimEn)

    year=list(range(2006,2016))
    GDP_year=[str(i) for i in year]
    GDP_year.append('Country')
    GDP=GDP.loc[:,GDP_year]
    #print(GDP_year)

    merge1=pd.merge(Energy,GDP,left_on='Country',right_on='Country',how='inner')
    #print(len(merge1))

    #Three intra table connections
    merge2=pd.merge(ScimEn,merge1,on='Country',how='inner')
    #print(len(merge2))

    merge3=pd.merge(Energy,GDP,left_on='Country',right_on='Country',how='outer')
    #print(len(merge3))

    #Three off sheet connections
    merge4=pd.merge(ScimEn,merge3,on='Country',how='outer')
    #print(len(merge4))
    ans=len(merge4)-len(merge2)
    #print(ans)
    #print(merge2.columns)
    return ans
answer_two()
The result is 158
3, Q3
3.1 problem description
What are the top 15 countries for average GDP over the last 10 years?
This function should return a Series named avgGDP with 15 countries and their average GDP sorted in descending order.
3.2 problem analysis
Calculate the average value of 10 years. Use the apply() function to calculate the average value of the data of each year using the anonymous function.
In descending order, sort in DataFrame can be used_ Values() function.
3.3 code
def answer_three():
    df=answer_one()
    year=list(range(2006,2015))
    year=[str(i) for i in year]
    df['avgGDP']=df[year].apply(lambda x: np.nanmean(x),axis=1)
    df=df.sort_values(ascending=False,by='avgGDP')
    return df['avgGDP']
answer_three()
| Country | |
|---|---|
| United States | 1.523276e+13 |
| China | 6.076454e+12 |
| Japan | 5.528057e+12 |
| Germany | 3.471633e+12 |
| France | 2.672896e+12 |
| United Kingdom | 2.468081e+12 |
| Brazil | 2.175391e+12 |
| Italy | 2.128048e+12 |
| India | 1.702863e+12 |
| Canada | 1.645985e+12 |
| Russian Federation | 1.559827e+12 |
| Spain | 1.417885e+12 |
| Australia | 1.148797e+12 |
| South Korea | 1.088952e+12 |
| Iran | 4.441558e+11 |
4, Q4
4.1 problem description
By how much had the GDP changed over the 10 year span for the country with the 6th largest average GDP?
This function should return a single number.
4.2 problem analysis
How much has the sixth largest GDP economy changed in 10 years?
4.3 code
def answer_four():
    df=answer_one()
    year=list(range(2006,2015))
    year=[str(i) for i in year]
    df['avgGDP']=df[year].apply(lambda x: np.nanmean(x),axis=1)
    df=df.sort_values(ascending=False,by='avgGDP')
    return df.iloc[5]['2015']-df.iloc[5]['2006']
answer_four()
246702696075.3999
5, Q5
5.1 problem description
What is the mean energy supply per capita?
This function should return a single number.
5.2 problem analysis
What is the average per capita energy supply?
5.3 codes
def answer_five():
    df=answer_one()
    return df['Energy Supply per Capita'].mean()
answer_five()
157.6
6, Q6
6.1 problem description
What country has the maximum % Renewable and what is the percentage?
This function should return a tuple with the name of the country and the percentage.
6.2 problem analysis
Which country has the largest 'Renewable' value? What is the maximum value?
Here, I first convert the data in DataFrame into float, and then use the data in Series idmax() found the country where the maximum value is located
6.3 code
def answer_six():
    df=answer_one()
    return (df['% Renewable'].astype(float).idxmax(),df['% Renewable'].astype(float).max())
answer_six()
('Brazil', 69.65)
7, Q7
7.1 problem description
Create a new column that is the ratio of Self-Citations to Total Citations. What is the maximum value for this new column, and what country has the highest ratio?
This function should return a tuple with the name of the country and the ratio.
7.2 problem analysis
Use the self quotation amount / total quotation amount to obtain the quotation ratio, and find the country with the largest data and the largest value. The method is the same as that in the previous question
7.3 codes
def answer_seven():
    df=answer_one()
    df['ratio']=df['Self-citations']/df['Citations']
    return (df['ratio'].idxmax(),df['ratio'].max())
answer_seven()
('China', 0.69)
8, Q8
8.1 problem description
Create a column that estimates the population using Energy Supply and Energy Supply per capita. What is the third most populous country according to this estimate?
This function should return the name of the country
8.2 problem analysis
To estimate the population, you can use 'Energy Supply' / 'Energy Supply per capita'. The population can be obtained by dividing the total data by the per capita. The third largest can be arranged in descending order, and then the third data can be obtained
8.3 code
def answer_eight():
    df=answer_one()
    df['population']=df['Energy Supply']/df['Energy Supply per Capita']
    df.sort_values(by='population',ascending=False,inplace=True)
    return df.iloc[2].name
answer_eight()
'United States'
9, Q9
9.1 problem description
Create a column that estimates the number of citable documents per person. What is the correlation between the number of citable documents per capita and the energy supply per capita? Use the .corr() method, (Pearson's correlation).
This function should return a single number.
(Optional: Use the built-in function plot9() to visualize the relationship between Energy Supply per Capita vs. Citable docs per Capita)
9.2 problem analysis
The calculation of Pearson correlation coefficient is relatively simple. The code for choosing questions has been given, and the image can be obtained by running
9.3 code
def answer_nine():
    df=answer_one()
    df['population']=df['Energy Supply']/df['Energy Supply per Capita']
    df['citable documents per capita']=df['Citable documents']/df['population']
    return df['citable documents per capita'].astype(float).corr(df['Energy Supply per Capita'].astype(float))
answer_nine()
0.7940010435442946
10, Q10
10.1 problem description
Create a new column with a 1 if the country's % Renewable value is at or above the median for all countries in the top 15, and a 0 if the country's % Renewable value is below the median.
This function should return a series named HighRenew whose index is the country name sorted in ascending order of rank.
10.2 problem analysis
Find the median. If it is greater than or equal to the median, it returns 1, otherwise it returns 0
10.3 codes
def answer_ten():
    df=answer_one()
    df['flagRenew']= df['% Renewable']-df['% Renewable'].median()
    df['HighRenew']= df['flagRenew'].apply(lambda x:1 if x>=0 else 0)
    return df['HighRenew']
answer_ten()
| country | |
|---|---|
| China | 1 |
| United States | 0 |
| Japan | 0 |
| United Kingdom | 0 |
| Russian Federation | 1 |
| Canada | 1 |
| Germany | 1 |
| India | 0 |
| France | 1 |
| South Korea | 0 |
| Italy | 1 |
| Spain | 1 |
| Iran | 0 |
| Australia | 0 |
| Brazil | 1 |
11, Q11
11.1 problem description
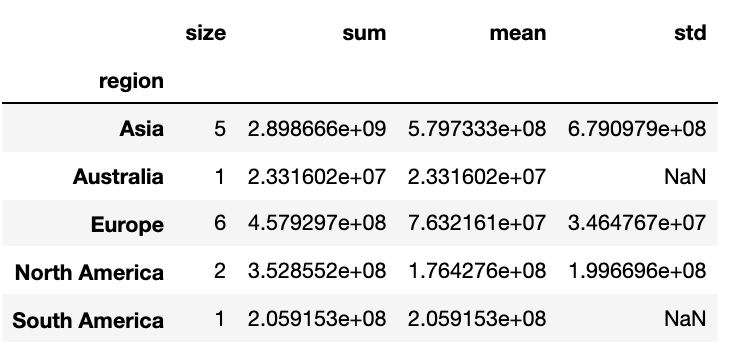
Use the following dictionary to group the Countries by Continent, then create a DataFrame that displays the sample size (the number of countries in each continent bin), and the sum, mean, and std deviation for the estimated population of each country.
ContinentDict  = {'China':'Asia',
                  'United States':'North America',
                  'Japan':'Asia',
                  'United Kingdom':'Europe',
                  'Russian Federation':'Europe',
                  'Canada':'North America',
                  'Germany':'Europe',
                  'India':'Asia',
                  'France':'Europe',
                  'South Korea':'Asia',
                  'Italy':'Europe',
                  'Spain':'Europe',
                  'Iran':'Asia',
                  'Australia':'Australia',
                  'Brazil':'South America'}
This function should return a DataFrame with index named Continent ['Asia', 'Australia', 'Europe', 'North America', 'South America'] and columns ['size', 'sum', 'mean', 'std']
11.2 problem analysis
Add the region information for each country, and calculate the size, sum, average and standard deviation according to the region. You can use the aggregation function, and the syntax is visible Merging, grouping and aggregation of DataFrame and PivotTable report (Chapter III grouping and aggregation)
11.3 codes
def region(row):
    ContinentDict  = {'China':'Asia',
                  'United States':'North America',
                  'Japan':'Asia',
                  'United Kingdom':'Europe',
                  'Russian Federation':'Europe',
                  'Canada':'North America',
                  'Germany':'Europe',
                  'India':'Asia',
                  'France':'Europe',
                  'South Korea':'Asia',
                  'Italy':'Europe',
                  'Spain':'Europe',
                  'Iran':'Asia',
                  'Australia':'Australia',
                  'Brazil':'South America'}
    #print(row.name)
    for key,values in ContinentDict.items():
        if row.name == key:
            row['region']=values
    return row
def answer_eleven():
    df=answer_one()
    df['population']=df['Energy Supply']/df['Energy Supply per Capita']
    df=df.apply(region,axis=1)
    new_df=df.groupby('region',axis=0).agg({'population':(np.size,np.nansum,np.nanmean,np.nanstd)})
    #new_df['size']=df.groupby('region',axis=0).size()
    new_df.columns=['size','sum','mean','std']
    #print(new_df)
    return new_df
answer_eleven()
12, Q12
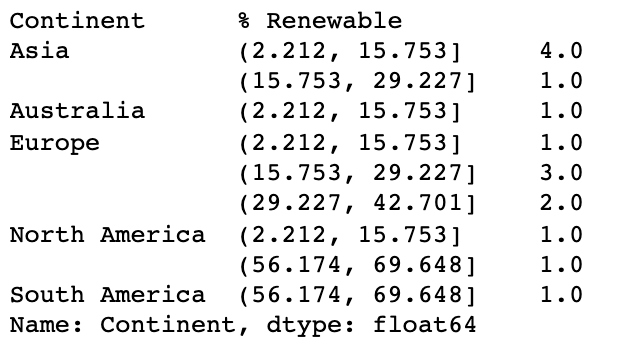
12.1 problem description
Cut % Renewable into 5 bins. Group Top15 by the Continent, as well as these new % Renewable bins. How many countries are in each of these groups?
This function should return a Series with a MultiIndex of Continent, then the bins for % Renewable. Do not include groups with no countries.
12.2 problem analysis
Divide the '% Renewable' into 5 boxes and calculate the size of each box. You can use PD Cut () to divide the box, and the calculated size is similar to the previous question
12.3 code
def region(row):
    ContinentDict  = {'China':'Asia',
                  'United States':'North America',
                  'Japan':'Asia',
                  'United Kingdom':'Europe',
                  'Russian Federation':'Europe',
                  'Canada':'North America',
                  'Germany':'Europe',
                  'India':'Asia',
                  'France':'Europe',
                  'South Korea':'Asia',
                  'Italy':'Europe',
                  'Spain':'Europe',
                  'Iran':'Asia',
                  'Australia':'Australia',
                  'Brazil':'South America'}
    #print(row.name)
    for key,values in ContinentDict.items():
        if row.name == key:
            row['Continent']=values
    return row

def answer_twelve():
    df=answer_one()
    df=df.apply(region,axis=1)
    df['% Renewable']=pd.cut(df['% Renewable'],5)
    new_df=df.groupby(['Continent','% Renewable'])['Continent'].agg(np.size).dropna()
    #new_df=new_df.set_index(['Continent','intervals'])
    return new_df

answer_twelve()
13, Q13
13.1 problem description
Convert the Population Estimate series to a string with thousands separator (using commas). Use all significant digits (do not round the results).
e.g. 12345678.90 -> 12,345,678.90
This function should return a series PopEst whose index is the country name and whose values are the population estimate string
13.2 problem analysis
Change data format
13.3 code
def answer_thirteen():
    df=answer_one()
    df['population']=df['Energy Supply']/df['Energy Supply per Capita']
    return df['population'].apply('{:,}'.format)
answer_thirteen()
| country | |
|---|---|
| China | 1,367,645,161.2903225 |
| United States | 317,615,384.61538464 |
| Japan | 127,409,395.97315437 |
| United Kingdom | 63,870,967.741935484 |
| Russian Federation | 143,500,000.0 |
| Canada | 35,239,864.86486486 |
| Germany | 80,369,696.96969697 |
| India | 1,276,730,769.2307692 |
| France | 63,837,349.39759036 |
| South Korea | 49,805,429.864253394 |
| Italy | 59,908,256.880733944 |
| Spain | 46,443,396.2264151 |
| Iran | 77,075,630.25210084 |
| Australia | 23,316,017.316017315 |
| Brazil | 205,915,254.23728815 |