The typical process of machine learning project starts with reading data, followed by some preprocessing, training, testing, visualization, and sharing the results with the notification system.
Of course, all steps can be easily completed with the help of various open source libraries. However, in some specific cases, such as anomaly detection in time series data, reducing the number of libraries and hard coding steps will be more conducive to interpretability. Therefore, pyfbad library is developed.
Github:https://github.com/Teknasyon-Teknoloji/pyfbad
Dry goods recommendation
- Absolutely. These six carefully selected machine learning materials are really delicious
- In depth inventory: these 20 sets of visual cool large screens are really fragrant (with source code)
- Python data analysis three musketeers are really fragrant, and there is a high-definition mind map
- Python programming from introduction to actual combat, read this article is enough
brief introduction
The pyfbad library is an end-to-end unsupervised exception detection package that provides the source code for all the ML Flow steps mentioned earlier. In other words, the whole cycle of the project can be completed with the source code provided by pyfbad without using any other libraries.
pyfbad has four main modules: database, feature, model and notification. With the help of Cookiecutter's Drivendata, this structure is almost standardized in data science projects.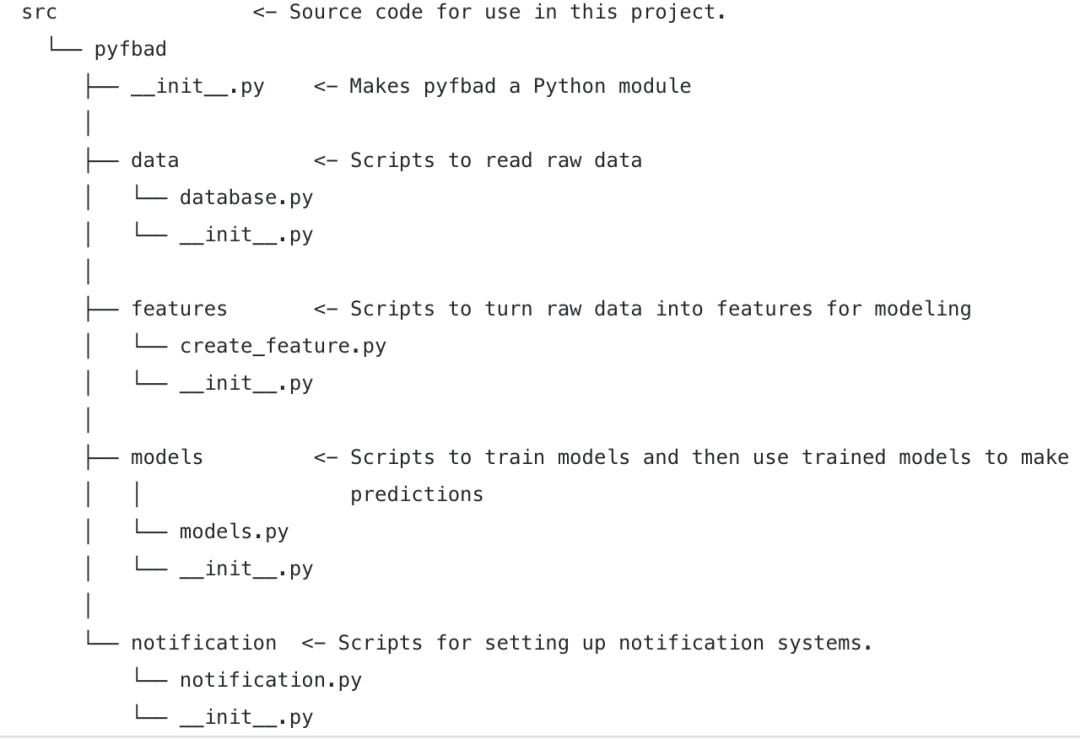
database
This module has scripts to read data from various databases or files. Especially in MongoDB, it becomes more user-friendly by using the filtering step through Pyfbad.
The following code snippet may describe how to use pyfbad for database operations.
# connet to mongodb
from pyfbad.data import database as db
database_obj = db.MongoDB('db_name', PORT, 'db_path')
database = database_obj.get_mongo_db()

# check the collections
collections = dataset_obj.get_collection_names(database)

# buil mongodb query
filter = dataset_obj.add_filter(
  [],
  'time',
  {
    "column_name": "datetime",
    "date_type": "hourly",
    "start_time": "2019-02-06 00:00:00",
    "finish_time": "2019-10-06 00:00:00"
  }
)

# get data from db as dataframe
data = dataset_obj.get_data_as_df(
    database=database,
    collection=collections[0],
    filter=filter
)
features
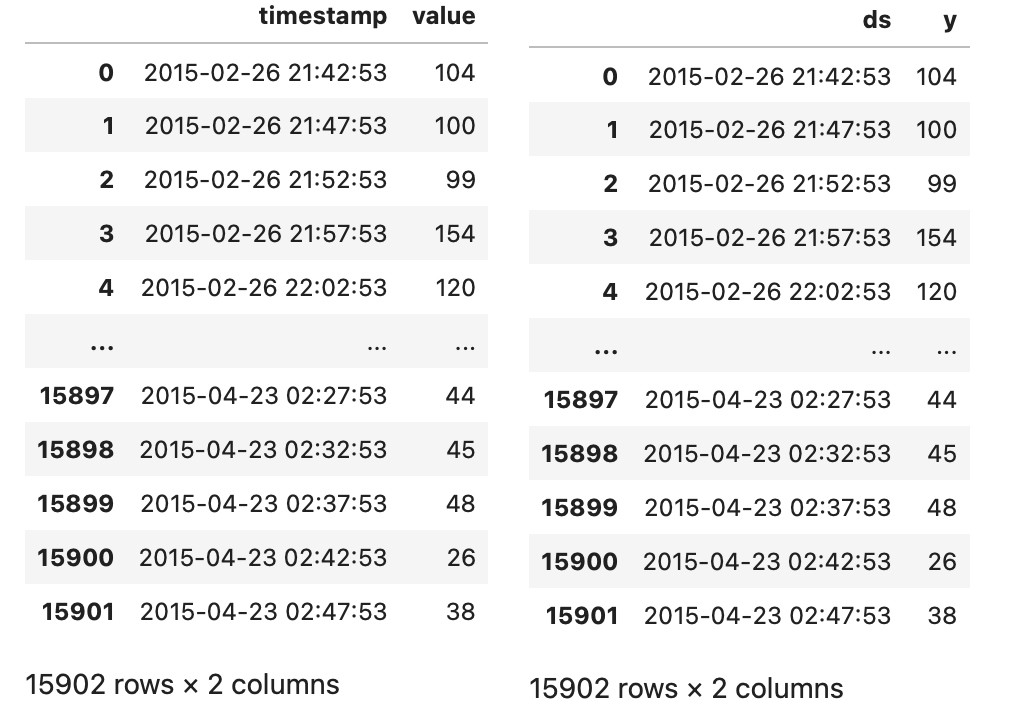
Time series anomaly detection requires two types of data. One is continuous time data, and the other is the master data we want to detect exceptions. These two data should be extracted from the original data as model data. Pyfbad provides an optional filtering function to retrieve model data from the original data frame.
The following code snippet shows how to use pyfbad for this operation.
from pyfbad.features import create_feature as cf

cf_obj = cf.Features()
df_model = cf_obj.get_model_data
(
  df = data,
  time_column_name = "_id.datetime",
  value_column_name = "_id.count",
  filter = ['_id.country','TR']
)
Model
The module can use various algorithms to train model data. Pyfbad is designed to detect anomalies on time series data. It provides models that can be applied quickly and robustly, such as Facebook Prophet and Isolation Forrest.
As an example, we can see from the following code snippet how Prophet is implemented with pyfbad.
from pyfbad.models import models as md

models=md.Model_Prophet()
model_result = models.train_model(df_model)
anomaly_result = models.train_forecast(model_result)
notice
pyfbad provides various notification systems to share the results of the project, such as e-mail, which can be used as the following code fragment.
from pyfbad.notification import notifications as nt

gmail_obj = nt.Email()
if 1 or -1 in anomaly_result['anomaly']:
    gmail_obj.send_gmail('sample_from@gmail.com','password','sample_to@gmail.com')
case
We quickly learn how to use Pyfbad by case. Taking the click data of a twitter product in the Kaggle competition as an example, the data and the full version of the code can be obtained at the end of the article.
Using pyfbad library to process data
import plotly.express as px
import pyforest
from plotly.offline import iplot
from pyfbad.data import database as db
from pyfbad.models import models as md
from pyfbad.features import create_feature as cf
from pyfbad.notification import notifications as ntf
import pandas as pd
conn=db.File()
df=conn.read_from_csv("/kaggle/input/nab/realTweets/realTweets/Twitter_volume_AAPL.csv")
df.head()
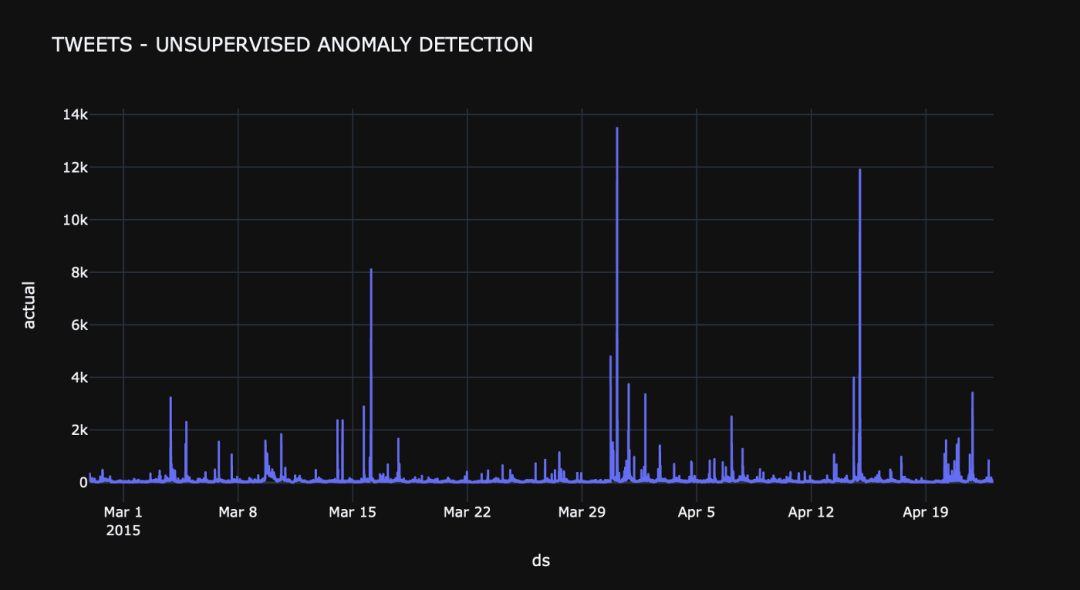
Data visualization, the effect is more intuitive.
import plotly.graph_objects as go
# plot value on y-axis and date on x-axis
fig = px.line(forcasted, x=forcasted.index, y="actual", title='TWEETS - UNSUPERVISED ANOMALY DETECTION', template = 'plotly_dark')
# create list of outlier_dates

fig.show()
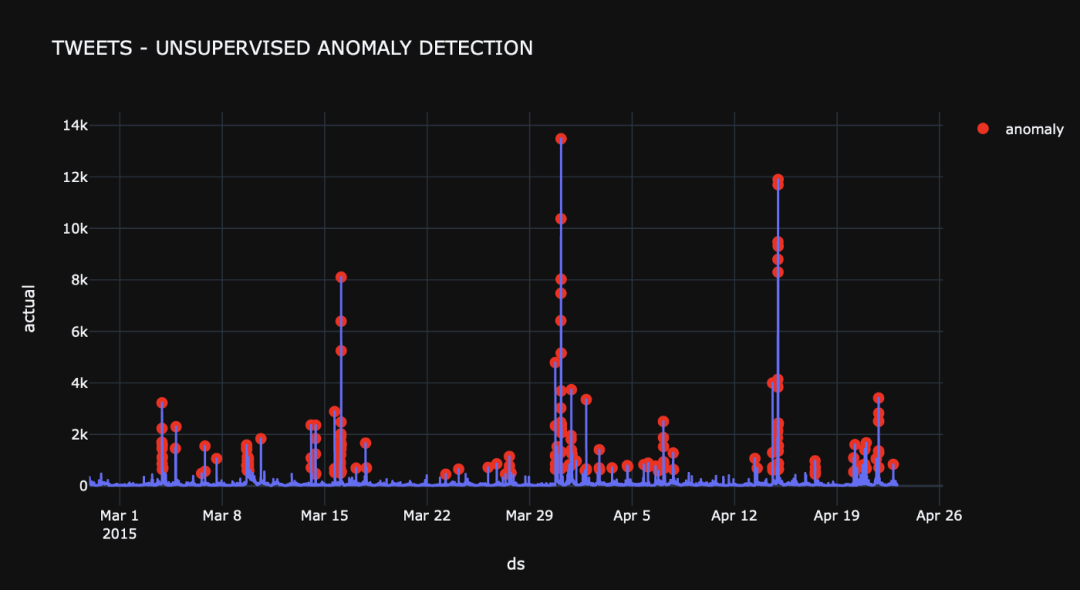
In this implementation, Prophet algorithm is used to train the model. After the training step, the detected abnormalities are shown in the figure below
forcasted=models.train_forecast(forecast)
outlier_dates = forcasted[forcasted['anomaly'] == 1].index
# obtain y value of anomalies to plot
y_values = [forcasted.loc[i]['actual'] for i in outlier_dates]
fig.add_trace(go.Scatter(x=outlier_dates, y=y_values, mode = 'markers',
                name = 'anomaly',
                marker=dict(color='red',size=10)))

fig.show()
conclusion
In this paper, we introduce Pyfbad in detail and share practical cases. It can be seen that it is simple and convenient to use. It is a rare unsupervised anomaly detection library.
Acquisition method
I have placed the code and data in the background, and I can get back to the background of the official account below: Pyfbad.
Method 1. WeChat search official account: Python learning and data mining, background reply: Pyfbad
Method 2. Scan QR code or send pictures to wechat for recognition, and reply to Pyfbad in the background