It takes about 5 minutes to read this article

-
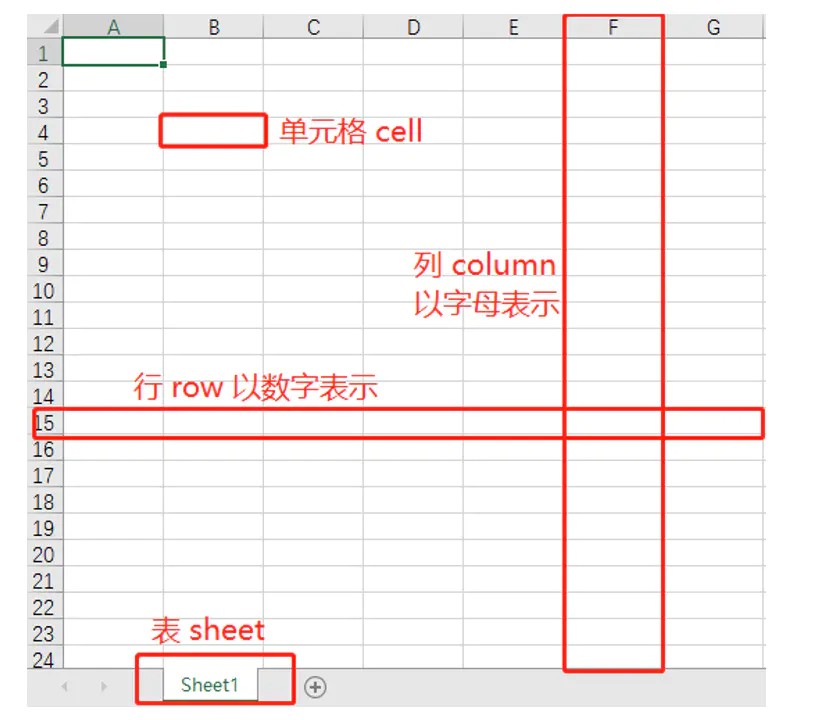
Main contents: Excel office automation and data analysis
-
Applicable population: office staff / Python beginners / personnel interested in data analysis
-
Preparation content: Anaconda Spyder, Pandas Library
If you will not install the library, you can refer to the following tutorials:
How Anaconda installs Python Libraries
 Pick to
There are many tutorials on data analysis on the Internet and in books, but OF holds the mission OF making data analysis the most complete, the simplest and the most practical, so that everyone can really master Pandas and use it perfectly.
1. Pandas data structure, i.e. basic principles (learning will get twice the result with half the effort)
Easy to learn Python data analysis 1 - the simplest and practical explanation of Pandas
2. Data reading and generation
3. Data processing (data cleaning, etc.)
4. Data visualization chart
5. Project practice
Today, we will introduce the practical application. First, let's introduce Part 2: how to read Excel data and generate excel.
Read Excel
1. Read Excel content
If the read path is in the same folder as python, write the file name directly. If it is not in the same folder, write the full path.
import pandas as pddf = pd.read_excel('./data/test_insert.xlsx') #File path print(df)
2. Read the first few lines
The head (n) method is used to read the previous n lines. If the parameter n is not filled in, 5 lines are returned by default.
import pandas as pddf = pd.read_excel('./data/test_insert.xlsx') #File path print(df.head(2))Operation results:
Odd Numbers quantity time difference Creation time Audit date Class code class name 0 SD1907 twenty-one 004 5 twenty-one.697014 2019-10-27 16:45:53 2019-10-28 1 Effect 1 SD191016007 6 115.231053 2019-10-27 15:twenty-one:25 2019-10-28 2 other Read the contents of the last few lines: the tail (n) method is used to read the N lines at the end. If the parameter n is not filled in, 5 lines are returned by default, and the values of each field in an empty line are returned to NaN.
import pandas as pddf = pd.read_excel('./data/test_insert.xlsx') #File path print(df.tail(3))Operation results:
Odd Numbers quantity time difference Creation time Approval date category code category name 19 SD191025004 25.0 52.976748 20 twenty-one-04-07 00:00:00 2019-10-28 5.0 Size 20 SD191022004 27.0 52.976748 2019-10-27 14:52:53 2019-12-02 5.0 Size 21 SD191022005 NaN NaN NaT NaT
3. Read Excel basic information
The info() method returns some basic information about the table.
import pandas as pddf = pd.read_excel('./data/test_insert.xlsx') #File path print(df.info())Operation results:
<class 'pandas.core.frame.DataFrame'>RangeIndex: 22 entries, 0 to 21Data columns (total 7 columns):Odd Numbers 22 non-null object quantity 21 non-null float64 time difference 21 non-null float64 Creation time 21 non-null datetime64[ns]Audit date 21 non-null datetime64[ns]Category code 21 non-null float64 Category name 21 non-null objectdtypes: datetime64[ns](2), float64(3), object(2)memory usage: 1.3+ KBNone
From here, we can see the number of rows and columns in Excel, which columns have null values, etc.
4. Read other Sheet pages (read_excel function)
For example, if we want to read "Sheet2" instead of the default "Sheet1", we need to write:
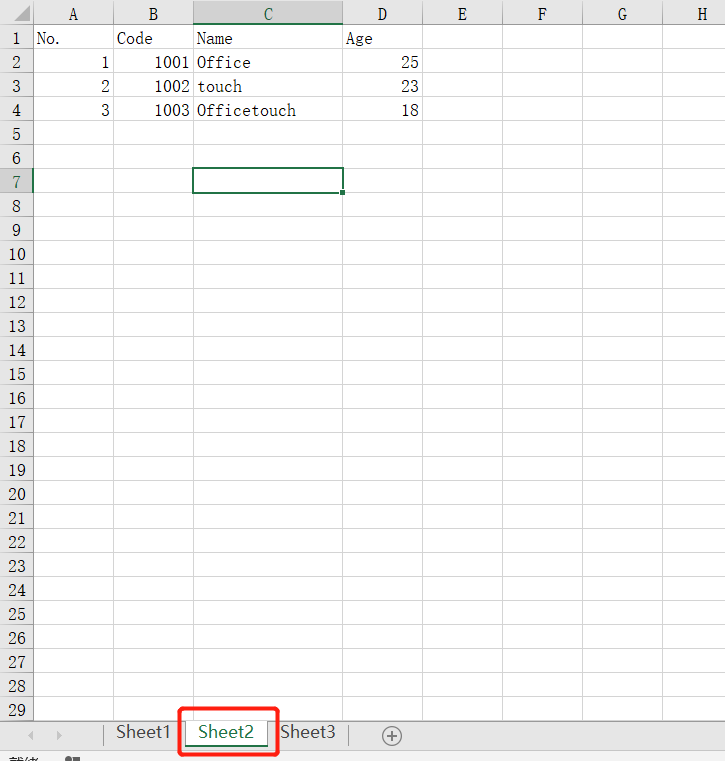
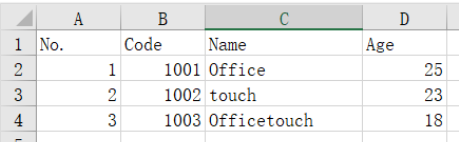
import pandas as pddf = pd.read_excel('./data/test_insert.xlsx',sheet_name='Sheet2') #File path print(df)Operation results:
No. Code Name Age0 1 1001 Office 251 2 1002 touch 232 3 1003 Officetouch 18
Readers who already have a foundation can carefully read the following contents. We can have a deeper understanding of Python and know why. Let's learn about read_ Common parameters of Excel function:
Although we can search read online_ Excel function, but every time we search online, it's always trouble + a little knowledge, so we take this opportunity to understand why we can use Pandas to realize so many functions.
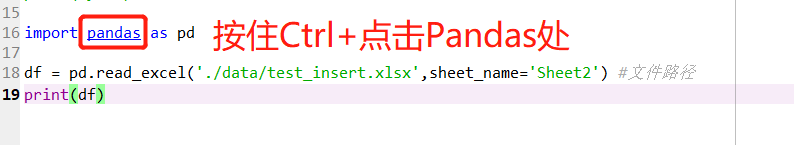
1) On your own program, press and hold Ctrl + click pandas to enter the pandas program, and then we Ctrl+F to search read_excel
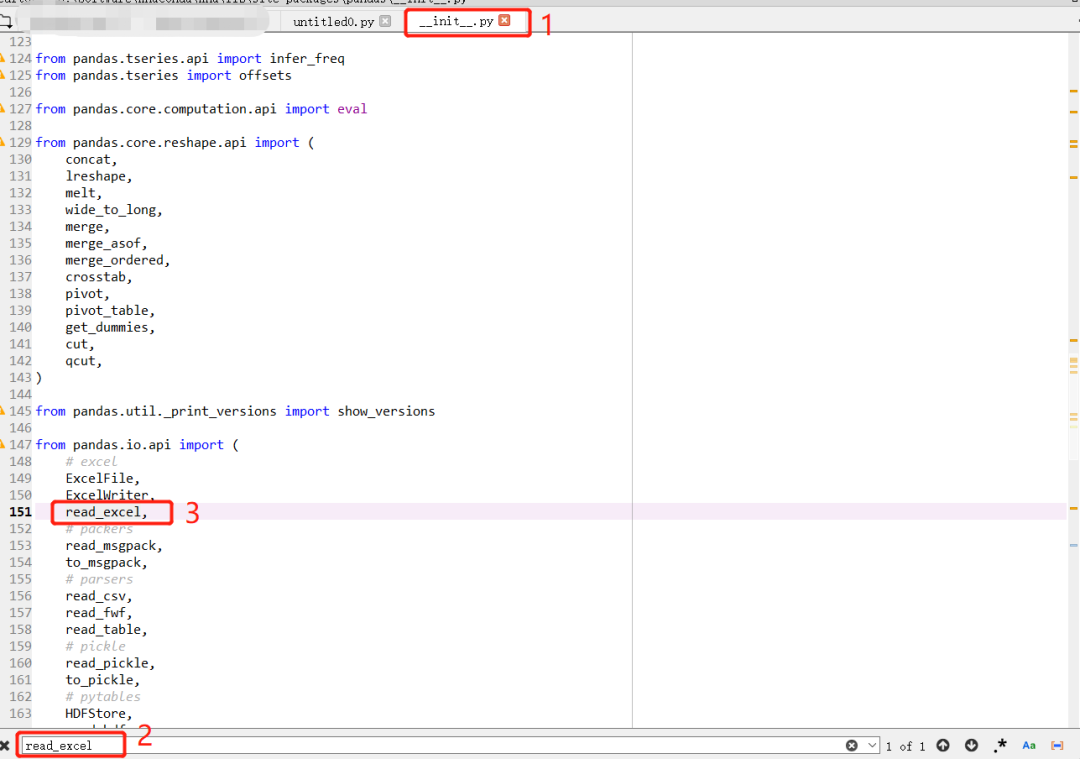
2) Press Ctrl + click read_excel, we can see read_ Contents of Excel functions
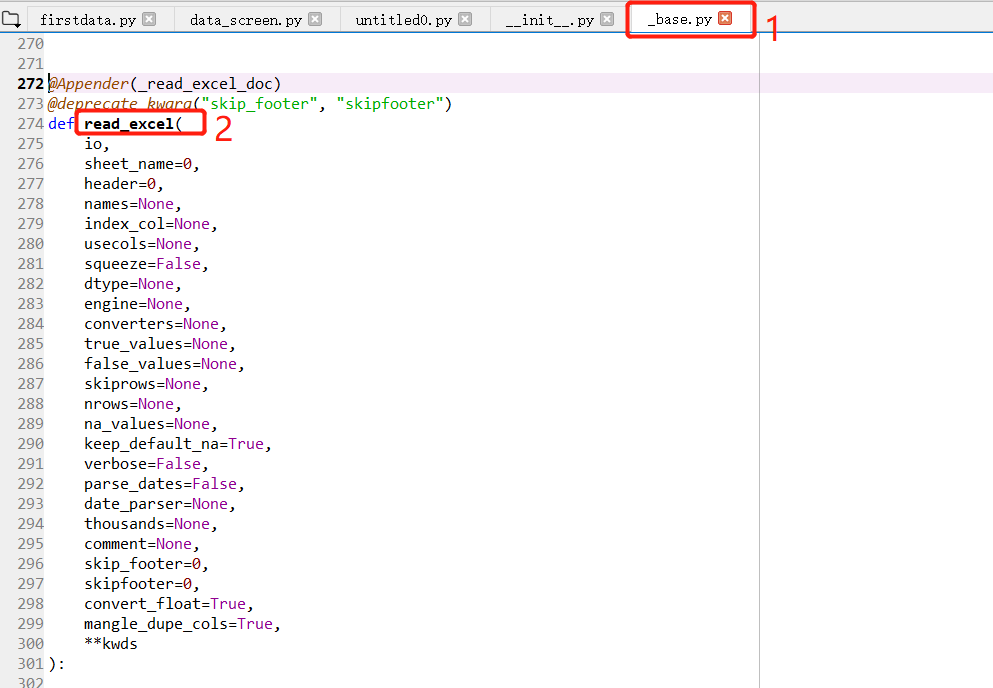
Here, we can know the parameter names we want to use, such as "sheet_name", "index_col", etc.
5. Read the data of the specified condition
In the basic principles of Pandas, we have said that you can use the loc function to read the data of the specified row. Today we will introduce it a little more. For example, we need to display only data older than 20:
import pandas as pddf = pd.read_excel('./data/test_insert.xlsx',sheet_name='Sheet2') #File path print (DF. LOC [DF ['age '] > 20])Operation results:
No. Code Name Age0 1 1001 Office 251 2 1002 touch 23
Generate Excel
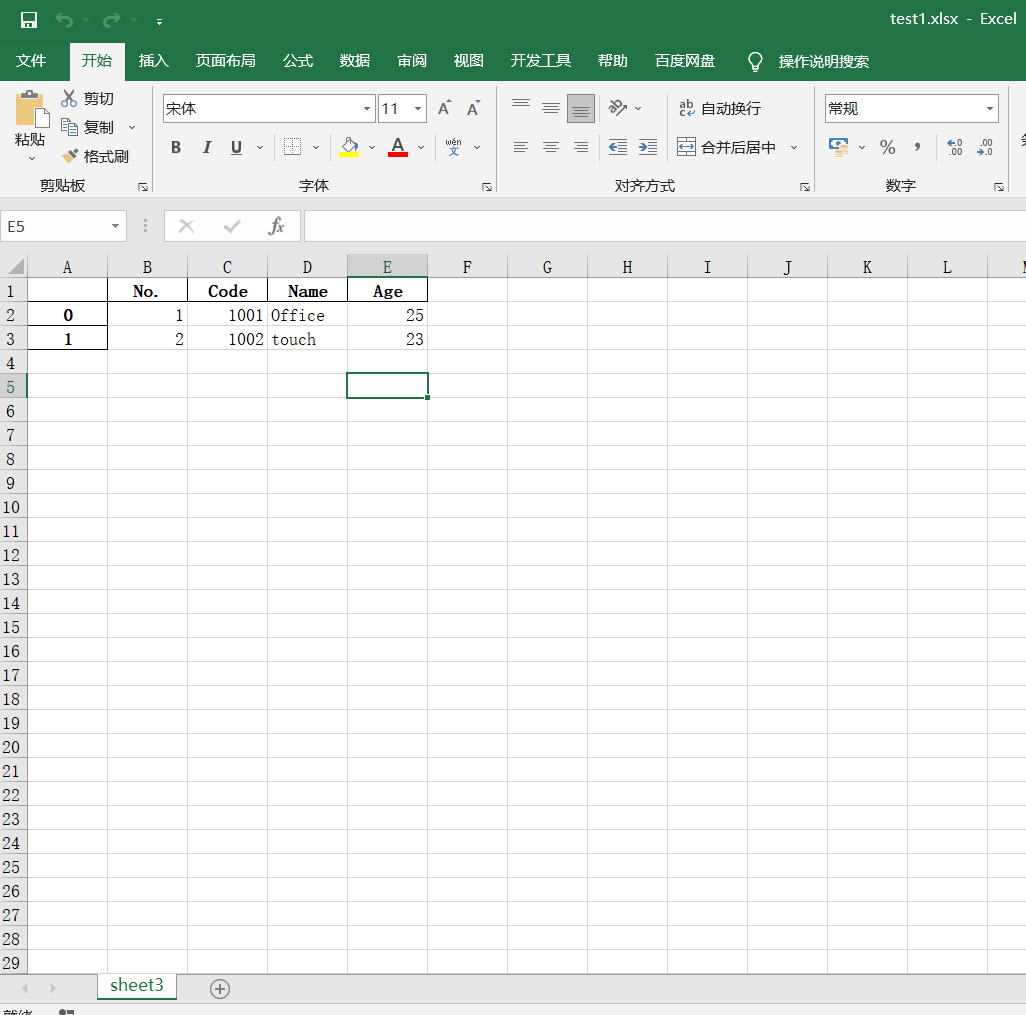
Today, let's briefly explain how to generate Excel. For example, after processing the data in the above figure, we need to export the data with age > 20 to Excel.
import pandas as pddf = pd.read_excel('./data/test_insert.xlsx',sheet_name='Sheet2') #File path DF1 = DF loc[df['Age']>20]df1. to_ excel('./data/test1.xlsx',sheet_name="sheet3")After running, we can find test1 under the specified path Xlsx, isn't it simple?
Concluding remarks
Today, OF introduces the relevant knowledge OF Excel reading and generation. In the third article on data processing, we will add more knowledge points. OF mainly introduces the most complete, simplest and practical methods to learn office automation and data analysis. It is enough to use Pandas to process Excel data. Like other python libraries such as openpyxl, xlwings and xlsxwriter, you can learn by yourself if you are interested. The content OF the next few issues will be more practical. Look forward to it!
3. Pandas data processing (data cleaning, etc.)
4. Pandas data visualization chart
5. Project practice of Pandas
-
If readers have any suggestions on the selection and content, please feel free to comment or write to me. As long as it is a good suggestion, OF will not disappoint you and will be pleasantly surprised 🎁 Here you go.
-
If the students have questions about the knowledge points or want to learn more useful knowledge, please comment or write to me at any time. Please believe in the sincerity OF of and will try to help you find - solve problems and improve their core competitiveness.