1: example of the instrument panel in three minutes after echarts
- Import related documents
<!-- Introduce echarts.js -->
        <script src="js/echarts.min.js"></script>
        <script src="js/jquery-1.11.3.js"></script>
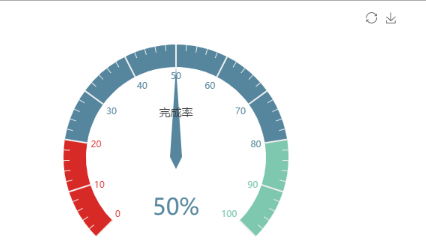
- The original default display is as follows
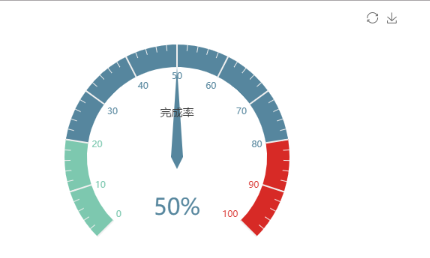
Picture.png
- Three minute code
Reference API: http://echarts.baidu.com/examples/editor.html?c=gauge
<!DOCTYPE html>
<html>

    <head>
        <meta charset="utf-8">
        <title>Three minute dashboard</title>
        <!-- Introduce echarts.js -->
        <script src="js/echarts.min.js"></script>
        <script src="js/jquery-1.11.3.js"></script>
    </head>

    <body>
        <!-- by ECharts Prepare a Dom -->
        <div id="main" style="width: 600px;height:400px;"></div>
        <script type="text/javascript">
            // Initialize the echarts instance based on the prepared dom
            var myChart = echarts.init(document.getElementById('main'));
            // Specify configuration items and data for the chart
            myChart.setOption({
                tooltip: {
                    formatter: "{a} <br/>{b} : {c}%"
                },
                toolbox: {
                    feature: {
                        restore: {},
                        saveAsImage: {}
                    }
                },
                series: [{
                    name: 'Business indicators',
                    type: 'gauge',
                    detail: { formatter: '{value}%' },
                    data: [{ value: 50, name: 'Completion rate' }]
                }]
            });

            setInterval(function() {
                option.series[0].data[0].value = (Math.random() * 100).toFixed(2) - 0;
                myChart.setOption(option, true);
            }, 2000);
        </script>
    </body>

</html>
2: relevant modifications
-
Requirement 1: change the overall background color to black
First, change the overall background color to black, and add the attribute: backgroundColor: 'ා 12cf96',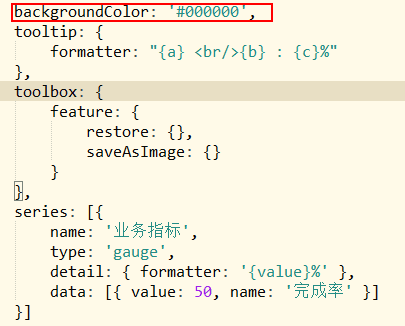
Picture.png
The effect is as follows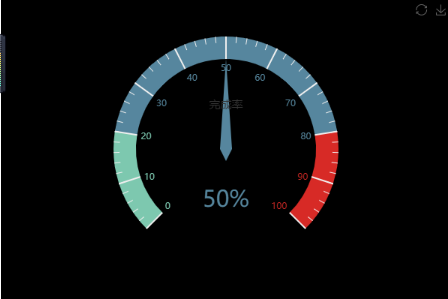
Picture.png
-
Requirement 2: dial scale color
Add code to the series so that red is 0-20 and 80-100 is green
axisLine: {            // Axis of coordinates
                     lineStyle: {       // Property lineStyle controls line style
                         color: [[0.2, '#c23531'], [0.8, '#63869e'], [1, '#91c7ae']]
                                }
                            },
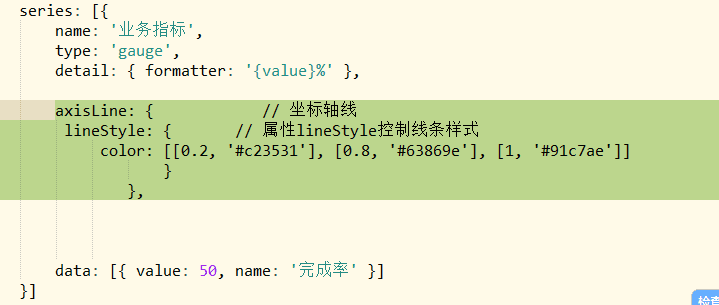
Picture.png
Original author: miss qiche
Pay attention to the public address of "programming micro magazine", reply back to "receive resources", get IT resources and small program 500G dry goods.