Which is better, MCU or DC? Which movie has higher ratings? This article will analyze marvel and DC films based on total box office and ratings
Which is better, Marvel Cinematic vs DC Universe? It's an endless debate, isn't it? When you oppose any of these movies, fans will become crazy. In this article, we will compare Marvel and DC according to some data. The data can always tell the truth.
MCU and DC
A link to download the dataset is provided at the end of this article. You can write Python code in Jupyter Notebook, Google Colab, or any other preferred editor.
Code and analysis
import pandas as pd
import scipy.stats as stats

import matplotlib.pyplot as plt
from matplotlib.pyplot import figure
import plotly
import plotly.express as px
% matplotlib inline
Let's load the data and see what it looks like first.
df = pd.read_csv("/content/mdc.csv", encoding='latin-1')
df.head()
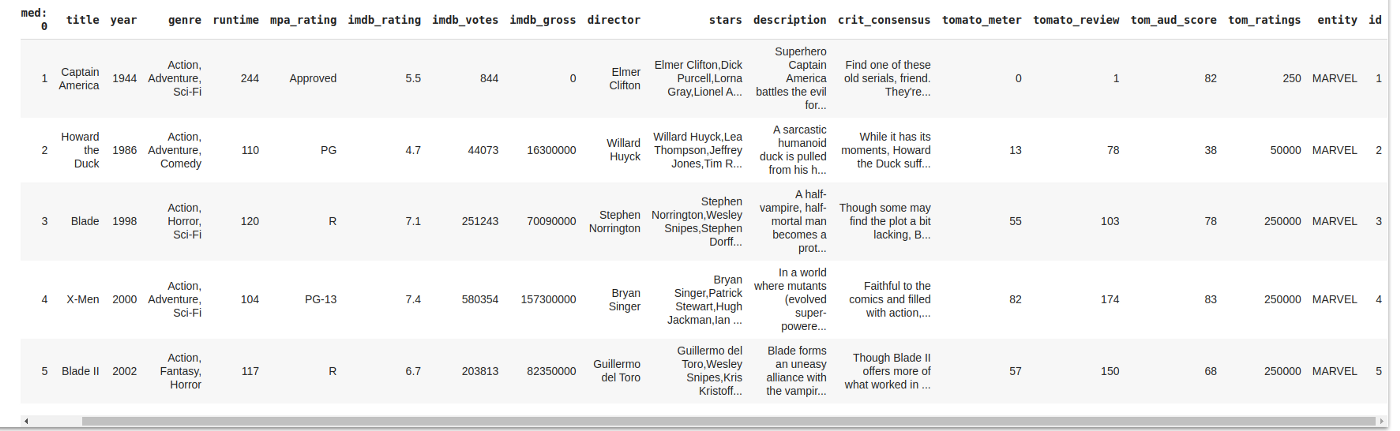
The data includes film name, release year, film type, IMDB rating, IMDB total revenue, etc.
Here's more information
df.describe()

df.info()
These two functions can help us view the general situation of data, such as the data type and information of each column, and check the null value in each column. There are no null values in our dataset.
Data correlation
f,ax = plt.subplots(figsize=(14,10))
sns.heatmap(df.corr(), annot=True, fmt=".2f", ax=ax)
plt.show()
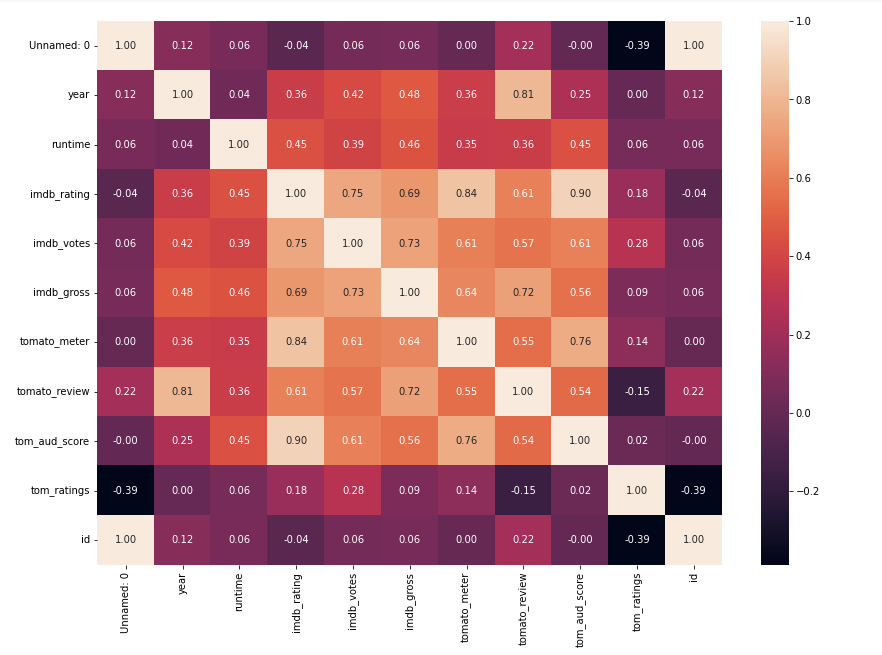
The above is the heat map of the correlation between the two columns
If you want to watch Marvel movies or DC movies, you can do this by filtering data. like this:
df[df.entity == 'MARVEL'].tail(5)

df[df.entity == 'DC'].tail(5)
Who makes more movies?
fig = plt.figure(figsize = (10,10))
ax = fig.subplots()
df.entity.value_counts().plot(ax=ax, kind='pie')
ax.set_ylabel("")
ax.set_title("MARVEL VS DC (No. of Movies)")
plt.show()
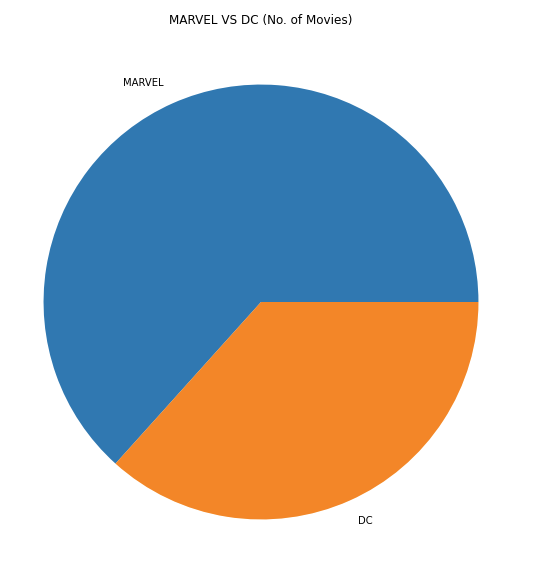
The pie chart above clearly tells us that Marvel produces more films than DC. Here, MCU won a big victory.
Film type
fig = plt.figure(figsize = (10,10))
ax = fig.subplots()
df[df.entity == 'MARVEL'].genre.value_counts().plot(ax=ax, kind='pie')
ax.set_ylabel("")
ax.set_title("Marvel Movie Genre Type")
plt.show()
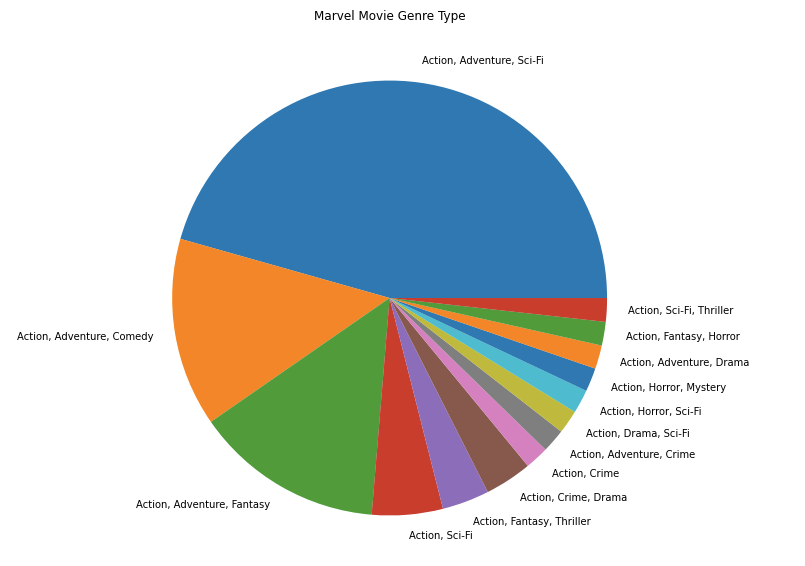
As you can see, most types of Marvel movie universe are action, adventure, science fiction, comedy and fantasy. Now let's look at DC.
fig = plt.figure(figsize = (10,10))
ax = fig.subplots()
df[df.entity == 'DC'].genre.value_counts().plot(ax=ax, kind='pie')
ax.set_ylabel("")
ax.set_title("DC Movie Genre Type")
plt.show()
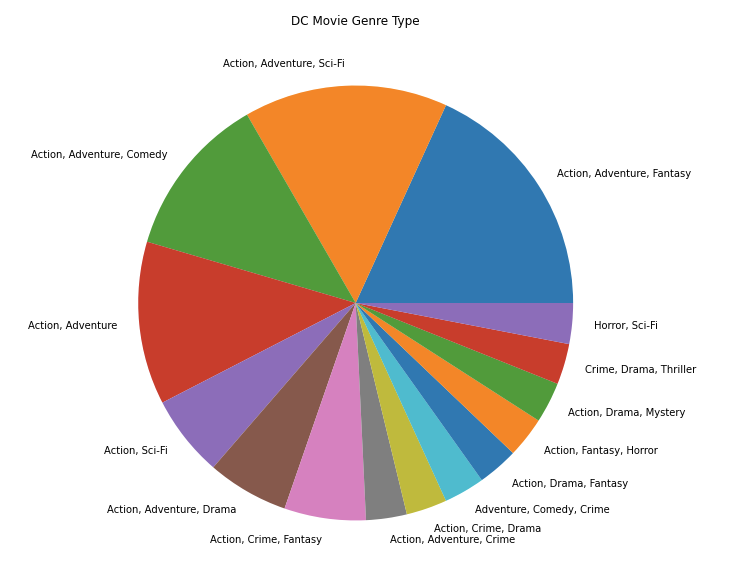
You can see that DC films are more diverse than Marvel films. DC tried more types (although failed, ha). I think this is the best part of DC Universe.
The highest rated marvel and DC films based on IMDB
dc_movies = df[df.entity == 'DC']
marvel_movies = df[df.entity == 'MARVEL']

#Average and highest rated of dc moviesavrg_dc_imdb = dc_movies['imdb_rating'].mean()
avrg_dc_imdb = dc_movies['imdb_rating'].mean()
highest_dc_imdb = dc_movies['imdb_rating'].max()
print("Average: ",avrg_dc_imdb, "\n Highest: ",highest_dc_imdb)

#Average and highest rated of marvel movies
avrg_marvel_imdb = marvel_movies['imdb_rating'].mean()
highest_marvel_imdb = marvel_movies['imdb_rating'].max()
print("Average: ",avrg_marvel_imdb, "\n Highest: ",highest_marvel_imdb)
The result is this
###DC###
Average:  6.133333333333335
 Highest:  9.0

###MARVEL####
Average:  6.794736842105261
 Highest:  8.4
The average score of DC films was 6.133 and that of Marvel films was 6.794. DC has one of the highest ratings movies ever.
IMDB score and box office
plt.scatter(data = marvel_movies, x = 'imdb_rating', y = 'imdb_gross')
plt.scatter(data = dc_movies, x = 'imdb_rating', y = 'imdb_gross')
plt.title('Marvel vs. DC in imdb ratings and gross')
plt.xlabel('IMDb Ratings')
plt.ylabel('IMDb Gross')
plt.legend(['Marvel', 'DC'])
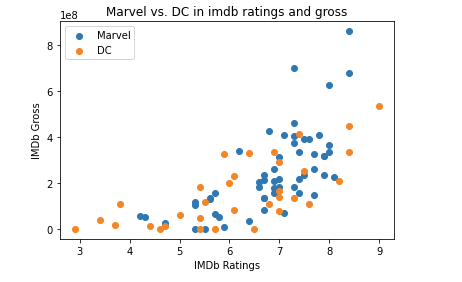
In terms of total box office, a few Marvel films are significantly ahead of DC. Most Marvel films have IMDB scores between 6.7 and 8.2.
The scores of DC films are evenly distributed in the figure. The total box office performance of IMDB is good, but if it is compared with marvel, they are much less.
The one with the lowest score must be the green lantern 😎
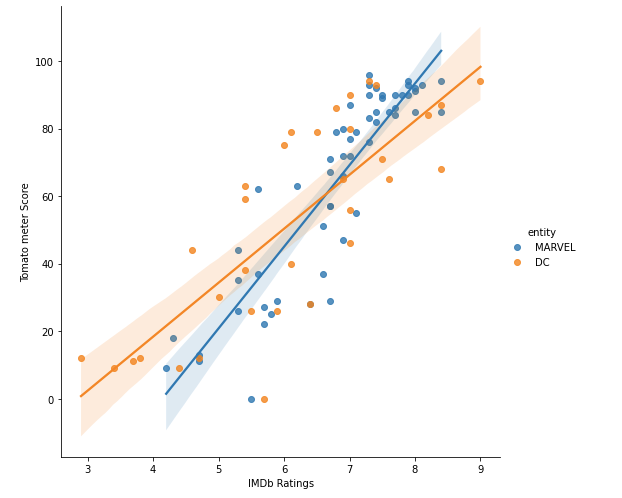
Tomato vs IMDB score
Note: tomato meter is the score from rotten tomatoes
imdb_vs_tm = sns.lmplot(data=df, x="imdb_rating", y="tomato_meter", hue="entity", height=7)
imdb_vs_tm.set_axis_labels("IMDb Ratings", "Tomato meter Score")
IMDB based DC movie list
top_dc_movie = dc_movies.groupby('title').sum().sort_values('imdb_rating', ascending=False)
top_dc_movie = top_dc_movie.reset_index()
px.bar(x='title', y ="imdb_rating", data_frame=top_dc_movie)
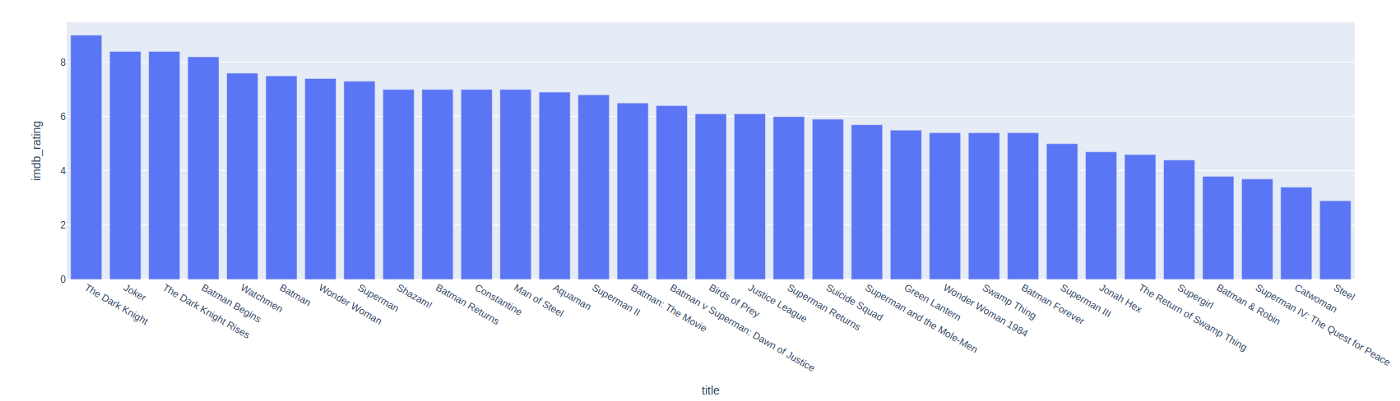
The dark knight is the most watched DC movie. Its IMDB score is 9. Heath Ledger has no clowns after that. This film shows the ability of DC Universe.
List of Marvel movies based on IMDB
top_marvel_movie = marvel_movies.groupby('title').sum().sort_values('imdb_rating', ascending=False)
top_marvel_movie = top_marvel_movie.reset_index()
px.bar(x='title', y ="imdb_rating", data_frame=top_marvel_movie)
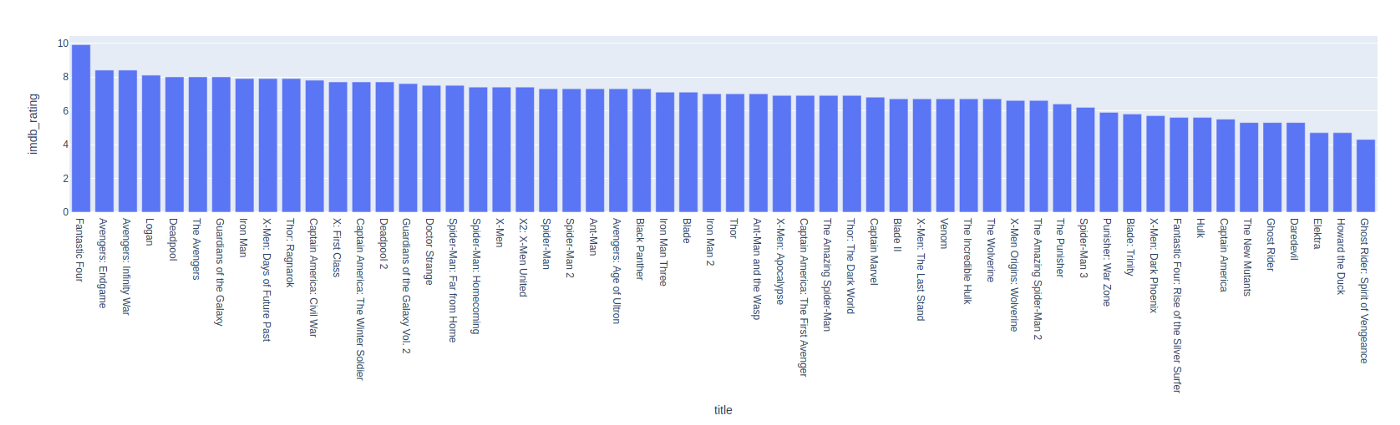
The final battle of the Avengers is Marvel's highest rated film. Its IMDB score is 8.4. Here may be some errors in the data set, because it shows that the magic four has the highest score. You don't believe it, do you 😂.
Release time
###Marvel###
avrg_marvel_runtime = marvel_movies['runtime'].mean()
highest_marvel_runtime = marvel_movies['runtime'].max()

###DC###
avrg_dc_runtime = dc_movies['runtime'].mean()
highest_dc_runtime = dc_movies['runtime'].max()

print("Marvel\nAverage: ",avrg_marvel_runtime, "\n Highest: ",highest_marvel_runtime)
print("DC\nAverage: ",avrg_dc_runtime, "\n Highest: ",highest_dc_runtime)
The output is as follows
Marvel
Average:  124.54385964912281
 Highest:  244
DC
Average:  123.45454545454545
 Highest:  164
The average release time of marvel and DC films is almost the same. But there is a big difference in their highest time.
Box office comparison based on IMDB
top_marvel_movie_gross = marvel_movies.groupby('title').sum().sort_values('imdb_gross', ascending=False)
top_marvel_movie_gross = top_marvel_movie_gross.reset_index()
px.bar(x='title', y ="imdb_gross", data_frame=top_marvel_movie_gross)
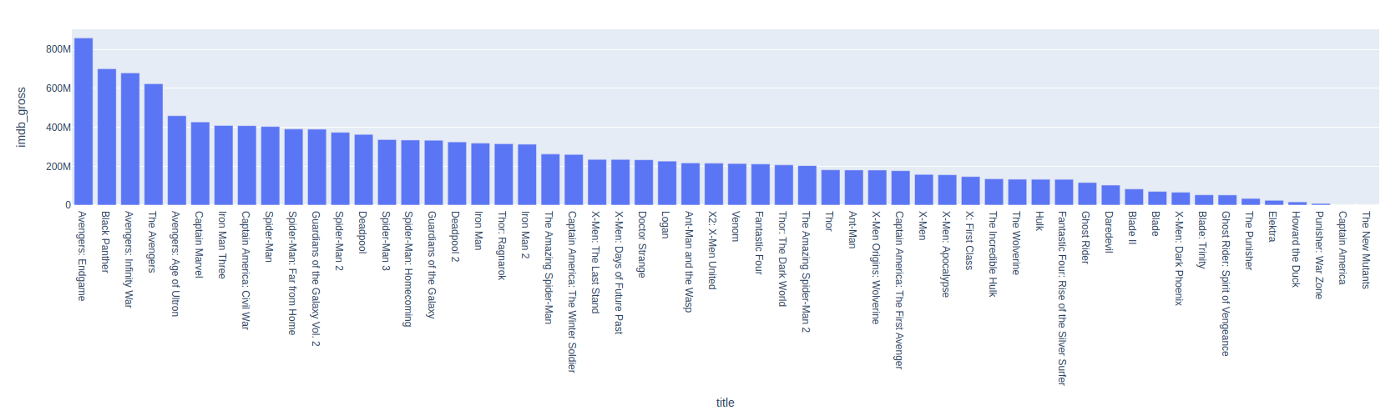
As we all know, "Avengers 4: the final battle" tops the list, followed by "Panther", "Infinite War" and so on. The total revenue of the final battle on IMDB exceeds $800.
top_dc_movie_gross = dc_movies.groupby('title').sum().sort_values('imdb_gross', ascending=False)
top_dc_movie_gross = top_dc_movie_gross.reset_index()
px.bar(x='title', y ="imdb_gross", data_frame=top_dc_movie_gross)
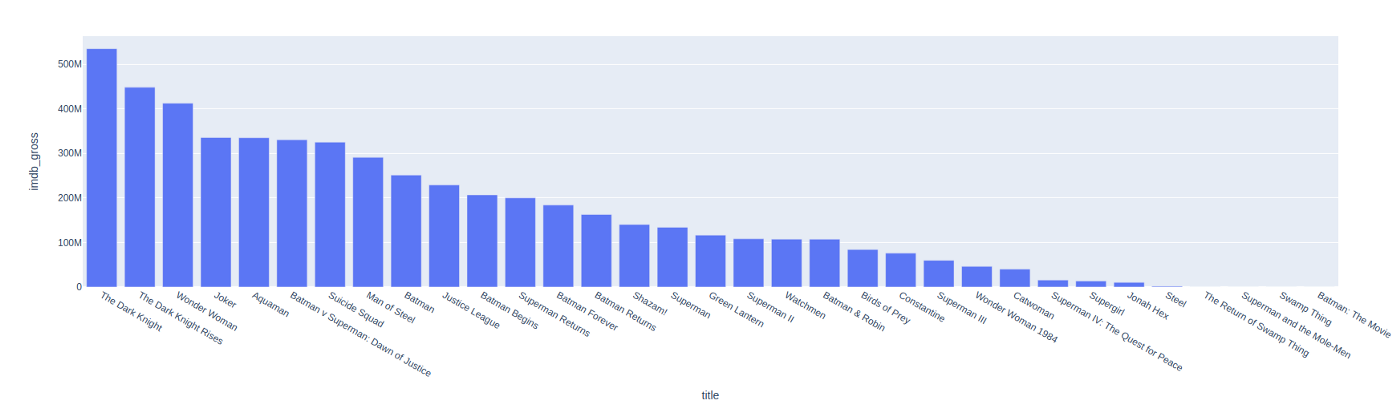
The dark knight's IMDB has the highest total revenue. In terms of revenue, DC is far from marvel.
Total revenue comparison between marvel and DC
fig = px.line(df, x="year", y="imdb_gross", color='entity')
fig.show()
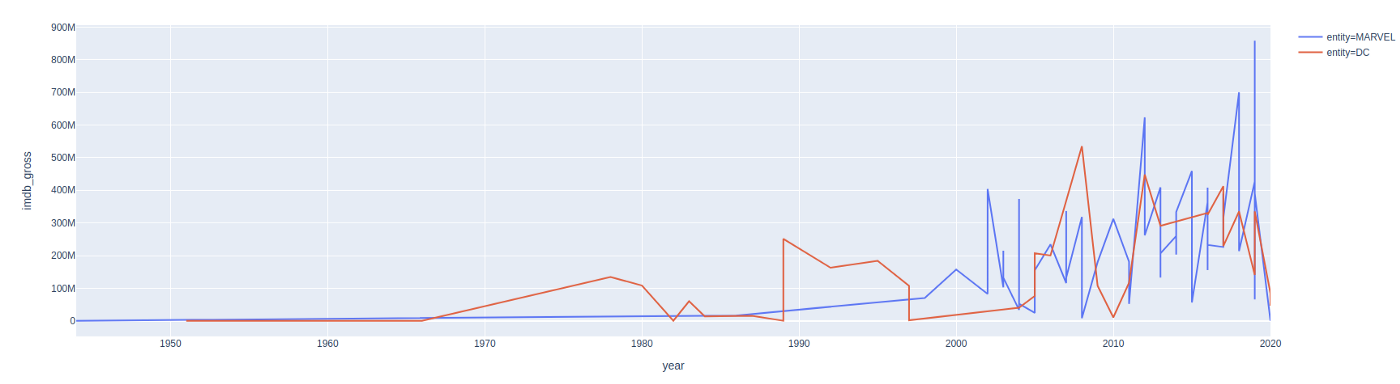
In the past few years, Marvel's IMDB box office revenue has far exceeded DC's.
Frequency comparison of marvel or DC films
fig2 = px.line(df, x='year', y='title', color='entity')
fig2.show()
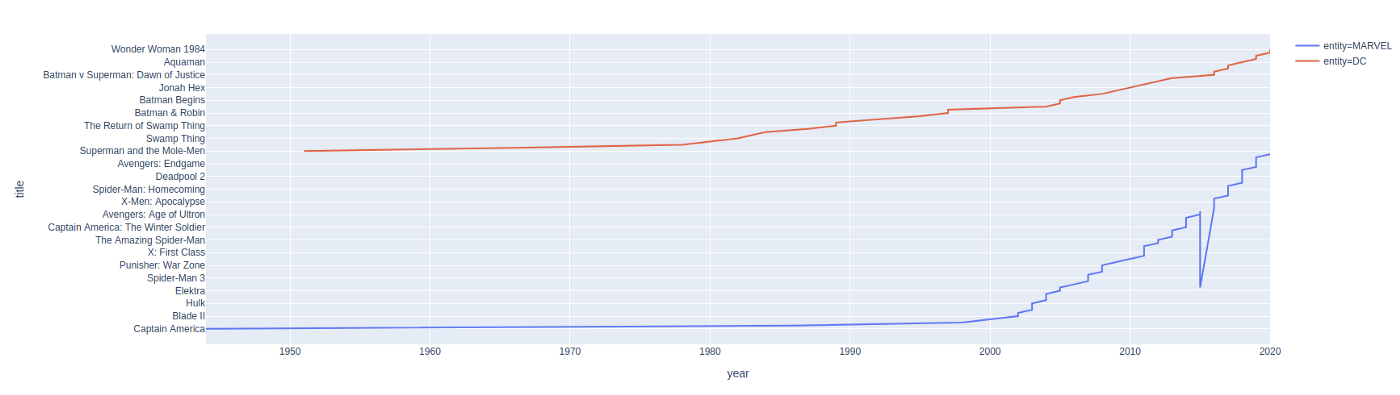
From the above figure, we can conclude that after 2002, marvel produced films more frequently than DC. Perhaps this is why DC's fan base is slightly lower than marvel.
summary
In the above comparison, we can't judge which of the two film production companies is good and which is bad, but the two production companies have been making good films and bringing joy to the audience in the past few decades, which is enough.
Finally, the collab address of this article: https://colab.research.google.com/drive/12DPN0BFYz0Slq2J8m-ney10x8DHWG8zh?usp=sharing
If you can't see the picture clearly, you can also view it directly on collab.
Author: Rohit Kumar Thakur