ELK was renamed elastic stack after it added beats suite after releasing 5.0. Beats is a group of lightweight software, which provides us with a simple and fast way to collect and enrich more data in real time to support our analysis. However, since beats need to be installed outside the ELK cluster, on the host, its impact on the performance of the host often becomes the key to consider whether it can be used, rather than what functions it provides. Because the stable operation of the business is the core KPI, and other data generated by operation and maintenance is always a lower priority. There may be many aspects that affect the performance of the host, such as CPU occupancy, network throughput occupancy, disk IO, memory, etc. Here we will discuss the problem of memory leakage in detail
Filebeat is one of the core components of beats Suite (another core is metricbeat). It is generally installed in the same place as the program generating the collected files (mainly logs). According to the official recommendation, filebeat is not recommended to collect data on NFS (network shared disk). When filebeat runs, it will certainly consume cpu, memory, network and other resources. When this consumption can be limited to an acceptable range, I don't think anyone will restrict you to use filebeat in the production environment. However, if there are some unexpected situations, such as occupying a large amount of memory, the operation and maintenance team must give priority to ensuring the resources of the core business and kill the filebeat process. Unfortunately, the problem of memory leakage has not been completely solved since the birth of filebeat. No matter what version (the latest version 6.5 has not been observed for the time being), it takes up too much memory in different scenarios and configurations. Here, I mainly describe the problems I encountered on filebeat 6.0.
Problem scenario and configuration
We use a unified simple configuration to monitor many hosts. It is this undifferentiated simple configuration that causes problems. This is wrong, this is wrong, this is wrong!!! The reasonable way is to analyze specific problems and make customized configurations for different scenarios.
- multiline, multi line configuration, when the log file does not meet the specification and a large number of matching pattern s, it will cause memory leakage
- max_procs, which limits the number of filebeat processes, is actually the number of cores. It is recommended to manually set it to 1
filebeat.prospectors:
- type: log
  enabled: true
  paths:
    - /qhapp/*/*.log
  tail_files: true
  multiline.pattern: '^[[:space:]]+|^Caused by:|^.+Exception:|^\d+\serror'
  multiline.negate: false
  multiline.match: after
  fields:
    app_id: bi_lass
    service: "{{ hostvars[inventory_hostname]['service'] }}"
    ip_address: "{{ hostvars[inventory_hostname]['ansible_host'] }}"
    topic: qh_app_raw_log

filebeat.config.modules:
  path: ${path.config}/modules.d/*.yml
  reload.enabled: false

setup.template.settings:
  index.number_of_shards: 3
  #index.codec: best_compression
  #_source.enabled: false
output.kafka:
  enabled: true
  hosts: [{{kafka_url}}]

  topic: '%{[fields][topic]}'

max_procs: 1
Note that in the above configuration, only the number of cpu cores is limited, and there is no special limit on the utilization of memory. From the perspective of configuration, there are two main indicators affecting filebeat memory usage:
- queue. mem. The default value of events message queue is 4096. In versions before 6.0, this parameter is spool size, which can be configured at startup through the command line
- max_message_bytes is the size of a single message. The default value is 10M
The maximum possible memory occupied by filebeat is max_message_bytes * queue.mem.events = 40G. Considering that this queue is used to store encode d data and raw data, the maximum memory occupation can reach more than 80G without memory restriction.
Therefore, it is recommended to limit the CPU and memory of filebeat at the same time.
Next, let's see under what conditions a memory leak can be observed with the above configuration
Too many monitoring files
For files that produce a large amount of content in real time, such as logs, the common practice is to rotate the log files. According to different strategies, rotate the logs every once in a while or after reaching a fixed size.
In this way, a large number of log files may be generated in the file directory.
If we use wildcards to monitor the directory, filebeat will start a large number of harvester instances to collect files. However, please remember, I'm not saying that there will be a memory leak, but a memory leak has been observed here, not that it is the cause of the memory leak.
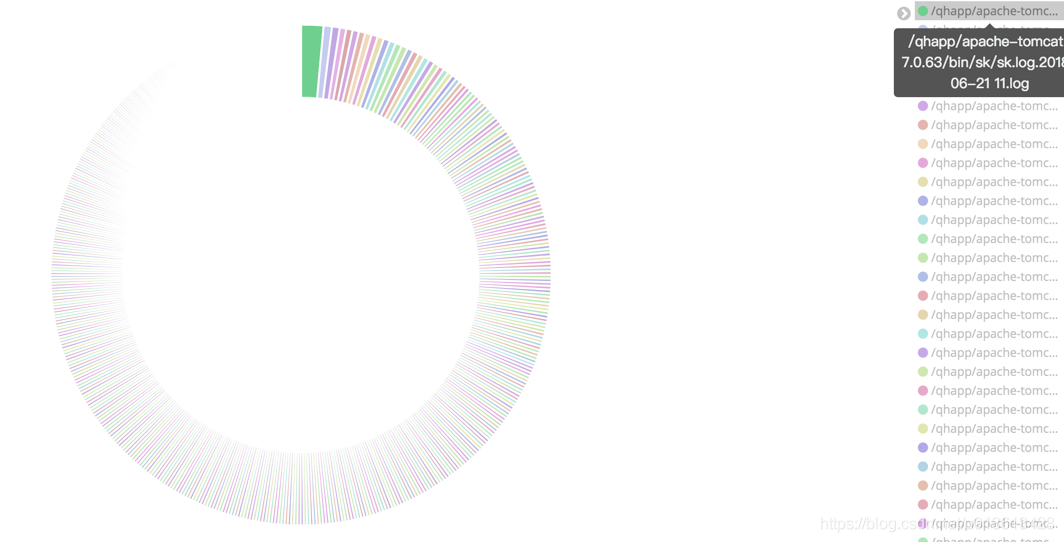
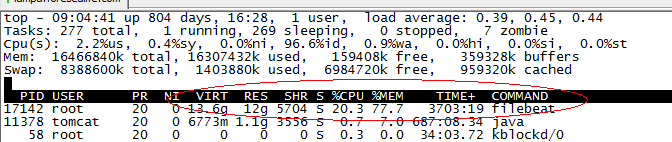
When filebeat runs for several months, it takes up more than 10 G of memory
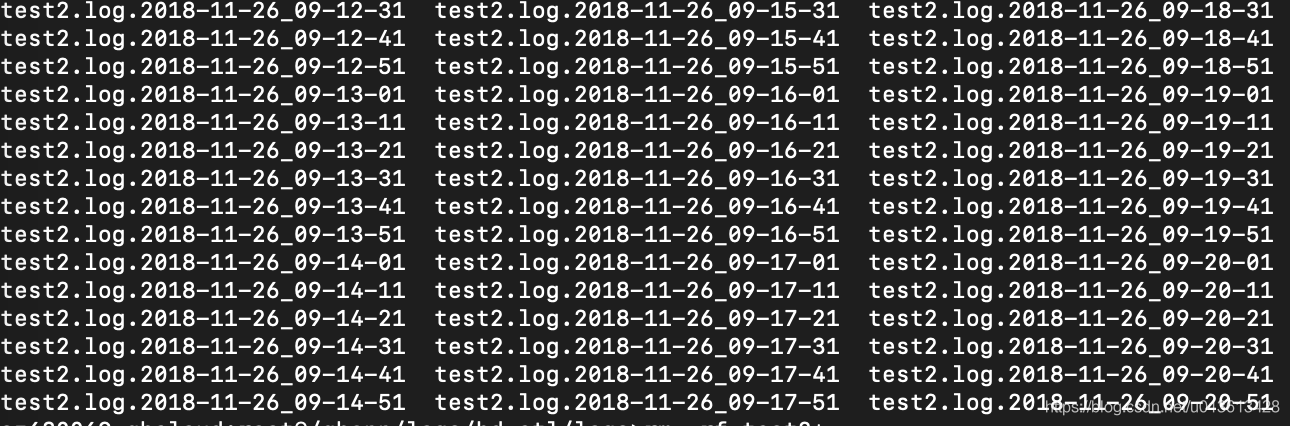
Very frequent rotate logs
Another possibility is that filebeat is configured to monitor only one file, such as test2 Log, but due to test2 Log constantly rotate s out new files. Although wildcards are not used to collect all files in the directory, because the linux system uses inode number to uniquely identify files, the new files generated by rotation do not change their inode number. Therefore, filebeat also enables the monitoring of multiple files at the same time.
Because multiline takes up too much memory
multiline.pattern: '^[[:space:]]+|^Caused by:|^.+Exception:|^\d+\serror, such as this configuration, thinks that the line beginning with a space or tab is the additional content of the previous line and needs to be stored in the same event as a multi line mode. When the file you monitor happens to have a space in each line of the file, it will incorrectly match multiple lines, resulting in the number of lines of a single event reaching thousands of lines and the size reaching 10M after filebeat parsing. In this process, regular expressions are used, and the processing of each event will consume a lot of memory. Because most filebeat output s need to be answered, buffer events will inevitably consume a lot of memory.
Simulation scene
I won't say much here. Let's simply take a piece of python code:
[loggers]
keys=root

[handlers]
keys=NormalHandler

[formatters]
keys=formatter

[logger_root]
level=DEBUG
handlers=NormalHandler

[handler_NormalHandler]
class=logging.handlers.TimedRotatingFileHandler
formatter=formatter
args=('./test2.log', 'S', 10, 200)

[formatter_formatter]
format=%(asctime)s %(filename)s[line:%(lineno)d] %(levelname)s %(message)s
Above, rotate a file every 10 seconds ('s','m '= minutes,'D' = days), and a total of 200 files can be rotated.
Then, find a random log and keep playing. The following is 330 entries / second
import logging
from logging.config import fileConfig
import os
import time
CURRENT_FOLDER = os.path.dirname(os.path.realpath(__file__))

fileConfig(CURRENT_FOLDER + '/logging.ini')
logger = logging.getLogger()

while True:
    logger.debug("DEBUG 2018-11-26 09:31:35 com.sunyard.insurance.server.GetImage 43 - Resource request:date=20181126&file_name=/imagedata/imv2/pool1/images/GXTB/2017/11/14/57/06b6bcdd31763b70b20f56c689e51f5e_1/06b6bcdd31763b70b20f56c689e51f5e_2.syd&file_encrypt=0&token=HUtGGG20GH4GAqq209R9tc9UGtAURR0b DEBUG 2018-11-26 09:31:40 com.sunyard.insurance.scheduler.job.DbEroorHandleJob 26 - [Database operation exception handling JOB]Handle the exception file, the machine does not run, exit the task!")
    logger.debug("DEBUG 2018-11-26 09:31:35 com.sunyard.insurance.server.GetImage 43 - Resource request:date=20181126&file_name=/imagedata/imv2/pool1/images/GXTB/2017/11/14/57/06b6bcdd31763b70b20f56c689e51f5e_1/06b6bcdd31763b70b20f56c689e51f5e_2.syd&file_encrypt=0&token=HUtGGG20GH4GAqq209R9tc9UGtAURR0b DEBUG 2018-11-26 09:31:40 com.sunyard.insurance.scheduler.job.DbEroorHandleJob 26 - [Database operation exception handling JOB]Handle the exception file, the machine does not run, exit the task!")
    logger.debug("DEBUG 2018-11-26 09:31:35 com.sunyard.insurance.server.GetImage 43 - Resource request:date=20181126&file_name=/imagedata/imv2/pool1/images/GXTB/2017/11/14/57/06b6bcdd31763b70b20f56c689e51f5e_1/06b6bcdd31763b70b20f56c689e51f5e_2.syd&file_encrypt=0&token=HUtGGG20GH4GAqq209R9tc9UGtAURR0b DEBUG 2018-11-26 09:31:40 com.sunyard.insurance.scheduler.job.DbEroorHandleJob 26 - [Database operation exception handling JOB]Handle the exception file, the machine does not run, exit the task!")
    logger.debug("DEBUG 2018-11-26 09:31:35 com.sunyard.insurance.server.GetImage 43 - Resource request:date=20181126&file_name=/imagedata/imv2/pool1/images/GXTB/2017/11/14/57/06b6bcdd31763b70b20f56c689e51f5e_1/06b6bcdd31763b70b20f56c689e51f5e_2.syd&file_encrypt=0&token=HUtGGG20GH4GAqq209R9tc9UGtAURR0b DEBUG 2018-11-26 09:31:40 com.sunyard.insurance.scheduler.job.DbEroorHandleJob 26 - [Database operation exception handling JOB]Handle the exception file, the machine does not run, exit the task!")
    logger.debug("DEBUG 2018-11-26 09:31:35 com.sunyard.insurance.server.GetImage 43 - Resource request:date=20181126&file_name=/imagedata/imv2/pool1/images/GXTB/2017/11/14/57/06b6bcdd31763b70b20f56c689e51f5e_1/06b6bcdd31763b70b20f56c689e51f5e_2.syd&file_encrypt=0&token=HUtGGG20GH4GAqq209R9tc9UGtAURR0b DEBUG 2018-11-26 09:31:40 com.sunyard.insurance.scheduler.job.DbEroorHandleJob 26 - [Database operation exception handling JOB]Handle the exception file, the machine does not run, exit the task!")
    logger.debug("DEBUG 2018-11-26 09:31:35 com.sunyard.insurance.server.GetImage 43 - Resource request:date=20181126&file_name=/imagedata/imv2/pool1/images/GXTB/2017/11/14/57/06b6bcdd31763b70b20f56c689e51f5e_1/06b6bcdd31763b70b20f56c689e51f5e_2.syd&file_encrypt=0&token=HUtGGG20GH4GAqq209R9tc9UGtAURR0b DEBUG 2018-11-26 09:31:40 com.sunyard.insurance.scheduler.job.DbEroorHandleJob 26 - [Database operation exception handling JOB]Handle the exception file, the machine does not run, exit the task!")
    logger.debug("DEBUG 2018-11-26 09:31:35 com.sunyard.insurance.server.GetImage 43 - Resource request:date=20181126&file_name=/imagedata/imv2/pool1/images/GXTB/2017/11/14/57/06b6bcdd31763b70b20f56c689e51f5e_1/06b6bcdd31763b70b20f56c689e51f5e_2.syd&file_encrypt=0&token=HUtGGG20GH4GAqq209R9tc9UGtAURR0b DEBUG 2018-11-26 09:31:40 com.sunyard.insurance.scheduler.job.DbEroorHandleJob 26 - [Database operation exception handling JOB]Handle the exception file, the machine does not run, exit the task!")
    logger.debug("DEBUG 2018-11-26 09:31:35 com.sunyard.insurance.server.GetImage 43 - Resource request:date=20181126&file_name=/imagedata/imv2/pool1/images/GXTB/2017/11/14/57/06b6bcdd31763b70b20f56c689e51f5e_1/06b6bcdd31763b70b20f56c689e51f5e_2.syd&file_encrypt=0&token=HUtGGG20GH4GAqq209R9tc9UGtAURR0b DEBUG 2018-11-26 09:31:40 com.sunyard.insurance.scheduler.job.DbEroorHandleJob 26 - [Database operation exception handling JOB]Handle the exception file, the machine does not run, exit the task!")
    logger.debug("DEBUG 2018-11-26 09:31:35 com.sunyard.insurance.server.GetImage 43 - Resource request:date=20181126&file_name=/imagedata/imv2/pool1/images/GXTB/2017/11/14/57/06b6bcdd31763b70b20f56c689e51f5e_1/06b6bcdd31763b70b20f56c689e51f5e_2.syd&file_encrypt=0&token=HUtGGG20GH4GAqq209R9tc9UGtAURR0b DEBUG 2018-11-26 09:31:40 com.sunyard.insurance.scheduler.job.DbEroorHandleJob 26 - [Database operation exception handling JOB]Handle the exception file, the machine does not run, exit the task!")
    logger.debug("DEBUG 2018-11-26 09:31:35 com.sunyard.insurance.server.GetImage 43 - Resource request:date=20181126&file_name=/imagedata/imv2/pool1/images/GXTB/2017/11/14/57/06b6bcdd31763b70b20f56c689e51f5e_1/06b6bcdd31763b70b20f56c689e51f5e_2.syd&file_encrypt=0&token=HUtGGG20GH4GAqq209R9tc9UGtAURR0b DEBUG 2018-11-26 09:31:40 com.sunyard.insurance.scheduler.job.DbEroorHandleJob 26 - [Database operation exception handling JOB]Handle the exception file, the machine does not run, exit the task!!@#!@#!@#!@#!@#!@#!@#!@#!@#!@#!@#!#@!!!@##########################################################################################################################################################")
    time.sleep(0.03)
How to observe the memory of filebeat
Before version 6.5, we could not observe the performance of beats suite through the monitoring function of xpack. Therefore, here we discuss how to detect the performance of filebeat without monitoring. Of course, the simple way is to view through the commands of top,ps and other operating systems, but these are real-time, unable to observe the trend, and are all process level, unable to see the real situation inside filebeat. Therefore, here is how to observe the memory usage through the log of filebeat and pprof
Log via filebeat
filebeat file interpretation
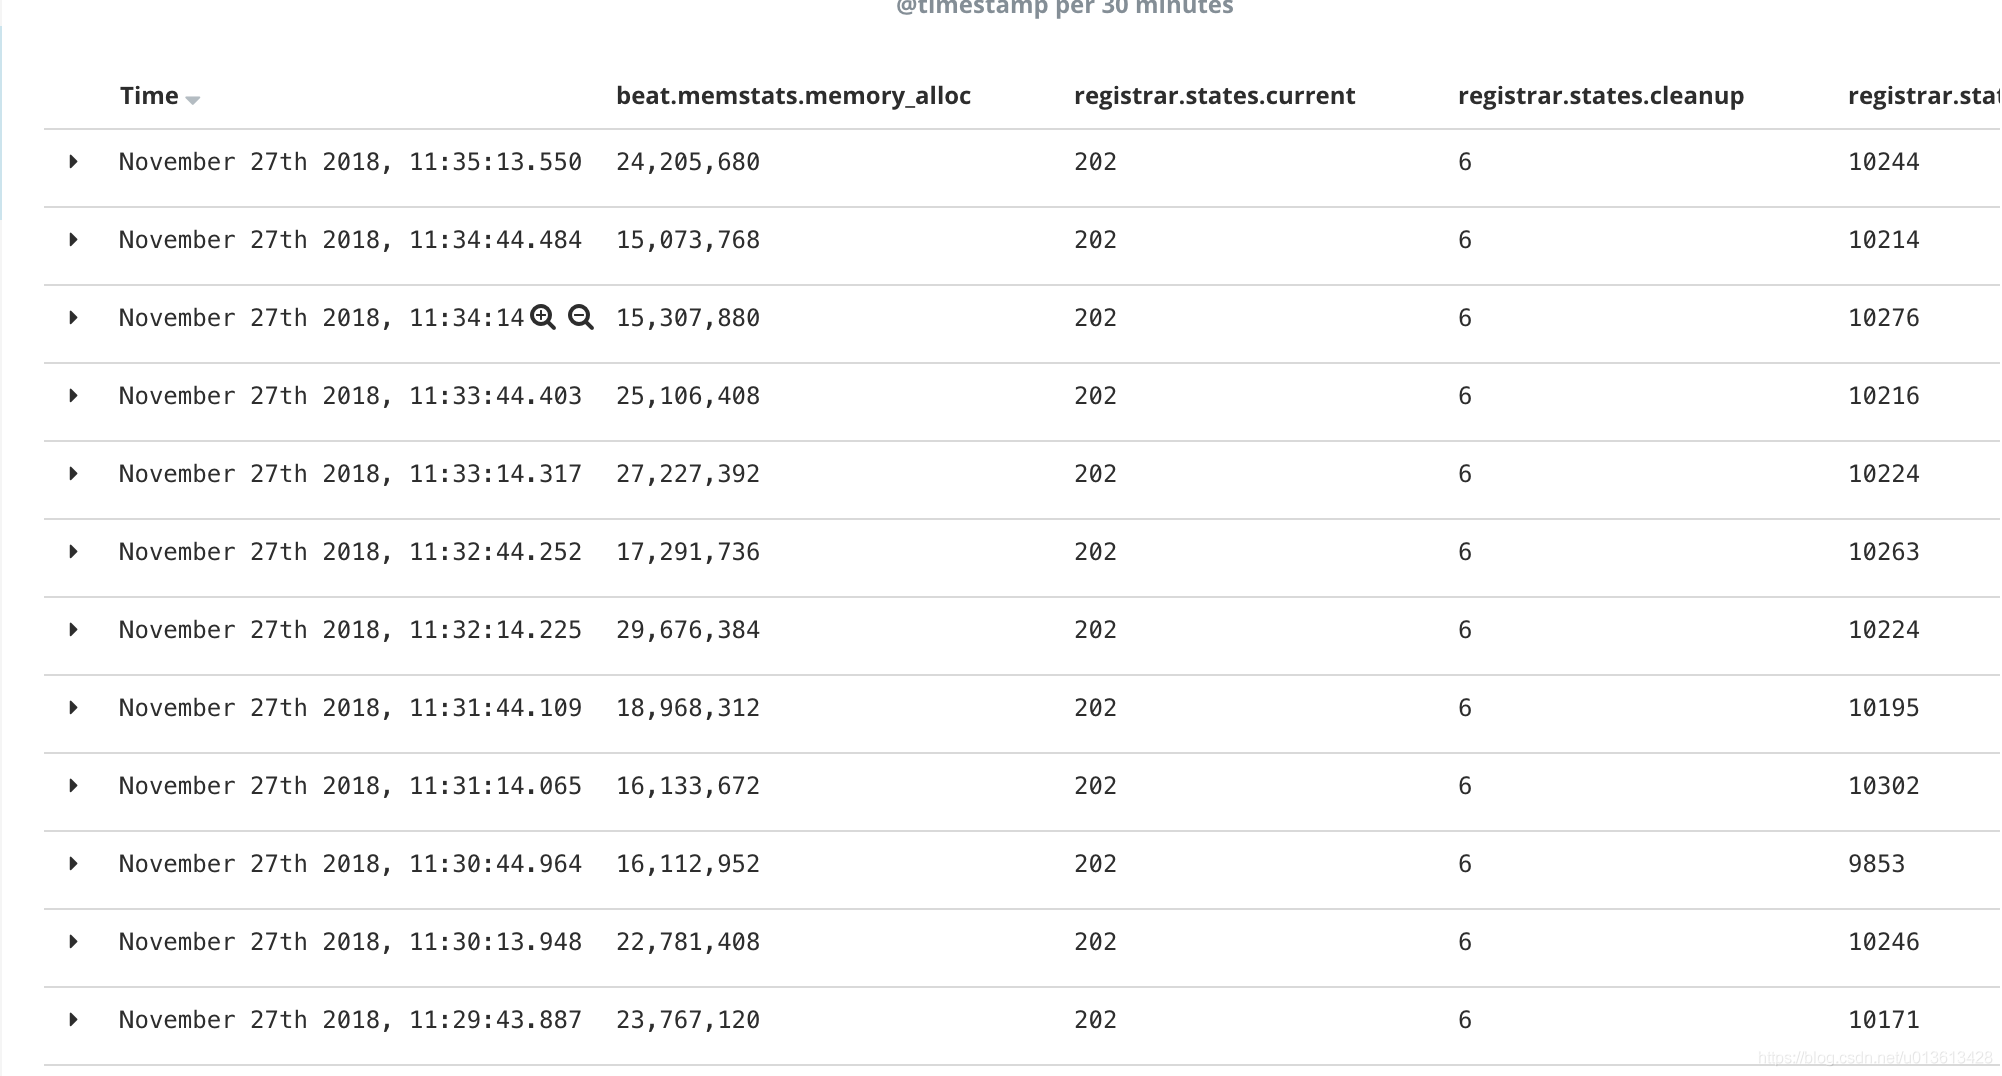
In fact, the log of filebeat already contains many parameters to observe the resource usage of filebeat in real time. The following is a log fragment of filebeat (the log fragment here is version 6.0. After version 6.5, the whole log format has changed from kv format to json object format. xpack can directly monitor filebeat through the log):
2018-11-02T17:40:01+08:00 INFO Non-zero metrics in the last 30s: beat.memstats.gc_next=623475680 beat.memstats.memory_alloc=391032232 beat.memstats.memory_total=155885103371024 filebeat.events.active=-402 filebeat.events.added=13279 filebeat.events.done=13681 filebeat.harvester.closed=1 filebeat.harvester.open_files=7 filebeat.harvester.running=7 filebeat.harvester.started=2 libbeat.config.module.running=0 libbeat.output.events.acked=13677 libbeat.output.events.batches=28 libbeat.output.events.total=13677 libbeat.outputs.kafka.bytes_read=12112 libbeat.outputs.kafka.bytes_write=1043381 libbeat.pipeline.clients=1 libbeat.pipeline.events.active=0 libbeat.pipeline.events.filtered=4 libbeat.pipeline.events.published=13275 libbeat.pipeline.events.total=13279 libbeat.pipeline.queue.acked=13677 registrar.states.cleanup=1 registrar.states.current=8 registrar.states.update=13681 registrar.writes=28
The parameters are mainly divided into three parts:
- beat.*, Contains memstats gc_ next,memstats.memory_alloc,memstats.memory_total, which is an indicator of all beat components, is inherited from filebeat and is mainly memory related. We pay special attention to memstats memory_ Alloc, the more alloc, the more memory it takes
- filebeat.*, This part is a unique indicator of filebeat. Through event related indicators, we know the throughput. Through harvester, we know how many files are being monitored. The more events are not consumed, the more havester s are created, and the more memory is consumed
- libbeat.*, It is also a general indicator of beats components, including outputs, pipeline and other information. Here, when the outputs are blocked, it will directly affect the consumption of event s in the queue and cause memory accumulation
- registrar and filebeat put the status of monitoring files in the registry file. When there are a lot of monitoring files, such as 100000, and there is no reasonable setting of close_inactive parameter, this file can reach 100M. After loading into memory, it will directly occupy memory
filebeat log parsing
Of course, we can't read this log directly. Since we use ELK, we must interpret it with ELK. Because it is in kv format, it is convenient to use the kv plugin of logstash:
filter {
  kv {}
}
kv cannot specify the type of properties, so we need to specify the index template slightly:
PUT _template/template_1
{
  "index_patterns": ["filebeat*"],
  "settings": {
    "number_of_shards": 1
  },
  "mappings": {
    "doc": {
      "_source": {
        "enabled": false
      },
      "dynamic_templates": [
        {
          "longs_as_strings": {
            "match_mapping_type": "string",
            "path_match":   "*beat.*",
            "path_unmatch": "*.*name",
            "mapping": {
              "type": "long"
            }
          }
        }
      ]
    }
  }
}
In the above template, the properties parsed by kv are mapped to long type, but note that "path_match": "* beat. *" cannot match the index of registrar. Readers can write a more perfect mapping by themselves.
In this way, we can clearly see the process of memory leakage through kibana visual components
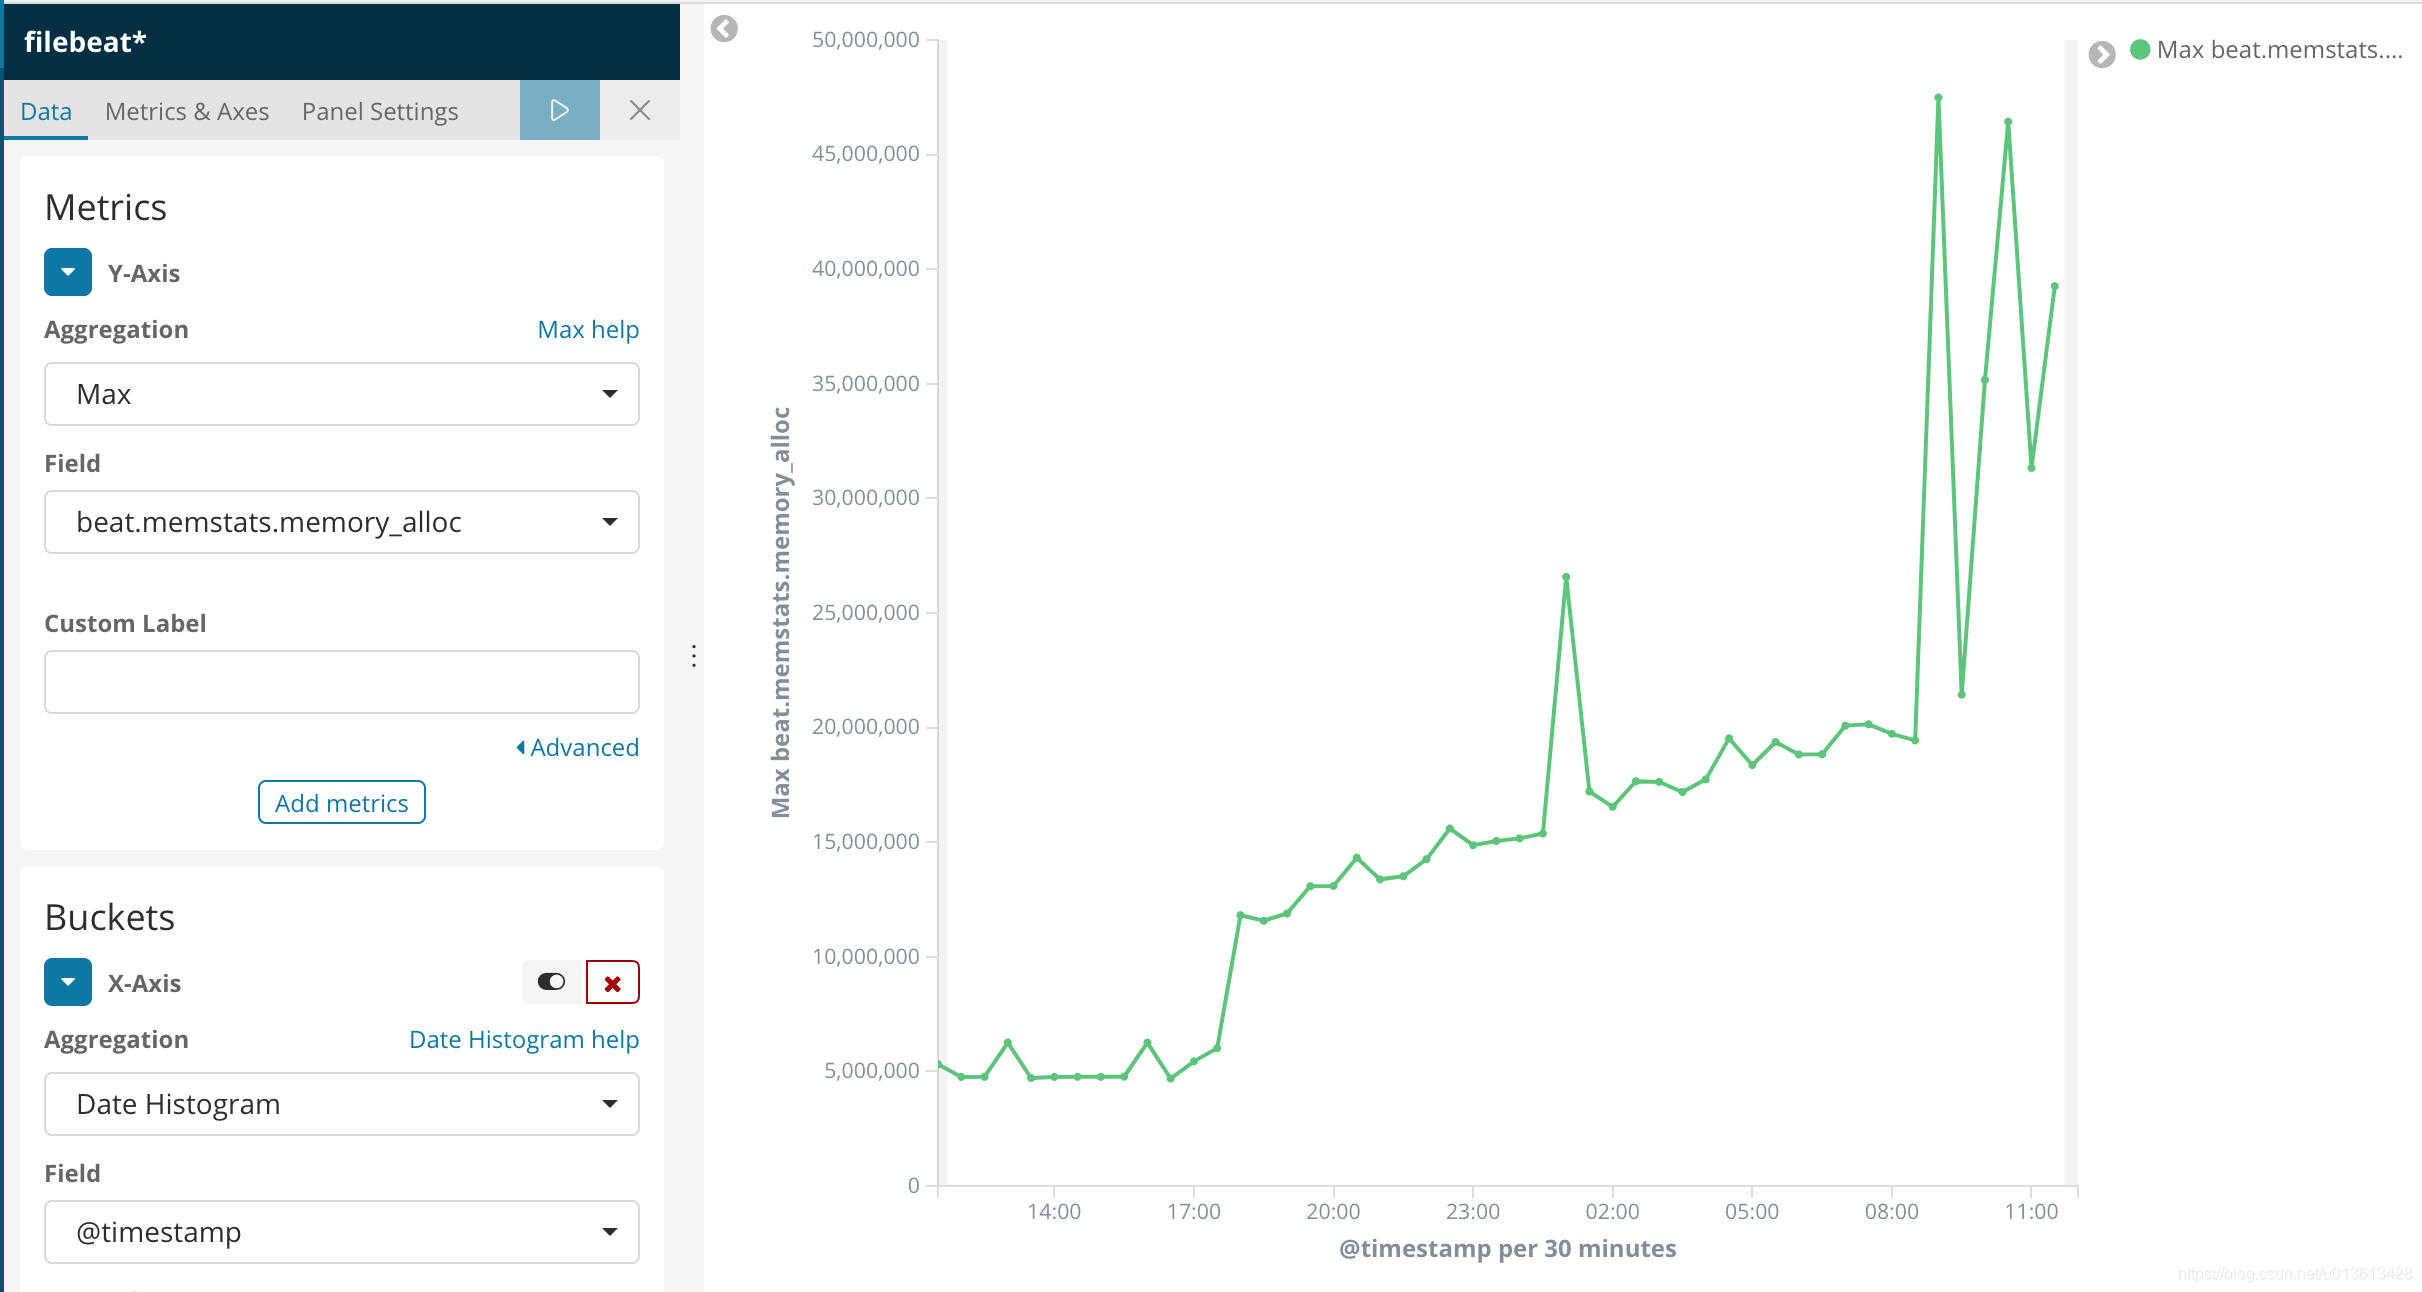
And the use of resources:
After visualizing the information, we can clearly find that the memory mutation and ERR occur at the same time
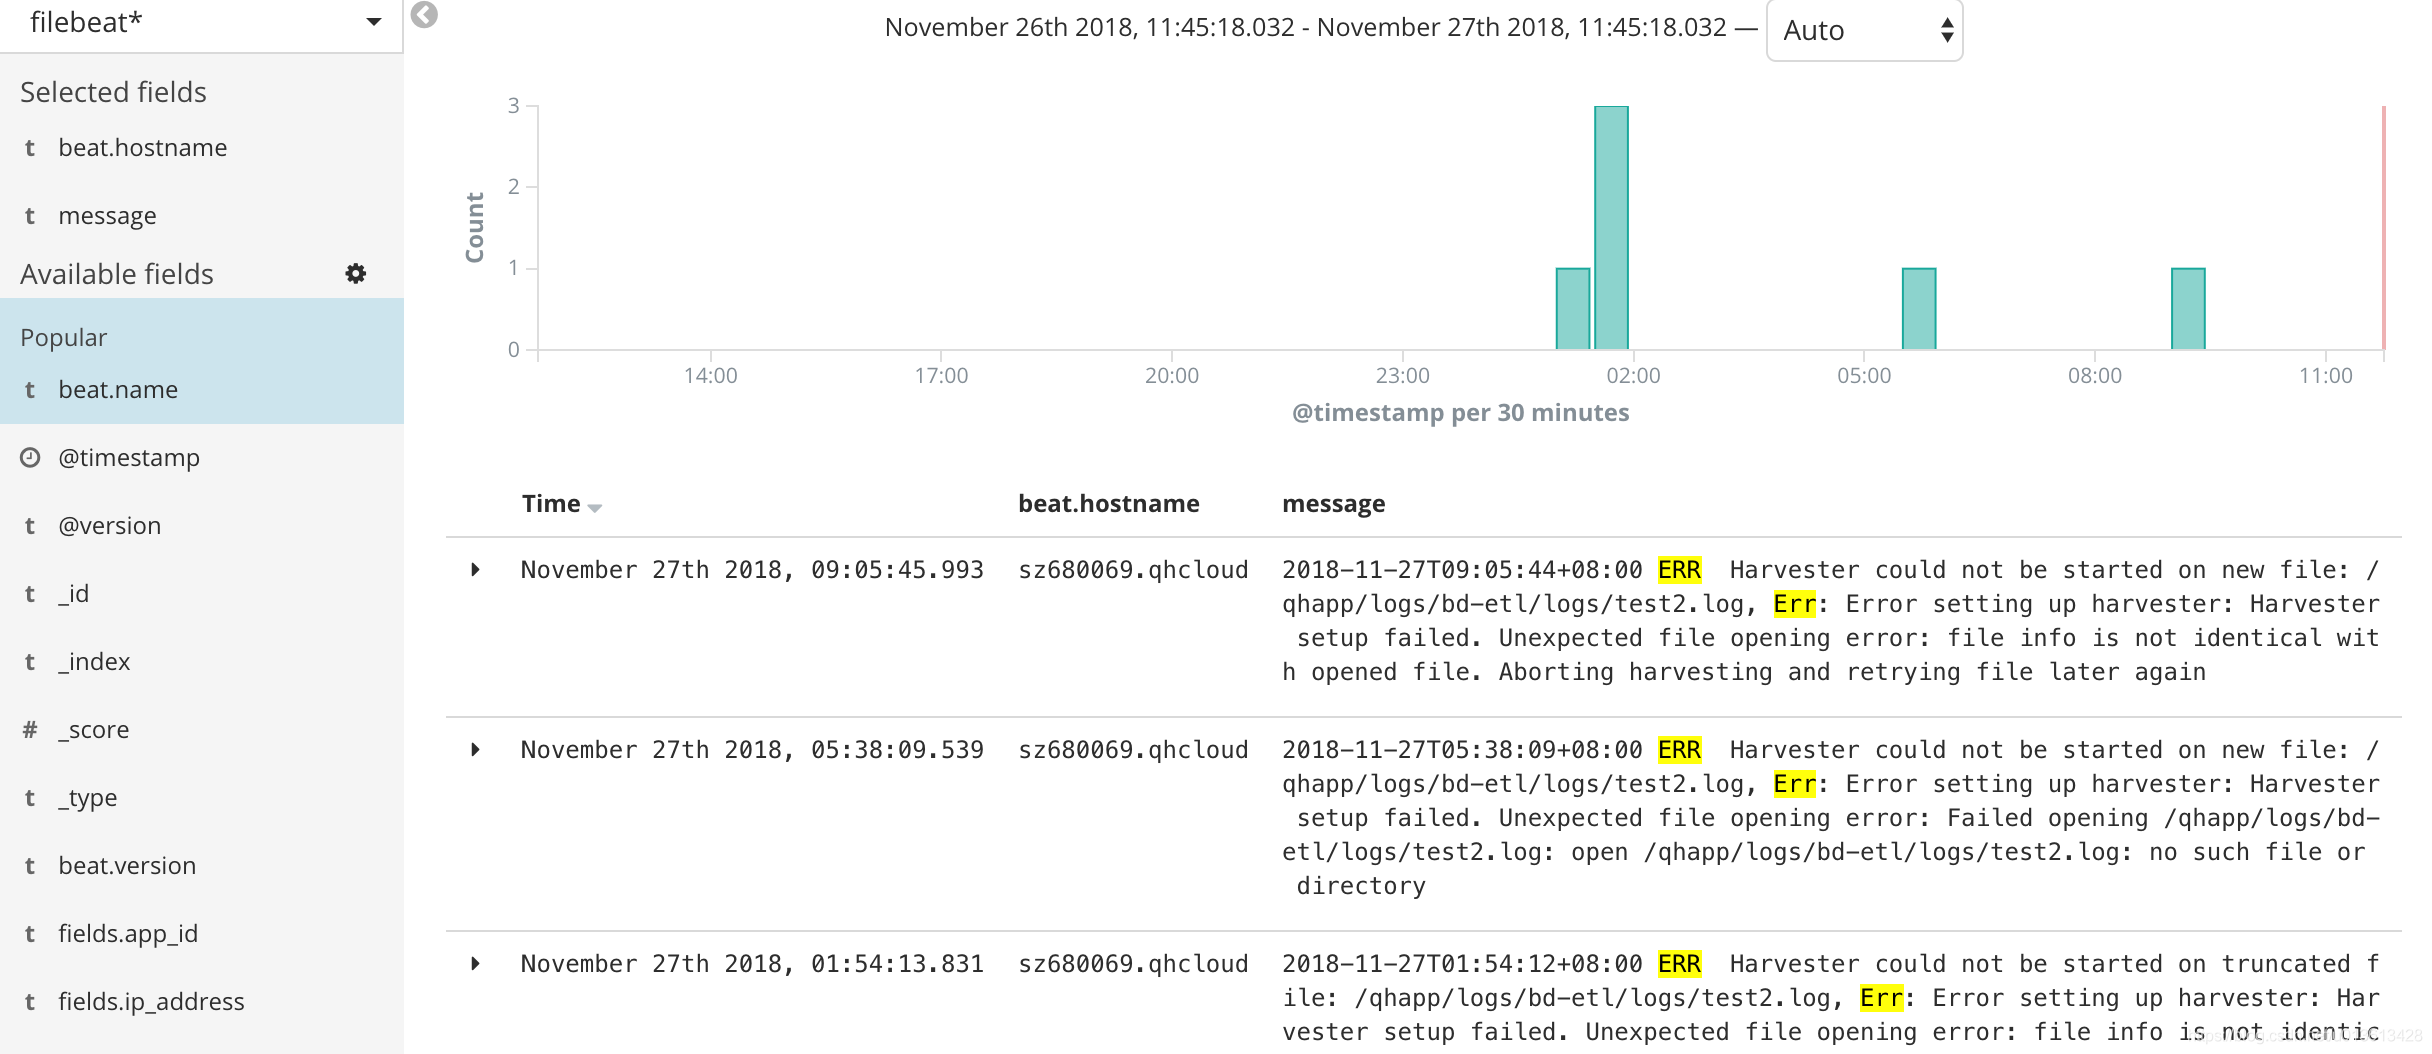
The following error:
2018-11-27T09:05:44+08:00 ERR Harvester could not be started on new file: /qhapp/logs/bd-etl/logs/test2.log, Err: Error setting up harvester: Harvester setup failed. Unexpected file opening error: file info is not identical with opened file. Aborting harvesting and retrying file later again
Will cause filebeat to suddenly request additional memory. Please check for details issue
Through pprof
As we all know, filebeat is implemented in go language, and the basic library of go language itself contains pprof, an extremely powerful performance analysis tool, but this tool is used for debug ging. In normal mode, filebeat will not start this talent selection, and unfortunately, it is not mentioned in the official document that we can use pprof to observe filebeat. Next, we can fix a memory leak on 6.3 issue , to learn how to use pprof for analysis
Start pprof monitoring
First, you need to let filebeat run pprof at startup. The specific method is to add the parameter - httpprof localhost: 6060, that is, / usr / share / filebeat / bin / filebeat - C / etc / filebeat / filebeat yml -path. home /usr/share/filebeat -path. config /etc/filebeat -path. data /var/lib/filebeat -path. logs /var/log/filebeat -httpprof localhost:6060. Only localhost is bound here and cannot be accessed remotely. If you want to access remotely, you should use 0.0.0.0.
At this point, you can use curl http://localhost:6060/debug/pprof/heap > profile. Txt and other commands to obtain the real-time stack information of filebeat.
Remote connection
Of course, you can also install go on your local computer and connect pprof remotely through go tool.
Because we need to study the memory problem, the following connection accesses the / heap sub path
go tool pprof http://10.60.x.x:6060/debug/pprof/heap
top command
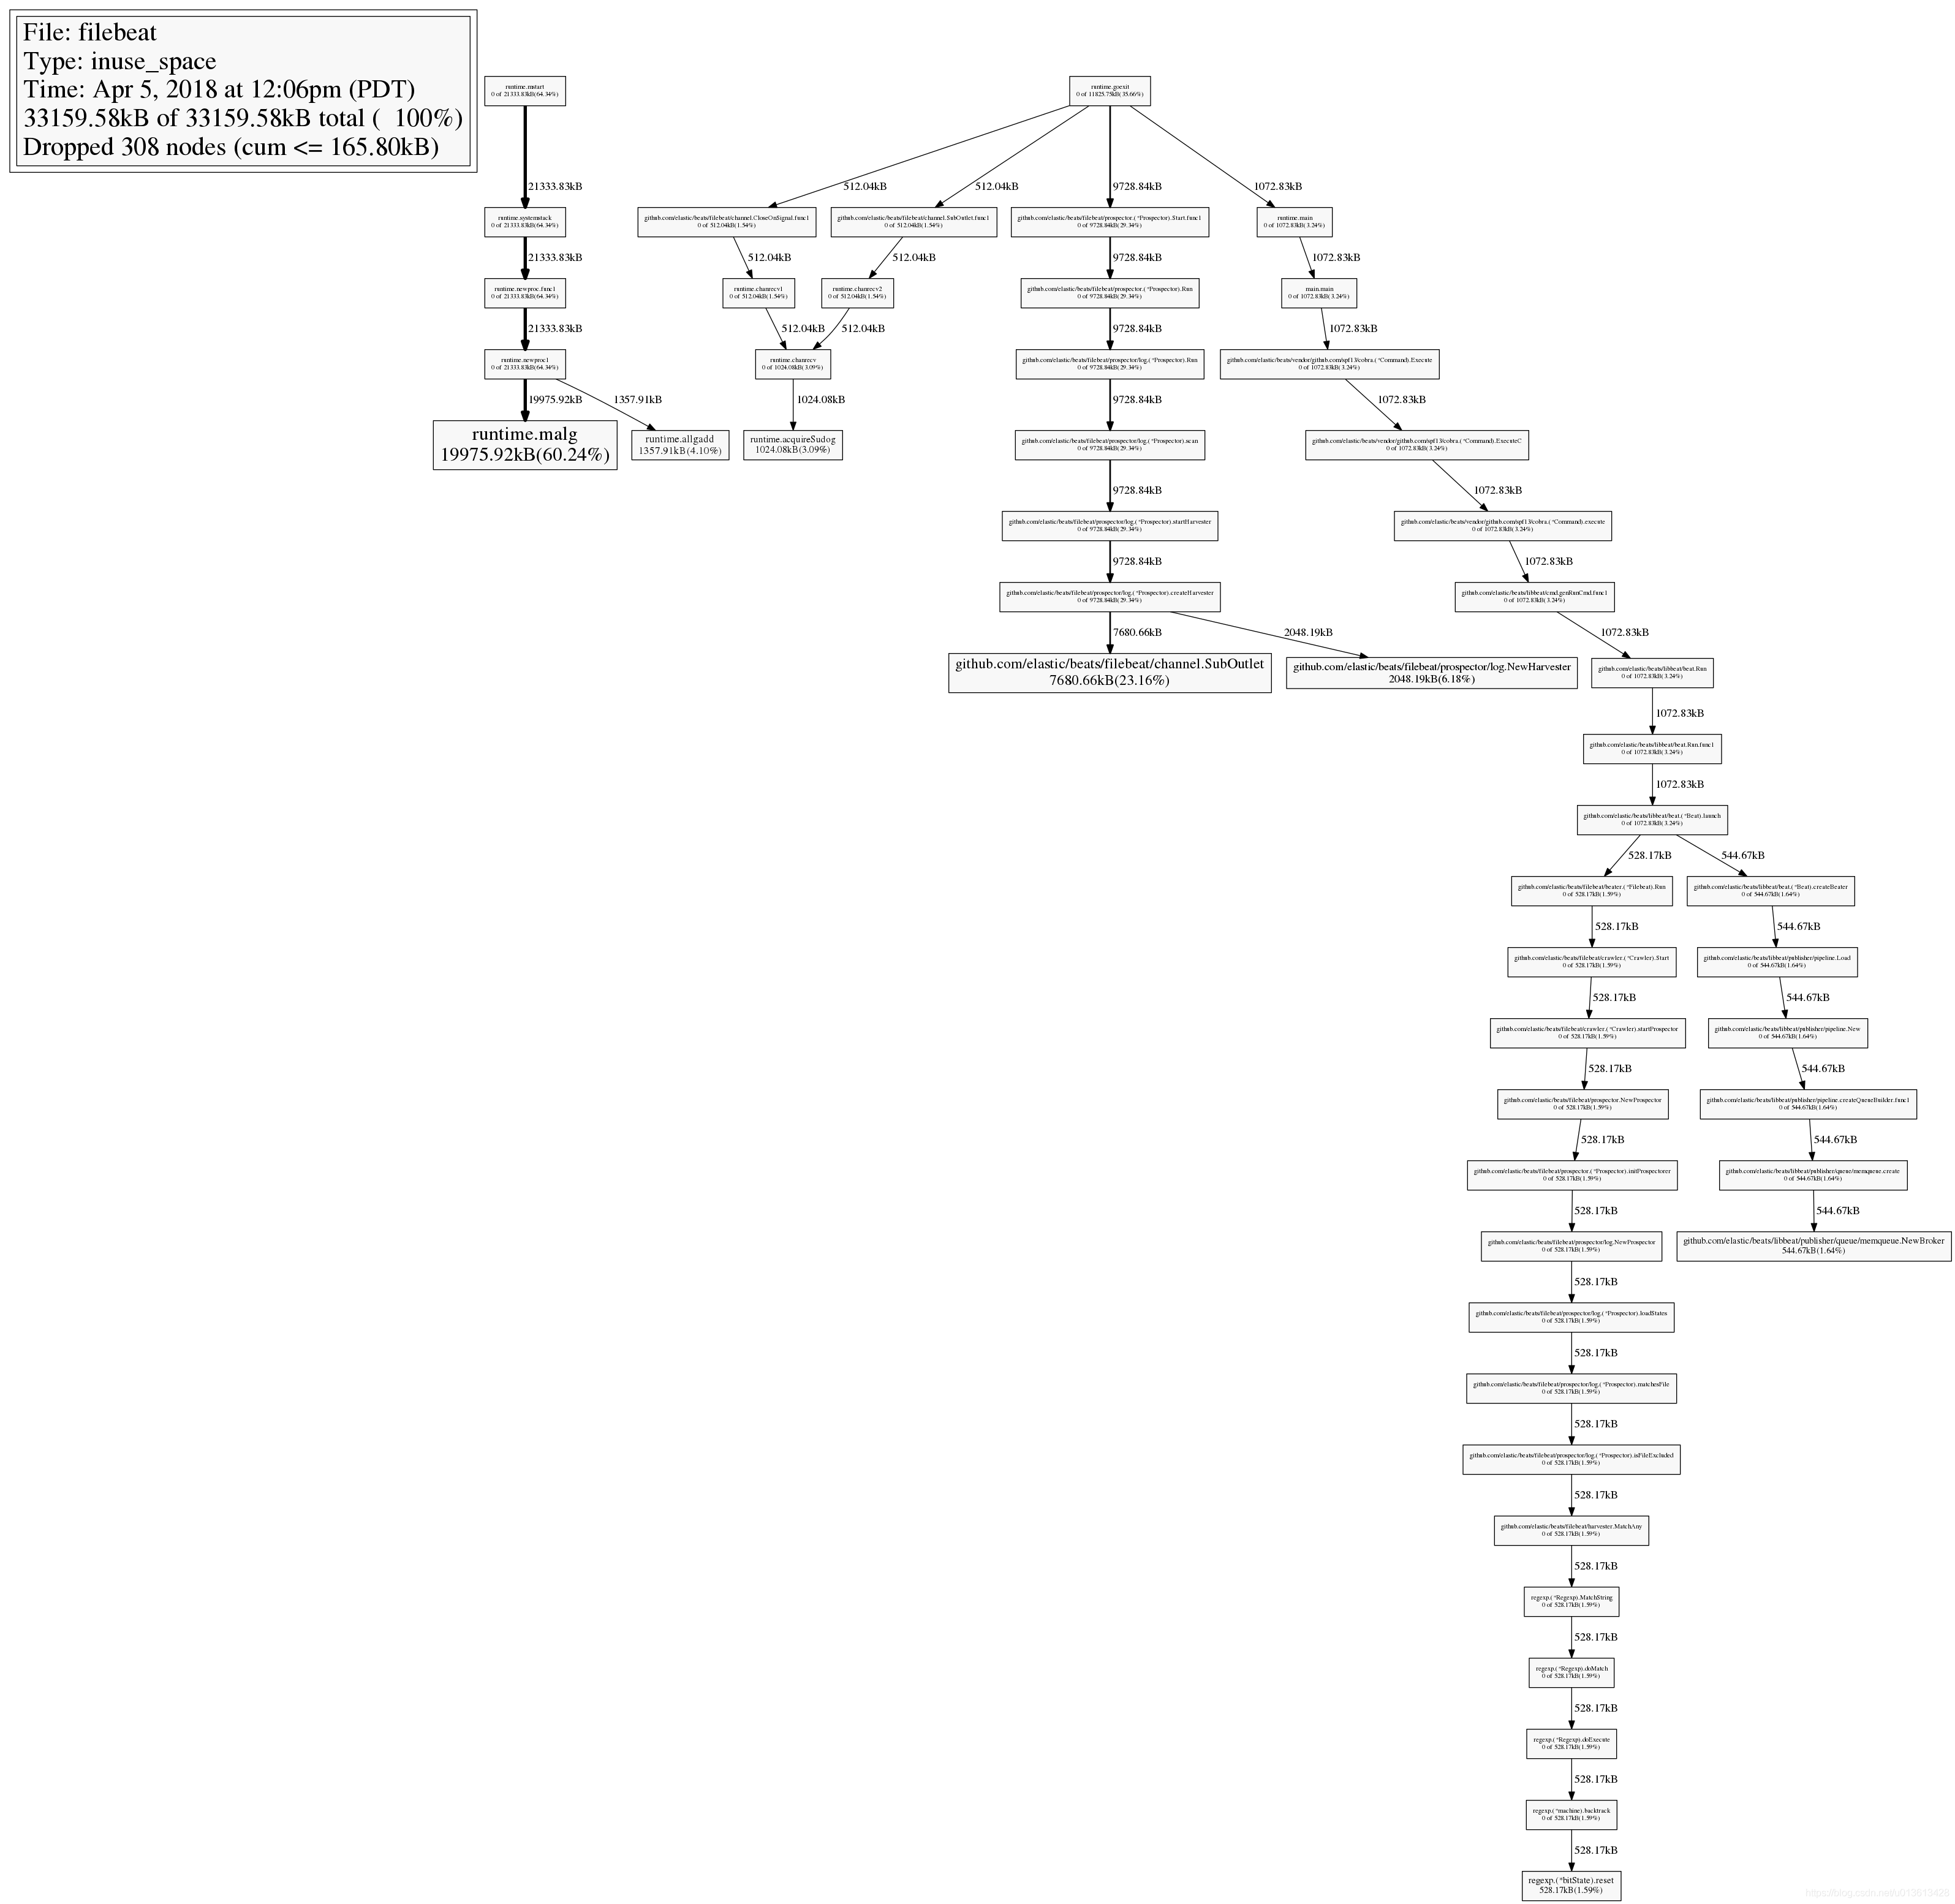
After connecting, you can use the top command to view the instances that consume the most memory:
33159.58kB of 33159.58kB total (  100%)
Dropped 308 nodes (cum <= 165.80kB)
Showing top 10 nodes out of 51 (cum >= 512.04kB)
      flat  flat%   sum%        cum   cum%
19975.92kB 60.24% 60.24% 19975.92kB 60.24%  runtime.malg
 7680.66kB 23.16% 83.40%  7680.66kB 23.16%  github.com/elastic/beats/filebeat/channel.SubOutlet
 2048.19kB  6.18% 89.58%  2048.19kB  6.18%  github.com/elastic/beats/filebeat/prospector/log.NewHarvester
 1357.91kB  4.10% 93.68%  1357.91kB  4.10%  runtime.allgadd
 1024.08kB  3.09% 96.76%  1024.08kB  3.09%  runtime.acquireSudog
  544.67kB  1.64% 98.41%   544.67kB  1.64%  github.com/elastic/beats/libbeat/publisher/queue/memqueue.NewBroker
  528.17kB  1.59%   100%   528.17kB  1.59%  regexp.(*bitState).reset
         0     0%   100%   528.17kB  1.59%  github.com/elastic/beats/filebeat/beater.(*Filebeat).Run
         0     0%   100%   512.04kB  1.54%  github.com/elastic/beats/filebeat/channel.CloseOnSignal.func1
         0     0%   100%   512.04kB  1.54%  github.com/elastic/beats/filebeat/channel.SubOutlet.func1
View stack call graph
Entering the web command will produce the svg diagram of stack call relationship. In this svg diagram, you can view it together with the top command. In top, we already know GitHub com/elastic/beats/filebeat/channel. Suboutlet takes up a lot of memory. In the figure, it shows the call relationship stack. You can see how this class is instantiated and how the memory is distributed in the whole heap. The most intuitive thing is that the larger the rectangular area of the instance, the more memory it occupies
View source code
Through the list command, you can quickly view the problem source code of the instance. For example, in the previous top10 command, we have seen GitHub com/elastic/beats/filebeat/channel. The instance of suboutlet class takes up a lot of memory. We can make further analysis through list to see which statement in this class begins to take up memory:
(pprof) list SubOutlet
Total: 32.38MB
ROUTINE ======================== github.com/elastic/beats/filebeat/channel.SubOutlet in /home/jeremy/src/go/src/github.com/elastic/beats/filebeat/channel/util.go
    7.50MB     7.50MB (flat, cum) 23.16% of Total
         .          .     15:// SubOutlet create a sub-outlet, which can be closed individually, without closing the
         .          .     16:// underlying outlet.
         .          .     17:func SubOutlet(out Outleter) Outleter {
         .          .     18:	s := &subOutlet{
         .          .     19:		isOpen: atomic.MakeBool(true),
       1MB        1MB     20:		done:   make(chan struct{}),
       2MB        2MB     21:		ch:     make(chan *util.Data),
    4.50MB     4.50MB     22:		res:    make(chan bool, 1),
         .          .     23:	}
         .          .     24:
         .          .     25:	go func() {
         .          .     26:		for event := range s.ch {
         .          .     27:			s.res <- out.OnEvent(event)
How to tune
In fact, the process of tuning is the process of adjusting parameters. As mentioned earlier, the memory related parameter, max_message_bytes,queue.mem.events,queue.mem.flush.min_events, and the formula of memory occupied by the queue: max_message_bytes * queue.mem.events
output.kafka:
  enabled: true
#  max_message_bytes: 1000000
  hosts: ["10.60.x.x:9092"]
  topic: '%{[fields][topic]}'
max_procs: 1
#queue.mem.events: 256
#queue.mem.flush.min_events: 128
But in fact, filebeat may occupy too much memory in different environments for different reasons. At this time, you need to carefully confirm your context:
- Is it because of wildcards that a large number of files are monitored at the same time? In this case, wildcards should be avoided to monitor useless files.
- If the single line content of the file is huge, determine whether the file content needs to be modified or filtered
- Whether too many multiline patterns are matched, and whether the single volume of multiline event s is too large. At this time, you need to temporarily close multiline and modify the file content or multiline pattern.
- Whether the output is often blocked, and the event queue always caches the event. At this time, check whether your network environment or message queue middleware are normal