catalogue
3. Basic characteristics of complete log system
2, ELK Elasticsearch cluster deployment
Operate on Node1 and Node2 nodes
Configure the elasticsearch environment (node1, node2)
Install elasticsearch head plug-in
Install elasticsearch head data visualization tool
ELK Logstash deployment (operating on Apache nodes)
Docking apache log files (access, error)
1, ELK overview
1.ELK introduction
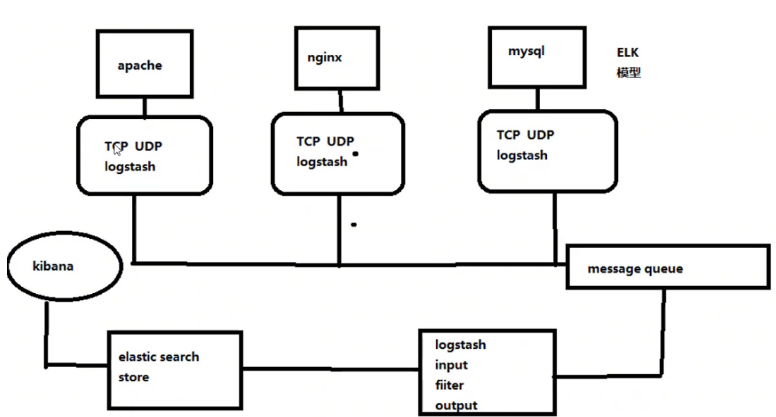
ELK platform is a complete set of centralized log processing solution, which combines ElasticSearch, Logstash and Kiabana to meet more powerful user requirements for log query, sorting and statistics
● ElasticSearch
- It is a distributed storage retrieval engine based on Lucene (a full-text retrieval engine architecture), which is used to store all kinds of logs.
- Elasticsearch is developed in Java and allows users to communicate with elasticsearch through a browser through a RESTful Web interface.
- Elasticsearch is a distributed search and analysis engine. Its advantage is that it can store, search and analyze large amounts of data in near real time.
● Logstash
- As a data collection engine. It supports dynamic data collection from various data sources, filtering, analyzing, enriching and unifying the data, and then storing it to the location specified by the user, which is generally sent to Elasticsearch.
- Logstash is written in JRuby language and runs on the Java virtual machine (JVM). It is a powerful data processing tool that can realize data transmission, format processing and formatted output. Logstash has powerful plug-in functions and is commonly used for log processing.
● Kiabana
- It is a display tool developed based on Node.js. It can provide graphical log analysis Web interface display for Logstash and ElasticSearch, and summarize, analyze and search important data logs.
● Filebeat
- Lightweight open source log file data collector. Usually, install filebeat on the client that needs to collect data and specify the directory and log format. Filebeat can quickly collect data and send it to logstash for parsing, or directly send it to Elasticsearch for storage. In terms of performance, it has obvious advantages over logstash running on JVM and is a substitute for it.
2. Why use ELK
- Logs mainly include system logs, application logs and security logs. System operation and maintenance personnel and developers can understand the software and hardware information of the server through the log, check the errors in the configuration process and the causes of the errors. Regular analysis of logs can understand the load, performance and security of the server, so as to take timely measures to correct errors.
- Often, the logs of a single machine can be basically analyzed by using grep, awk and other tools, but when the logs are scattered and stored on different devices. If you manage dozens or hundreds of servers, you are still using the traditional method of logging in to each machine in turn. Does this feel cumbersome and inefficient. It is imperative that we use centralized log management, such as the open source syslog, to collect and summarize the logs on all servers. After centralized log management, log statistics and retrieval become a more troublesome thing. Generally, we can use grep, awk, wc and other Linux commands to achieve retrieval and statistics, but we still have a little difficulty in using this method for higher requirements such as query, sorting and statistics and a large number of machines.
- Generally, a large-scale system is a distributed deployment architecture. Different service modules are deployed on different servers. When a problem occurs, it is necessary to locate the specific server and service module according to the key information exposed by the problem, and build a centralized log system, which can improve the efficiency of locating the problem.
3. Basic characteristics of complete log system
- Collection: it can collect log data from multiple sources
- Transmission: it can analyze, filter and transmit the log data to the storage system stably
- Storage: store log data
- Analysis: supports UI analysis
- Warning: it can provide error reporting and monitoring mechanism
4. Working principle of Elk
① Deploy Logstash on all servers that need to collect logs; Or you can centralize the log management on the log server and deploy Logstash on the log server
② Logstash collects logs, formats them and outputs them to the Elasticsearch cluster
③ Elasticsearch indexes and stores formatted data
④ Kibana queries the data from the ES cluster, generates charts, and displays the front-end data
2, ELK Elasticsearch cluster deployment
Environment configuration
| host | operating system | IP address | Installation package / software / tools |
|---|---|---|---|
| node1 | CentOS7 | 192.168.184.10 | Elasticsearch |
| node2 | CentOS7 | 192.168.184.20 | Elasticsearch |
| apache | CentOS7 | 192.168.184.30 | httpd / Logstash |
| Real machine | Windows | 192.168.184.1 | - |
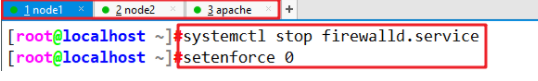
Operate on Node1 and Node2 nodes
systemctl stop firewalld
setenforce 0
1.Environmental preparation
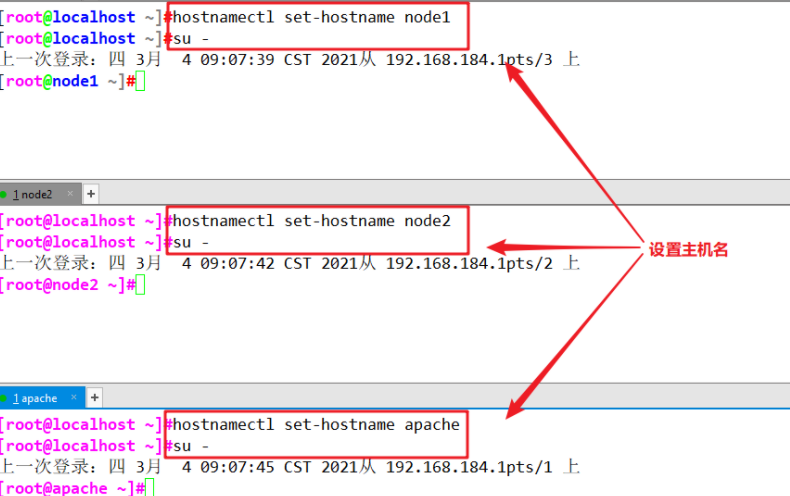
#Change the host name, configure domain name resolution, and view the Java environment
Node1 Node: hostnamectl set-hostname node1
Node2 Node: hostnamectl set-hostname node2
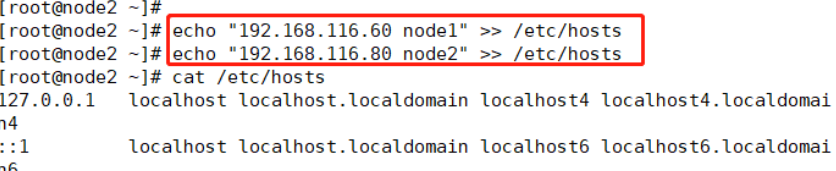
vim /etc/hosts
192.168.116.60 node1
192.168.116.80 node2
java -version #If not installed, yum -y install java
openjdk version "1.8.0_131"
OpenJDK Runtime Environment (build 1.8.0_131-b12)
OpenJDK 64-Bit Server VM (build 25.131-b12, mixed mode)
2.deploy Elasticsearch Software
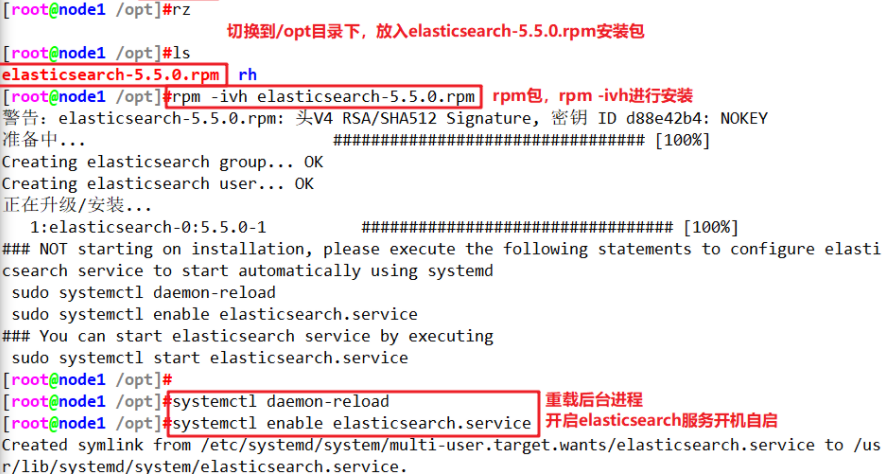
(1)install elasticsearch—rpm package
#Upload elasticsearch-5.5.0.rpm to the / opt directory
cd /opt
rpm -ivh elasticsearch-5.5.0.rpm
(2)Load system services
systemctl daemon-reload
systemctl enable elasticsearch.service
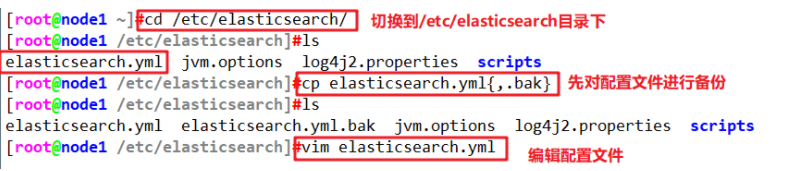
(3)modify elasticsearch Master profile
cp /etc/elasticsearch/elasticsearch.yml /etc/elasticsearch/elasticsearch.yml.bak
vim /etc/elasticsearch/elasticsearch.yml
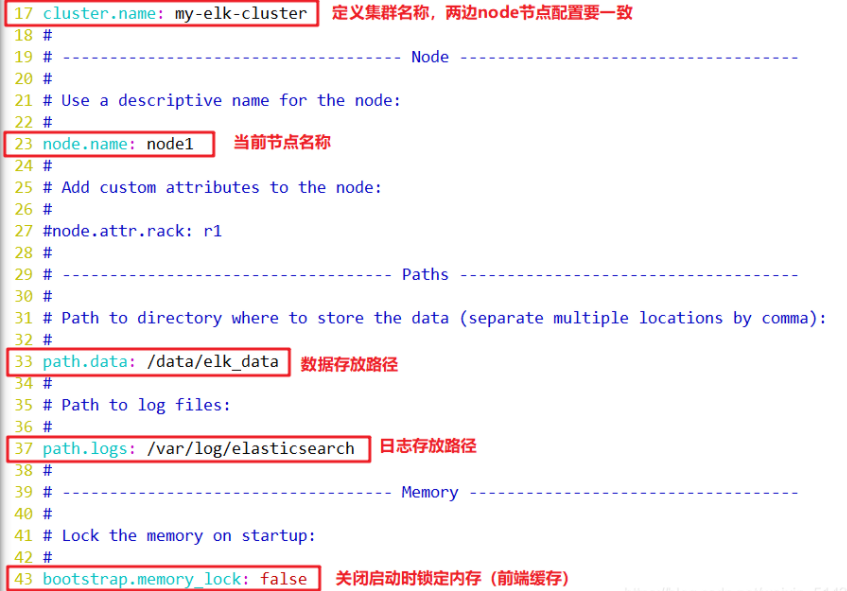
--17--Uncomment and specify the cluster name
cluster.name: my-elk-cluster
--23--Uncomment and specify the node name: Node1 Node is node1,Node2 Node is node2
node.name: node1
--33--Uncomment and specify the data storage path
path.data: /data/elk_data
--37--Uncomment and specify the log storage path
path.logs: /var/log/elasticsearch/
--43--Uncomment and change to not lock the memory at startup
bootstrap.memory_lock: false
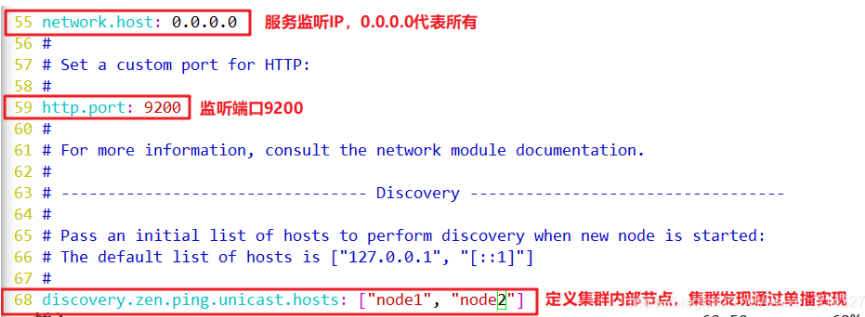
--55--Uncomment, set listening address, 0.0.0.0 Represents all addresses
network.host: 0.0.0.0
--59--Uncomment, ES The default listening port of the service is 9200
http.port: 9200
--68--Uncomment. Cluster discovery is implemented through unicast. Specify the nodes to be discovered node1,node2
discovery.zen.ping.unicast.hosts: ["node1", "node2"]
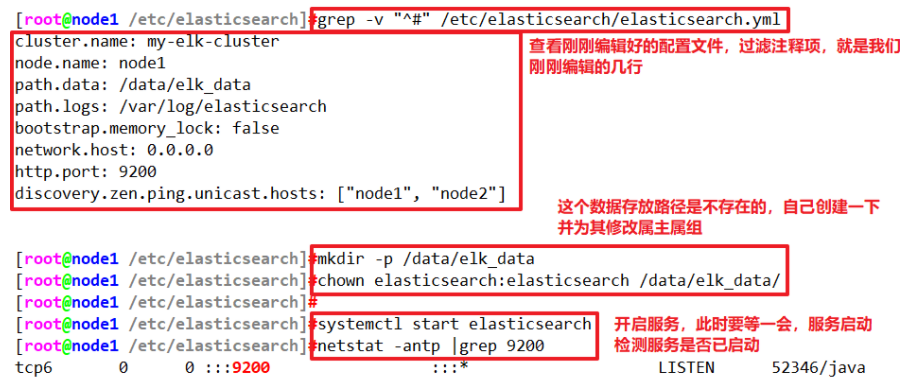
grep -v "^#" /etc/elasticsearch/elasticsearch.yml
(4)Create data storage path and authorize
mkdir -p /data/elk_data
chown elasticsearch:elasticsearch /data/elk_data/
(5)start-up elasticsearch Successfully opened
systemctl start elasticsearch.service
netstat -antp | grep 9200
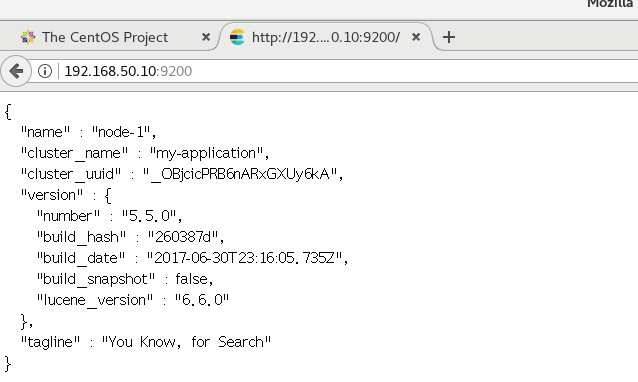
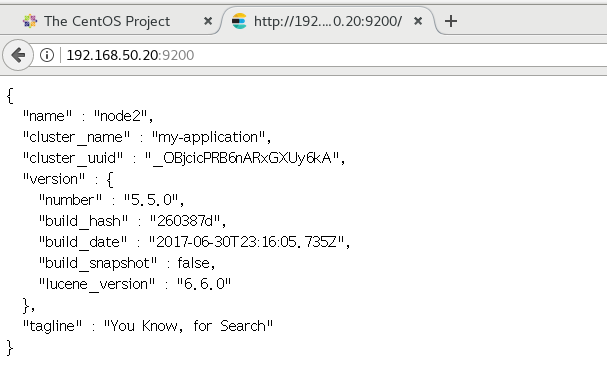
(6)View node information
Browser access http://192.168.80.10:9200 , http://192.168.80.11:9200 View the information of nodes Node1 and Node2.
Browser access http://192.168.80.10:9200/_cluster/health?pretty , http://192.168.80.11:9200/_cluster/health?pretty view the health status of the cluster. You can see that the status value is green, indicating that the node is running healthily.
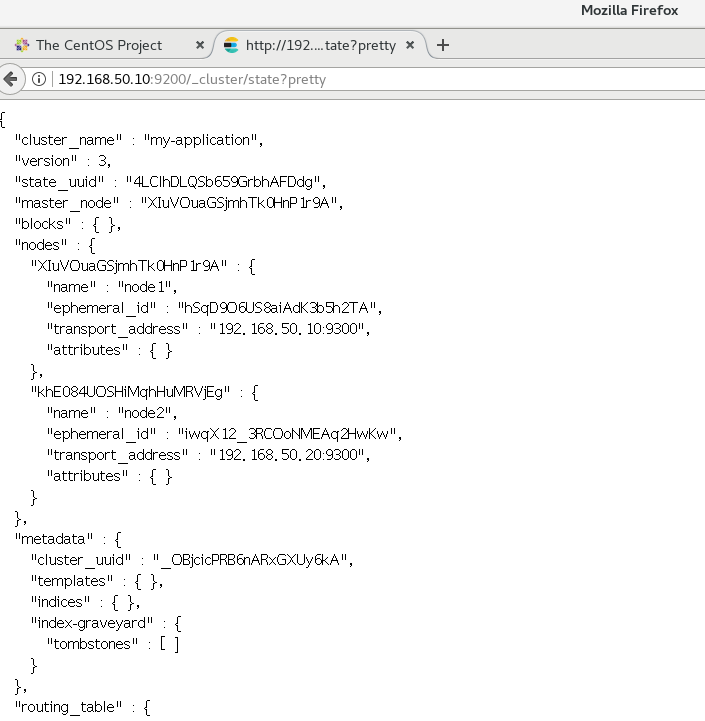
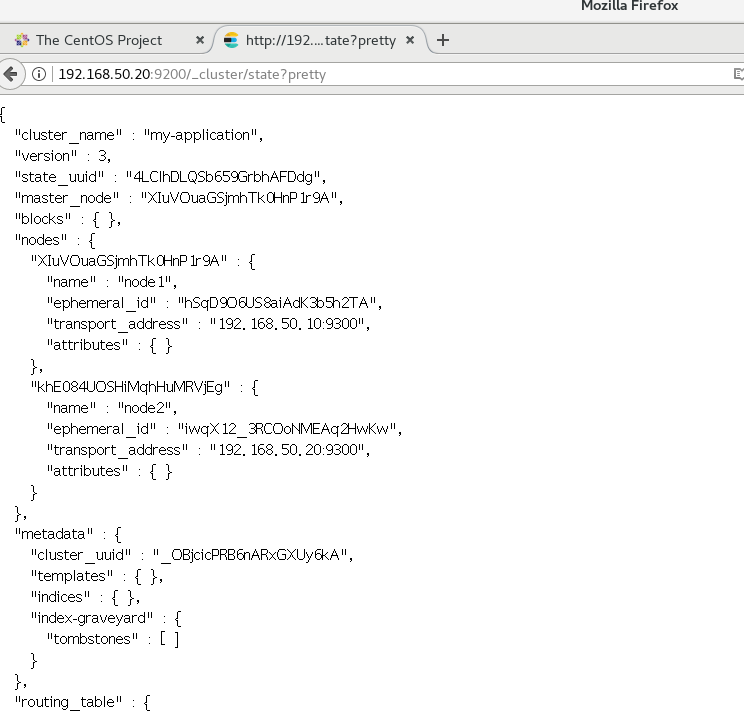
Browser access http://192.168.80.10:9200/_ Cluster / state - pretty checks the cluster state information.
#Viewing the status of the cluster in the above way is not user-friendly. You can more easily manage the cluster by installing the elasticsearch head plug-in.
3.install Elasticsearch-head plug-in unit
Elasticsearch At 5.0 After version, Elasticsearch-head The plug-in needs to be installed as an independent service and needs to be used npm Tools( NodeJS Package management tool) installation.
install Elasticsearch-head Dependent software needs to be installed in advance node and phantomjs.
node: Is based on Chrome V8 Engine JavaScript Operating environment.
phantomjs: Is based on webkit of JavaScriptAPI,Can be understood as an invisible browser, any based on webkit Whatever the browser does, it can do it.
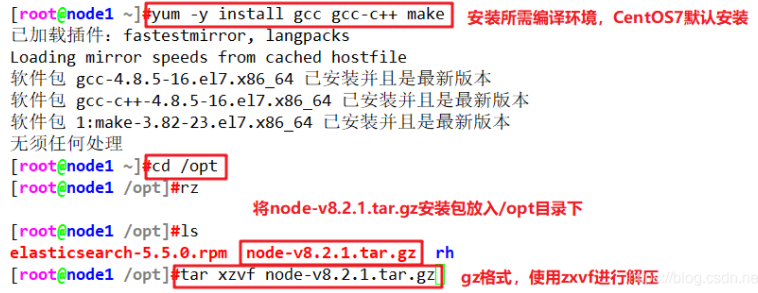
(1)Compile and install node
#Upload the software package node-v8.2.1.tar.gz to / opt
yum install gcc gcc-c++ make -y
cd /opt
tar zxvf node-v8.2.1.tar.gz
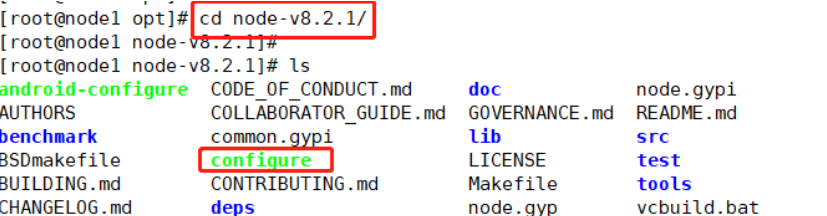
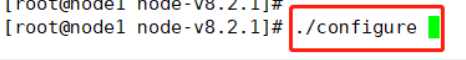
cd node-v8.2.1/
./configure
make && make install
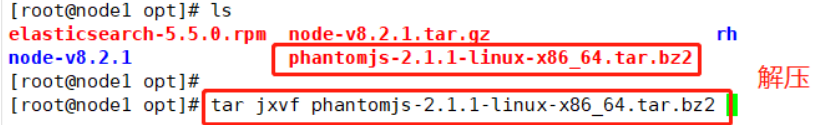
(2)install phantomjs
#Upload software package phantomjs-2.1.1-linux-x86_64.tar.bz2 to
cd /opt
tar jxvf phantomjs-2.1.1-linux-x86_64.tar.bz2 -C /usr/local/src/
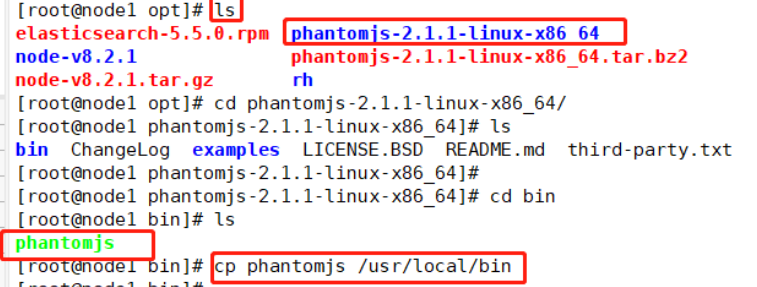
cd /usr/local/src/phantomjs-2.1.1-linux-x86_64/bin
cp phantomjs /usr/local/bin
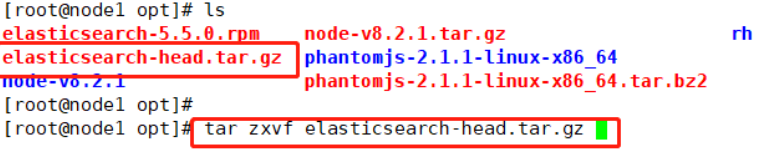
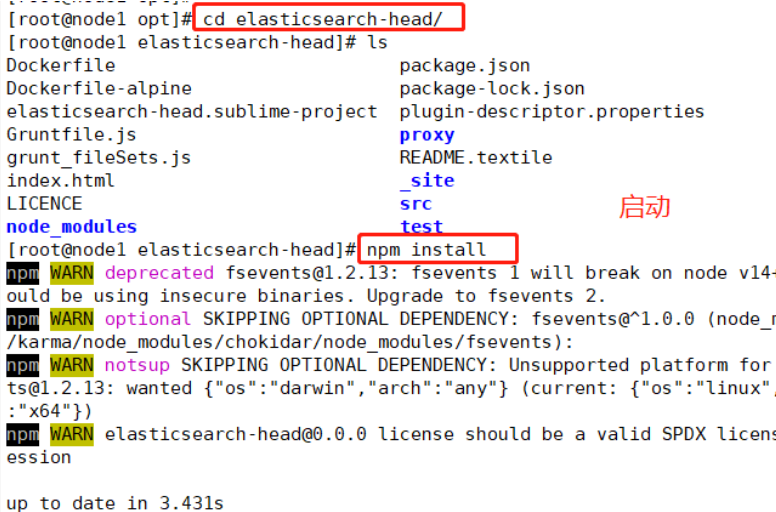
(3)install Elasticsearch-head Data visualization tool
#Upload the package elasticsearch-head.tar.gz to / opt
cd /opt
tar zxvf elasticsearch-head.tar.gz -C /usr/local/src/
cd /usr/local/src/elasticsearch-head/
npm install
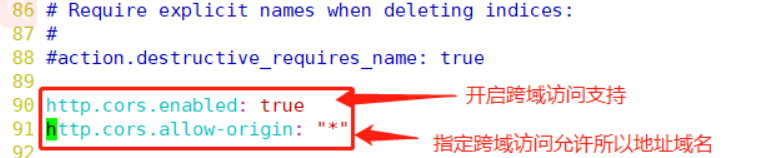
(4)modify Elasticsearch Master profile
vim /etc/elasticsearch/elasticsearch.yml
......
--Add the following at the end--
http.cors.enabled: true #Enable cross domain access support. The default value is false
http.cors.allow-origin: "*" #Specify that the domain names and addresses allowed for cross domain access are all
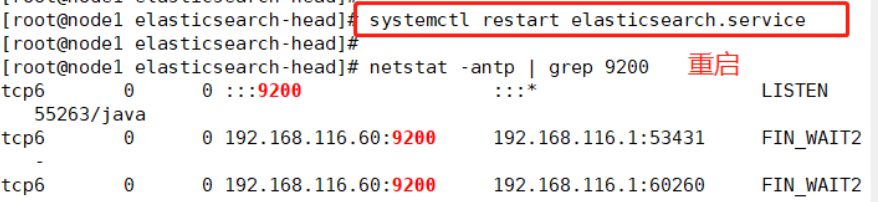
systemctl restart elasticsearch
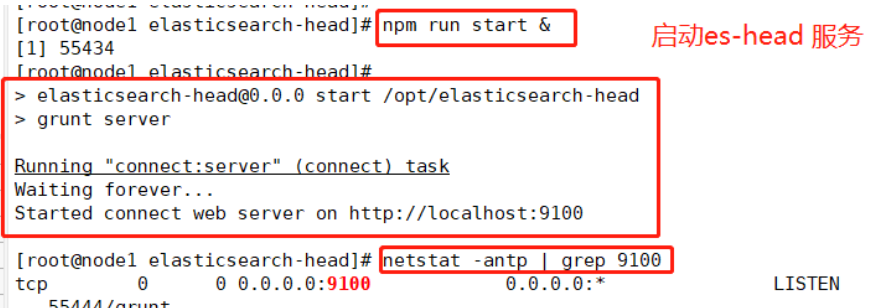
(5)start-up elasticsearch-head service
#The service must be started in the extracted elasticsearch head directory, and the process will read the gruntfile.js file in this directory, otherwise the startup may fail.
cd /usr/local/src/elasticsearch-head/
npm run start &
> elasticsearch-head@0.0.0 start /usr/local/src/elasticsearch-head
> grunt server
Running "connect:server" (connect) task
Waiting forever...
Started connect web server on http://localhost:9100
#The port monitored by elastic search head is 9100
netstat -natp |grep 9100
(6)adopt Elasticsearch-head see Elasticsearch information
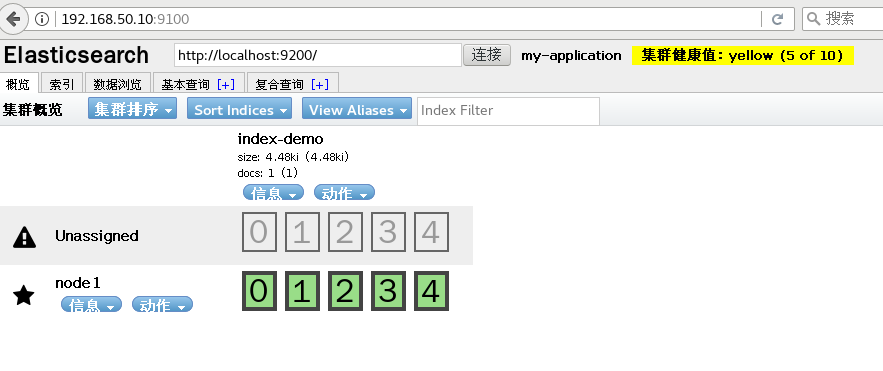
Access via browser http://192.168.80.10:9100 / address and connect to the cluster. If you see that the cluster health value is green, it means that the cluster is very healthy.
(7)Insert Index
#Insert a test index through the command. The index is index demo and the type is test.
curl -X PUT 'localhost:9200/index-demo/test/1?pretty&pretty' -H 'content-Type: application/json' -d '{"user":"zhangsan","mesg":"hello world"}'
//The output results are as follows:
{
"_index" : "index-demo",
"_type" : "test",
"_id" : "1",
"_version" : 1,
"result" : "created",
"_shards" : {
"total" : 2,
"successful" : 2,
"failed" : 0
},
"created" : true
}
Browser access http://192.168.80.10:9100/ when viewing the index information, you can see that the index is divided into 5 by default, and there is a copy.
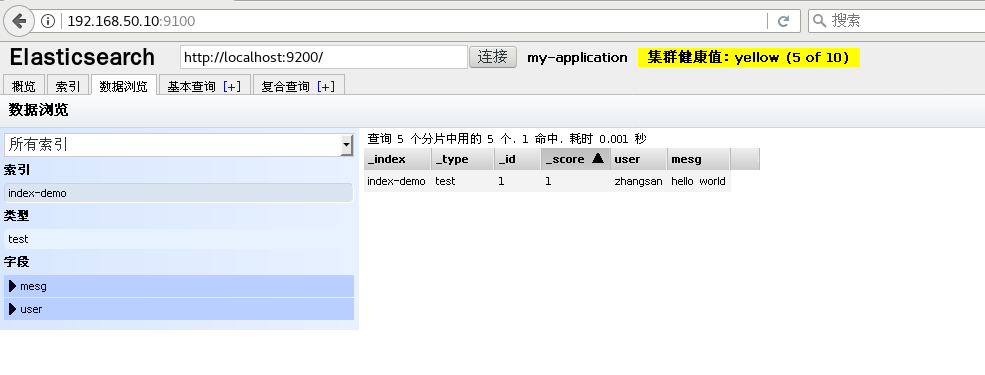
Click "data browsing" and you will find node1 The index created on is index-demo,Type is test Information about.Configure the elasticsearch environment (node1, node2)
Two node1node2 nodes map IP and host respectively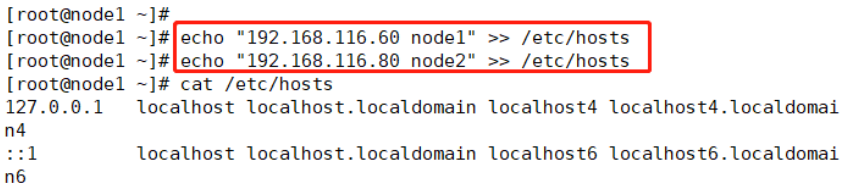
At this time, you can access the real machine to view the node information
The real machine detects the cluster health and views the cluster status
Install elasticsearch head plug-in
Compile and install node
The above way to view the cluster is inconvenient. We can manage the cluster by installing the elastic search head plug-in

Install phantomjs
Install elasticsearch head data visualization tool
Modify Elasticsearch main configuration file
Start the elasticsearch head service
View Elasticsearch information through Elasticsearch head
 ELK Logstash deployment (operating on Apache nodes)
Logstash is generally deployed on servers that need to monitor their logs. In this case, logstash is deployed on the Apache server to collect the log information of the Apache server and send it to Elasticsearch
---------------------- ELK Logstash Deployment (in) Apache (operation on node) ----------------------------------------
Logstash It is generally deployed on the server whose logs need to be monitored. In this case, Logstash Deployed in Apache Server for collecting Apache Log information of the server and send it to Elasticsearch.
1.Change host name
hostnamectl set-hostname apache
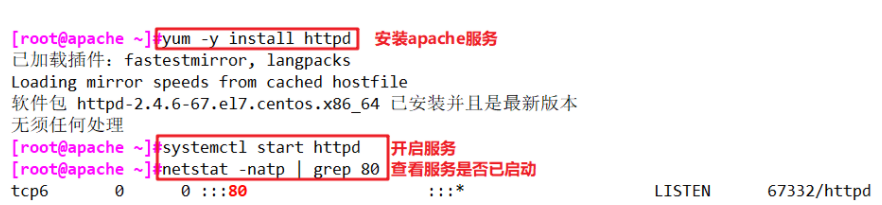
2.install Apahce Service( httpd)
yum -y install httpd
systemctl start httpd
3.install Java environment
yum -y install java
java -version
4.install logstash
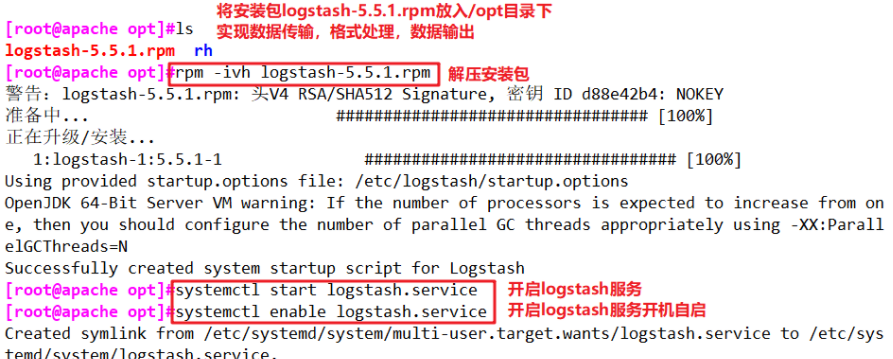
#Upload the software package logstash-5.5.1.rpm to the / opt directory
cd /opt
rpm -ivh logstash-5.5.1.rpm
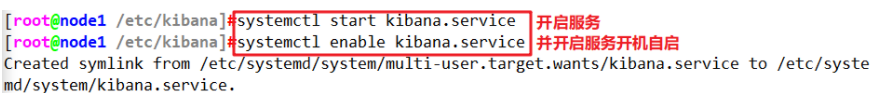
systemctl start logstash.service
systemctl enable logstash.service
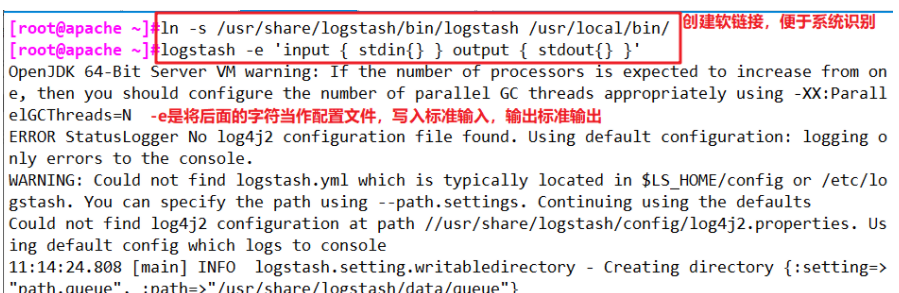
ln -s /usr/share/logstash/bin/logstash /usr/local/bin/
5.test Logstash
Logstash Common options for commands:
-f: This option allows you to specify Logstash According to the configuration file Logstash Input and output streams.
-e: From the command line, the input and output are followed by a string, which can be regarded as Logstash Configuration of (if it is empty, it is used by default) stdin As input, stdout As output).
-t: Test that the configuration file is correct and exit.
Define input and output streams:
#The input adopts standard input and the output adopts standard output (similar to pipeline)
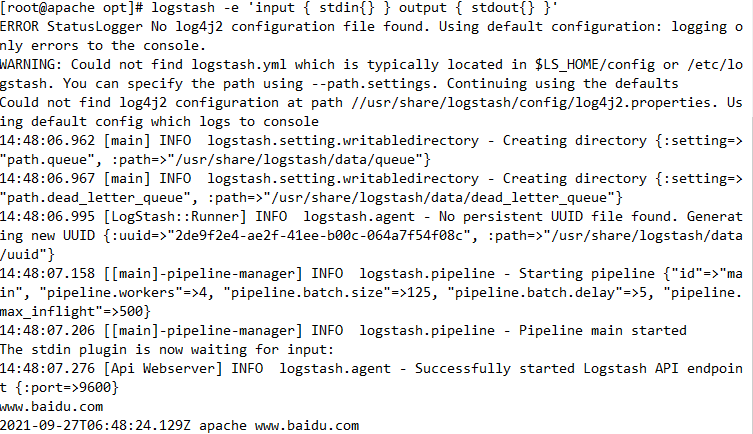
logstash -e 'input { stdin{} } ouput { stdout{} }'
......
www.baidu.com #Type (standard input)
2020-12-22T03:58:47.799Z node1 www.baidu.com #Output result (standard output)
www.sina.com.cn #Type (standard input)
2017-12-22T03:59:02.908Z node1 www.sina.com.cn #Output result (standard output)
//Execute ctrl+c to exit
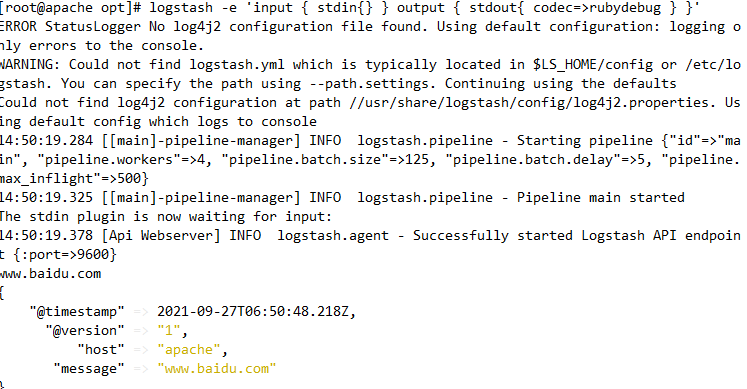
#Using rubydebug output detailed format display, codec is a codec
logstash -e 'input { stdin{} } output { stdout{ codec=>rubydebug } }'
......
www.baidu.com #Type (standard input)
{
"@timestamp" => 2020-12-22T02:15:39.136Z, #Output results (processed results)
"@version" => "1",
"host" => "apache",
"message" => "www.baidu.com"
}
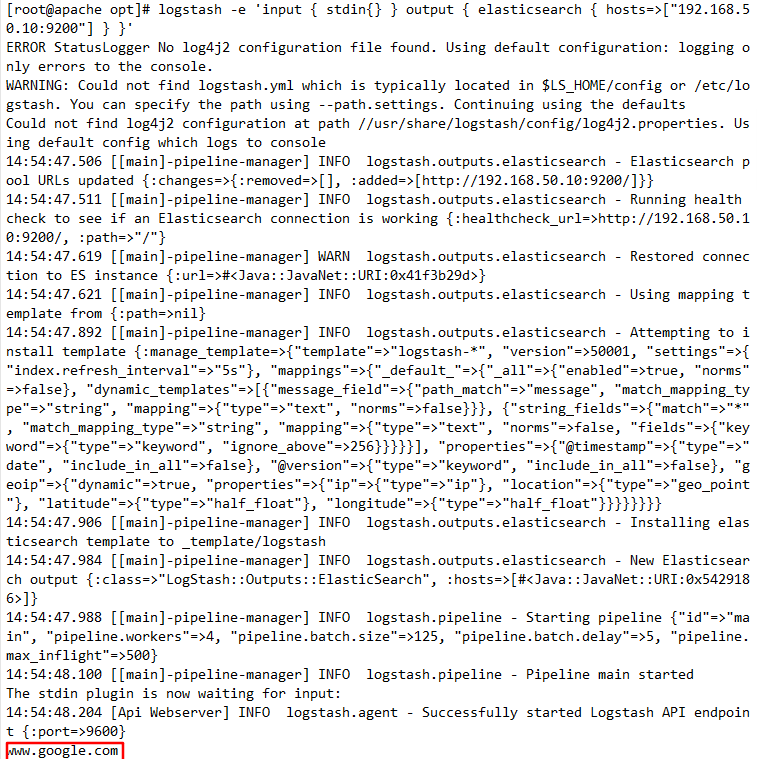
#Use Logstash to write information to Elasticsearch
logstash -e 'input { stdin{} } output { elasticsearch { hosts=>["192.168.80.10:9200"] } }'
input output Docking
......
www.baidu.com #Type (standard input)
www.sina.com.cn #Type (standard input)
www.google.com #Type (standard input)
//The results are not displayed in the standard output, but are sent to Elasticsearch, which can be accessed by the browser http://192.168.80.10:9100/ View index information and data browsing.
6.definition logstash configuration file
Logstash The configuration file basically consists of three parts: input,output as well as filter(Optional, use as needed).
#The format is as follows:
input {...}
filter {...}
output {...}
#In each section, you can also specify multiple access methods. For example, to specify two log source files, the format is as follows:
input {
file { path =>"/var/log/messages" type =>"syslog"}
file { path =>"/var/log/httpd/access.log" type =>"apache"}
}
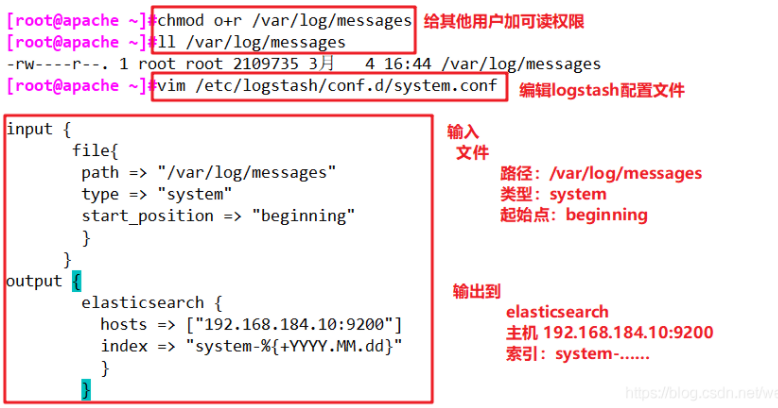
#Modify the Logstash configuration file to collect the system log / var/log/messages and output it to elasticsearch.
chmod +r /var/log/messages #Allow Logstash to read logs
vim /etc/logstash/conf.d/system.conf
input {
file{
path =>"/var/log/messages" #Specify the location of the logs to collect
type =>"system" #Custom log type ID
start_position =>"beginning" #Indicates collection from the beginning
}
}
output {
elasticsearch { #Output to elasticsearch
hosts => ["192.168.50.10:9200"] #Specify the address and port of the elasticsearch server
index =>"system-%{+YYYY.MM.dd}" #Specifies the index format to output to elasticsearch
}
}
systemctl restart logstash
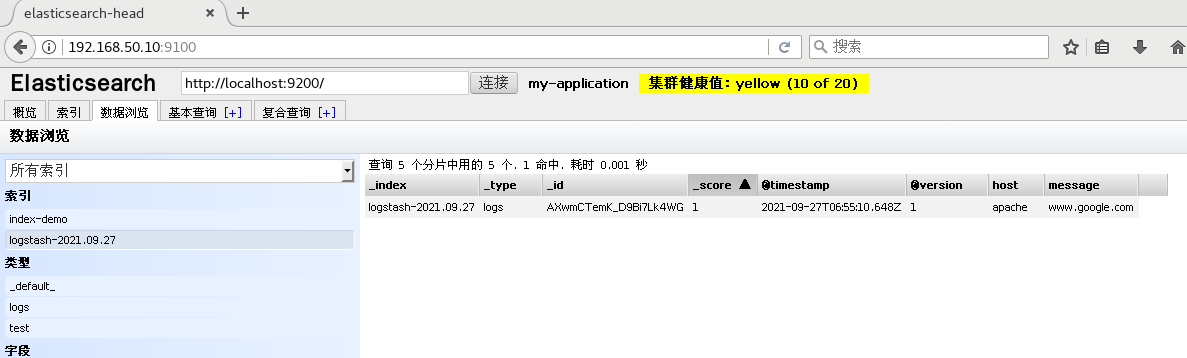
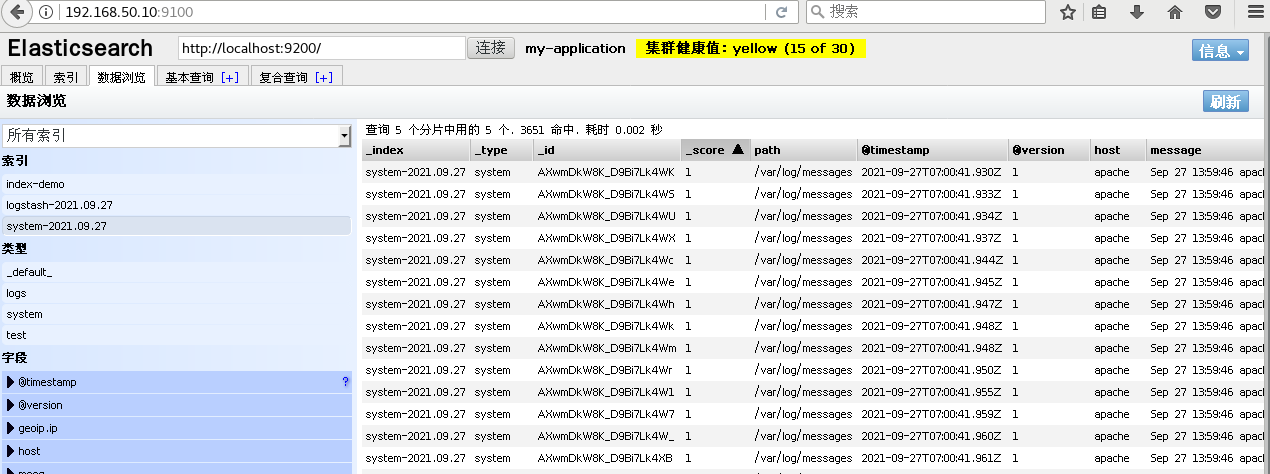
Browser access http://192.168.50.10:9100/ view index information

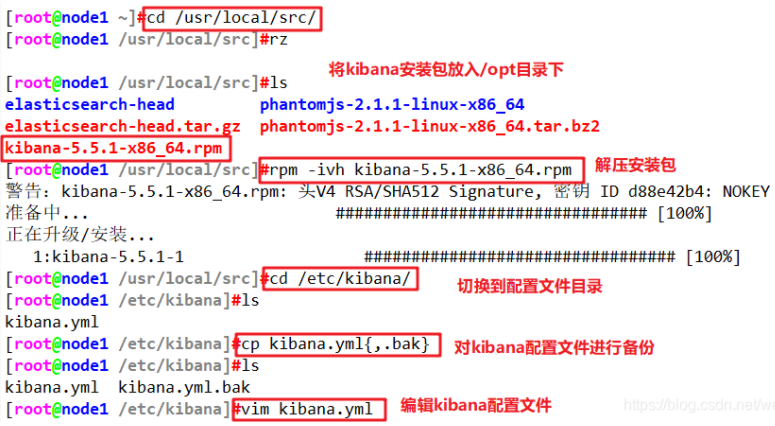
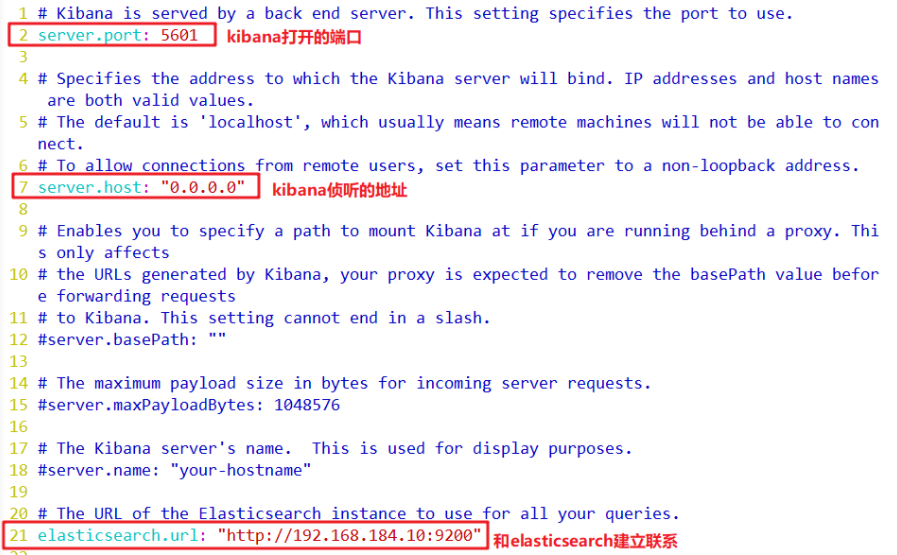
Install kibana on node1 host
cd /usr/local/src/
rz kibana-5.5.1-x86_64.rpm

rpm -ivh kibana-5.5.1-x86_64.rpm

cd /etc/kibana/
cp kibana.yml kibana.yml.bak

vim kibana.yml
2/ server.port: 5601               		 				#kibana open port
7/ server.host: "0.0.0.0"          						#Address where kibana listens
21/ elasticsearch.url: "http://192.168.184.10:9200 "# establish contact with elasticsearch
30/ kibana.index: ".kibana"              				#Add the. kibana index in elasticsearch

systemctl start kibana.service
systemctl enable kibana.service

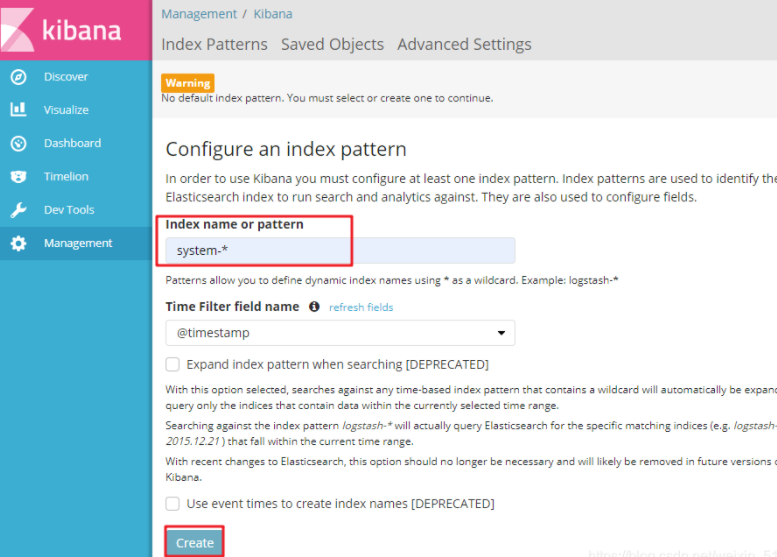
Create an index name for the first login: System - * ## this is the docking system log file
Index name or pattern #### enter system-*
Then click the Create button at the bottom to create
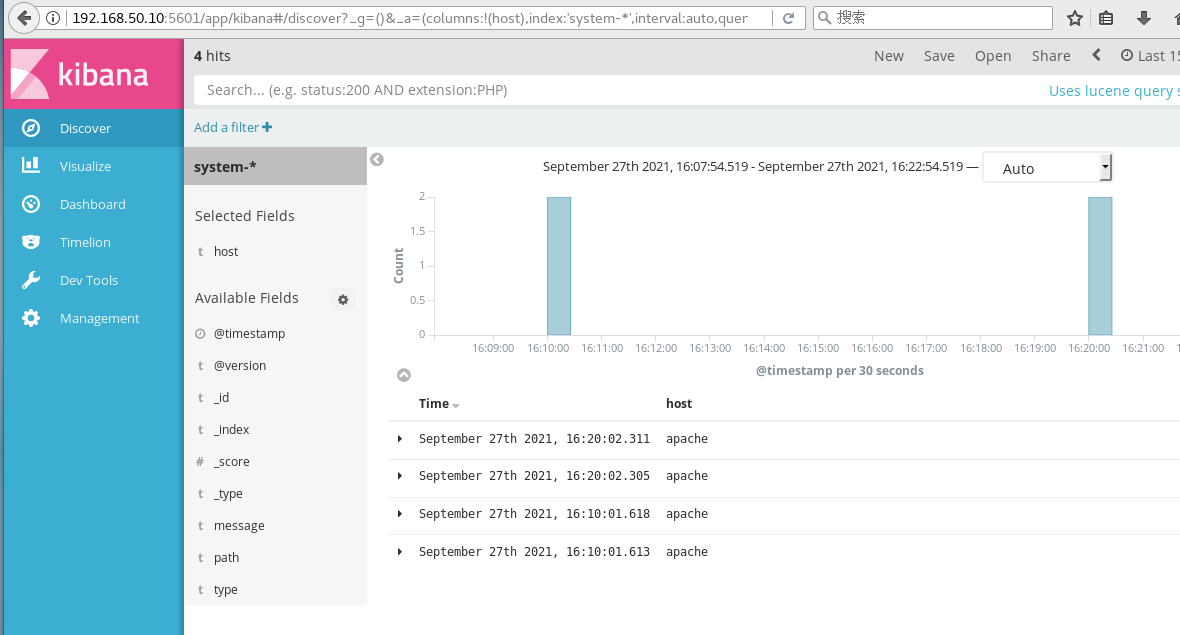
Then click the Discover button in the top left corner to find the system - * information
Then click add next to the host below, and you will find that the figure on the right has only the Time and host options, which is more friendly
 Docking apache log files (access, error)
cd /etc/logstash/conf.d/

vim apache_log.conf
input {
       file{
        path => "/etc/httpd/logs/access_log"
        type => "access"
        start_position => "beginning"
        }
       file{
        path => "/etc/httpd/logs/error_log"
        type => "error"
        start_position => "beginning"
        }

      }
output {
        if [type] == "access" {
        elasticsearch {
          hosts => ["192.168.184.10:9200"]
          index => "apache_access-%{+YYYY.MM.dd}"
          }
        }
        if [type] == "error" {
        elasticsearch {
          hosts => ["192.168.184.10:9200"]
          index => "apache_error-%{+YYYY.MM.dd}"
          }
        }
        }

/usr/share/logstash/bin/logstash -f apache_log.conf
Open input http://192.168.50.10
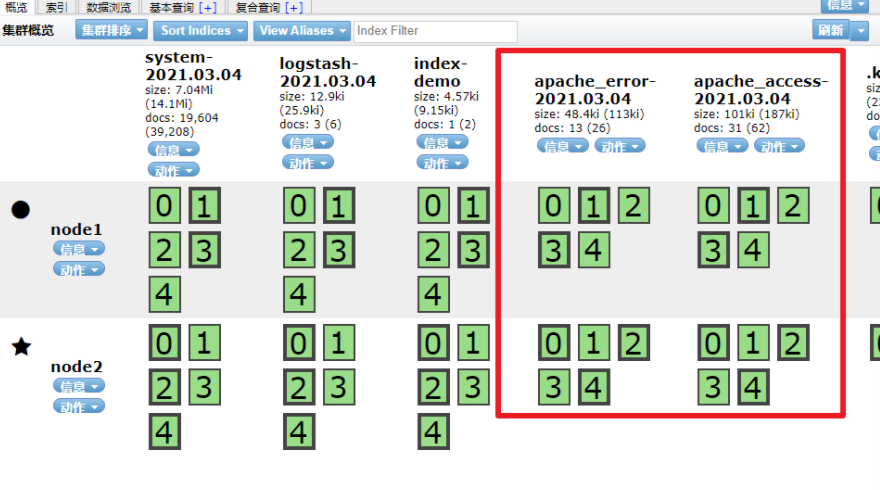
Open browser input http://192.168.50.10:9100/ View index information
Can find
apache_error-2021.03.04 apache_access-2021.03.04
Open browser input http://192.168.50.10:5601
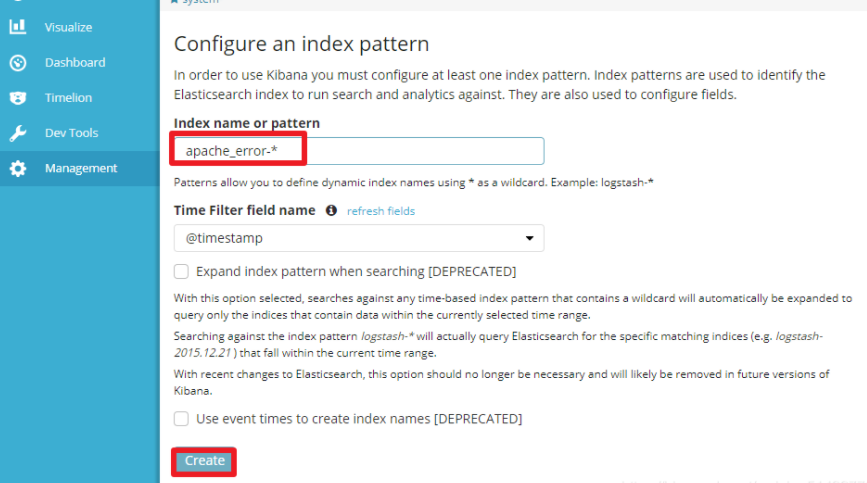
Click the management option in the lower left corner - index patterns - create index pattern
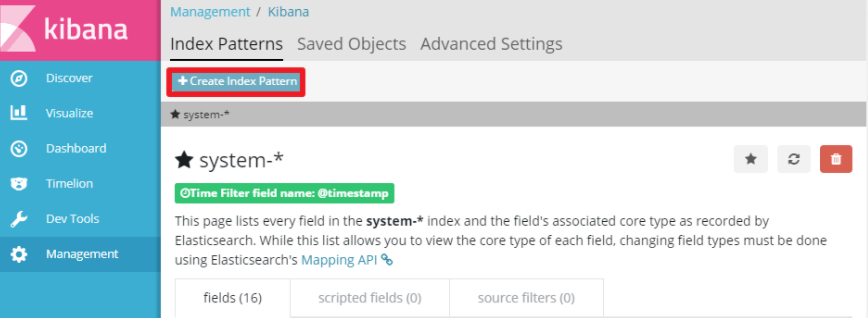
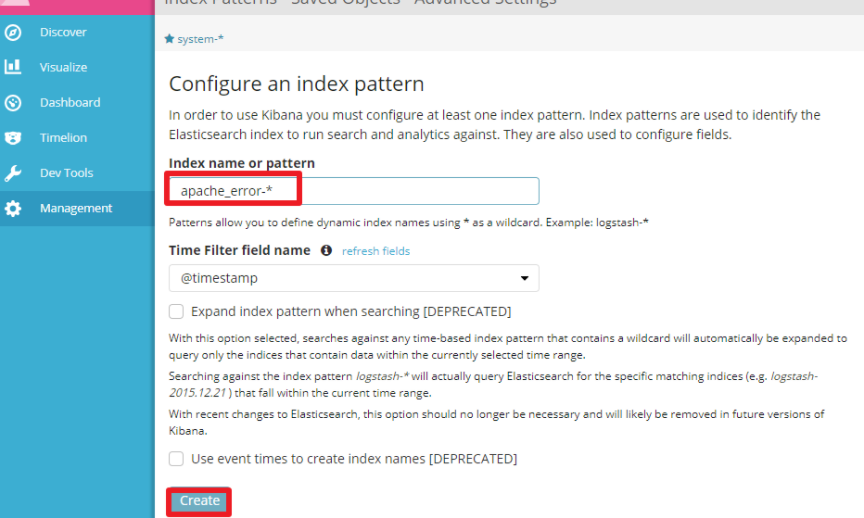
----Create the indexes of apache_error - * and apache_access - * respectively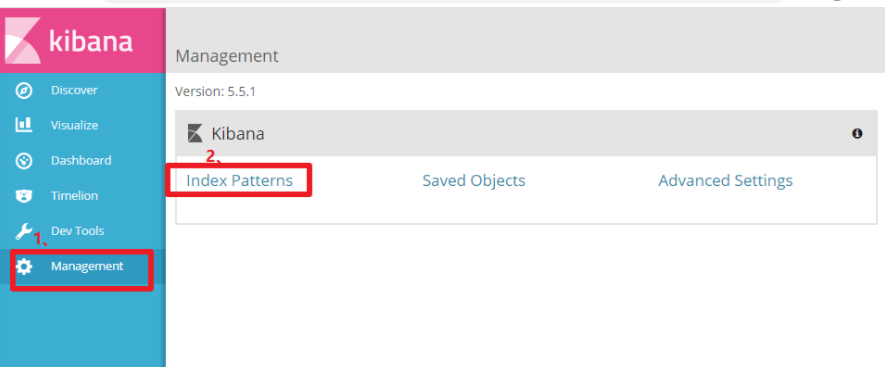
Open browser input http://192.168.50.10:5601
Click the management option in the lower left corner - index patterns - create index pattern
----Create the indexes of apache_error - * and apache_access - * respectively
3, Filebeat+ELK deployment
Node1 node (2C/2G): 192.168.50.60 Elasticsearch Filebeat
Node2 node (2C/2G): 192.168.50.80 Elasticsearch
Apache node: 192.168.50.100 Logstash Apache Kibana
//Operate on Node1 node
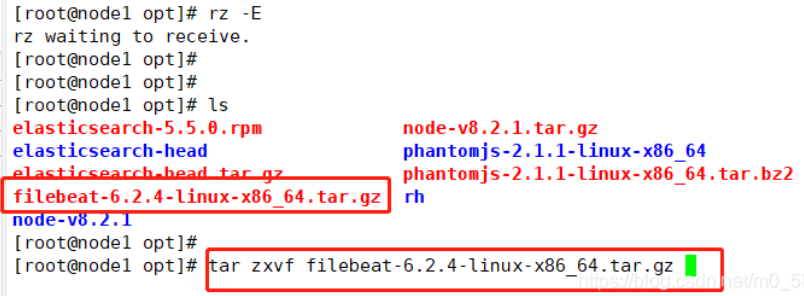
1.install Filebeat
#Upload the package filebeat-6.2.4-linux-x86_64.tar.gz to the / opt directory
tar zxvf filebeat-6.2.4-linux-x86_64.tar.gz
mv filebeat-6.2.4-linux-x86_64/ /usr/local/filebeat
2.set up Kibana Master profile for
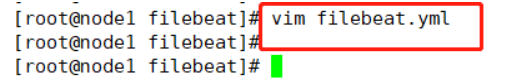
cd /usr/local/filebeat
vim filebeat.yml
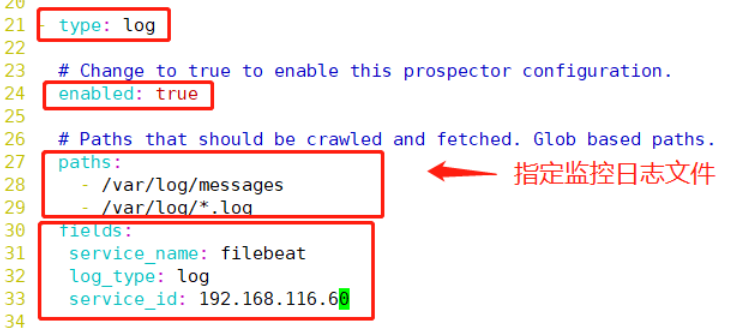
filebeat.prospectors:
- type: log #Specify the log type to read messages from the log file
enabled: true
paths:
- /var/log/messages #Specify the log file to monitor
- /var/log/*.log
fields: #You can use the fields configuration option to set some parameters and add fields to output
service_name: filebeat
log_type: log
service_id: 192.168.80.13
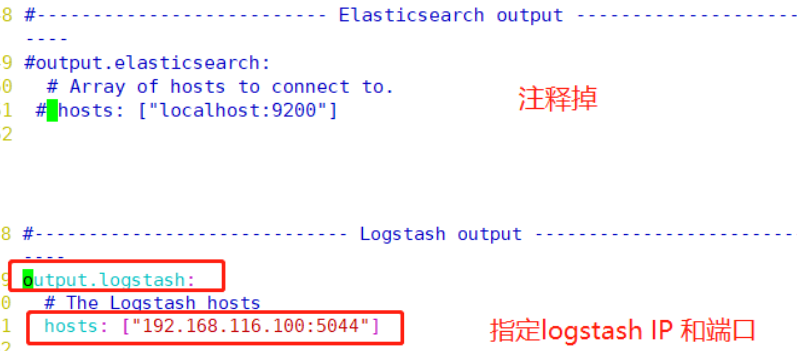
--------------Elasticsearch output-------------------
(Comment out all)
----------------Logstash output---------------------
output.logstash:
hosts: ["192.168.80.12:5044"] #Specify the IP and port of logstash
#Start filebeat
./filebeat -e -c filebeat.yml
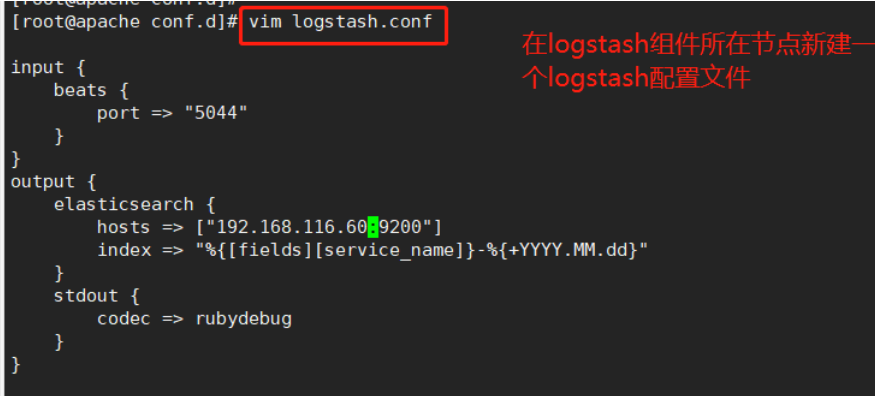
4.stay Logstash Create a new one on the node where the component is located Logstash configuration file
cd /etc/logstash/conf.d
vim logstash.conf
input {
beats {
port => "5044"
}
}
output {
elasticsearch {
hosts => ["192.168.80.10:9200"]
index => "%{[fields][service_name]}-%{+YYYY.MM.dd}"
}
stdout {
codec => rubydebug
}
}
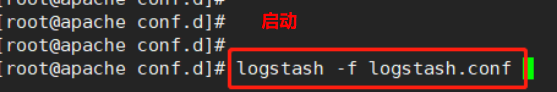
#Start logstash
logstash -f logstash.conf
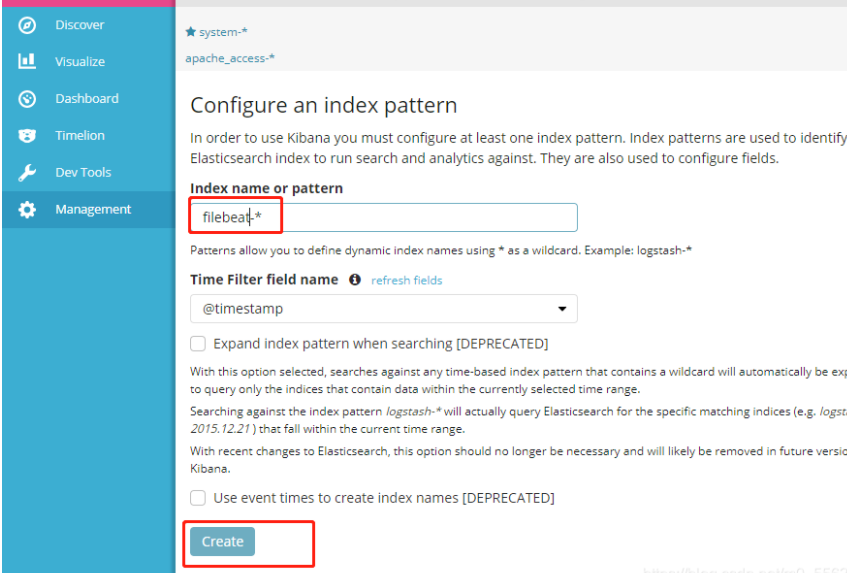
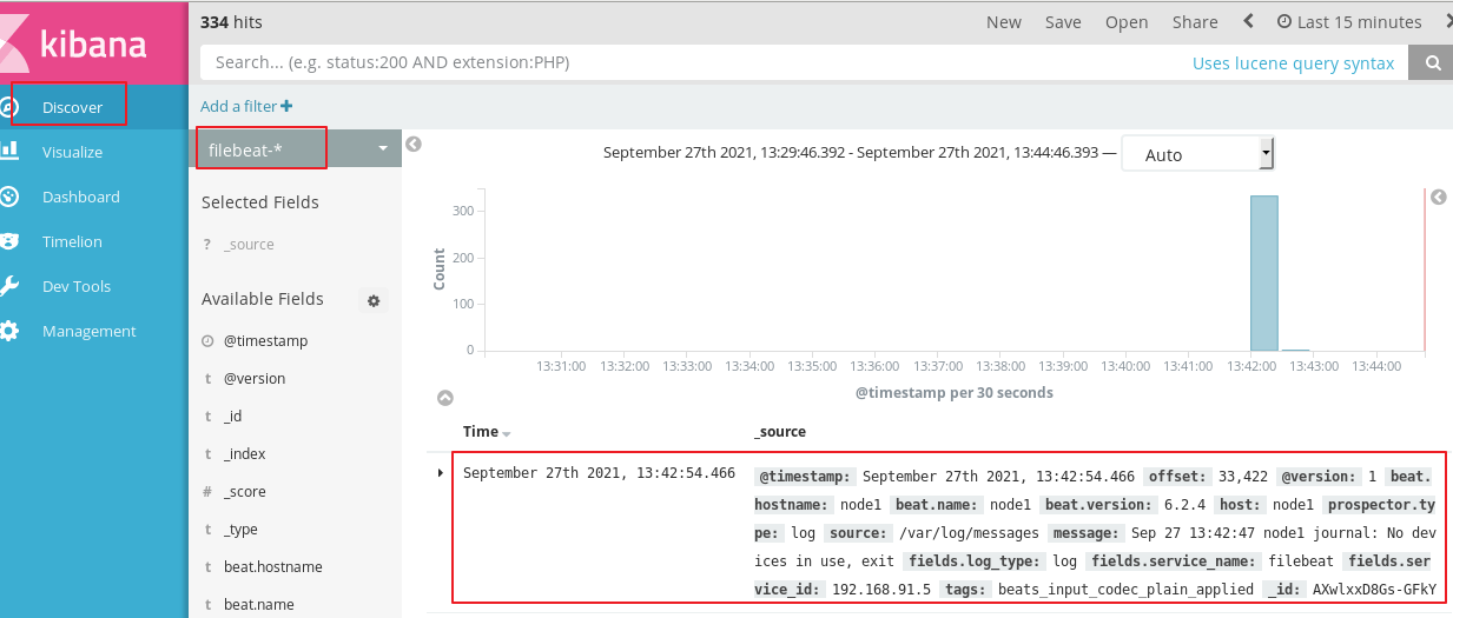
5.Browser access http://192.168.80.10:5601 log in to Kibana, click the "Create Index Pattern" button to add the index "filebeat - *", click the "create" button to create, and click the "Discover" button to view the chart information and log information.