catalogue
1, Introduction to ELK log analysis system
1. Advantages and disadvantages of log server
2.1 Logstash management includes four tools
2, Basic core concepts of Elasticsearch
5, Configure ELK log analysis system
1. Install elasticsearch cluster
1.1. Configure elasticsearch environment
1.2. Deploy elasticsearch software
1.3. Install elasticsearch head plug-in
1.4. Install phantomjs front-end frame
1.5. Install elasticsearch head data visualization tool
2.2. Installing apache service and jdk environment
3. Install kibana on node1 host
3.1. Log of docking with apache (accessed and error)
1, Introduction to ELK log analysis system
1. Advantages and disadvantages of log server
- advantage
- Improve security
- Centralized storage of logs
- shortcoming
- Difficult analysis of logs
2. What is ELK?
A management tool for simplified log analysis Elasticsearch (ES), Logstash and Kibana are three open source tools. The official website is: https://www.elastic.co/products
- ES(nosql non relational database): storage function and index
- Logstash (log collection): take the log from the application server and output it to es after format conversion
Collect / collect log s through the input function
filter: formatting data
Output: log output to es database
- Kibana (display tool): display the data in es in the browser and display it through the UI interface (you can process the log according to your own needs for easy viewing and reading)
2.1 Logstash management includes four tools
- Packetbeat (collect network traffic data)
- Topbeat (collect CPU and memory usage data at system, process and file system levels)
- Filebeat (collecting file data) is a lightweight tool compared with Logstash
- Winlogbeat (collect Windows event log data)
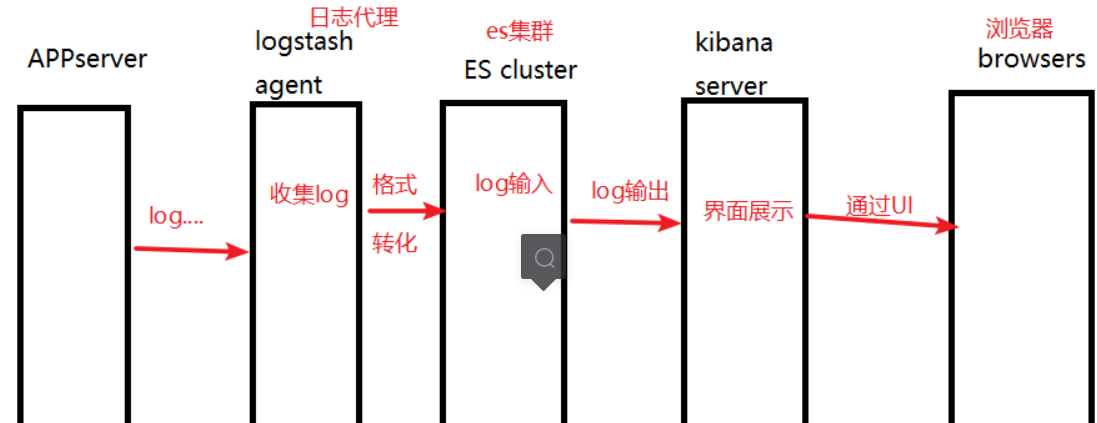
2.2 log processing steps
1. Logstash collects logs generated by AppServer and centralizes log management
2. Format the log and store it in the ElasticSearch cluster
3. Index and store the formatted data (Elasticsearch)
4. Kibana queries the data from the Es cluster, generates charts, and then returns them to browsers
2, Basic core concepts of Elasticsearch
Relationship between relational database and Elasticsearch
| mysql | Elasticsearch |
|---|---|
| Database database | Index index |
| table | Type type |
| Row row | Document document |
| Column column | attribute |
-
Near real time (NRT)
Elastic search is a near real-time search platform, which means that there is a slight delay (usually 1 second) from indexing a document until the document can be searched -
Cluster
The cluster has a unique identifier name, which is elasticsearch by default;
Cluster is organized by one or more nodes. They jointly hold the whole data and provide index and search functions together;
One of the nodes is the primary node, which can be elected and provides cross node joint index and search functions;
The cluster name is very important. Each node is added to its cluster based on the cluster name -
Node
Node is a single server, which is a part of the cluster, stores data and participates in the index and search functions of the cluster;
Like clusters, nodes are also identified by name. By default, the character name is randomly assigned when the node is started, which can be defined by itself;
The name is used to identify the node corresponding to the server in the cluster. -
Index
An index is a collection of documents with somewhat similar characteristics;
An index is identified by a name (which must be all lowercase letters), and we should use this name when we want to index, search, update and delete the documents corresponding to the index. -
Type
In an index, you can define one or more types. A type is a logical classification / partition of your index; Typically, a type is defined for a document that has a common set of fields -
document
Documents are represented in JSON (JavaScript object notation) format, which is a ubiquitous Internet data interaction format.
Although a document is physically located in an index, in fact, a document must be indexed and assigned a type within an index. -
shards
That is why es as a search engine is fast:
In practice, the data stored in the index may exceed the hardware limit of a single node. For example, a 1 billion document requires 1TB of space, which may not be suitable for storage on the disk of a single node, or the search request from a single node is too slow. To solve this problem, elastic search provides the function of dividing the index into multiple slices. When creating an index, you can define the number of slices you want to slice. Each partition is a fully functional independent index, which can be located on any node in the cluster.
Benefits of fragmentation:
① : horizontally split and expand to increase the storage capacity
② : distributed parallel cross slice operation to improve performance and throughput -
Replica
In order to prevent data loss caused by network problems and other problems, a failover mechanism is required. Therefore, elasticsearch allows us to copy one or more indexes into fragments, which is called fragmented copy or replica.
There are also two main reasons for replicas:
① : high availability to deal with fragmentation or node failure, which needs to be on different nodes
② : improve performance, increase throughput, and search can be performed on all replicas in parallel
3, Logstash introduction
Logstash is written in JRuby language, based on the simple message based architecture, and runs on the Java virtual machine (JVM). Logstash can configure a single agent to combine with other open source software to realize different functions.
The concept of Logstash is very simple. It only does three things: Collect: data input, Enrich: data processing, 1 such as filtering, modification, etc., and Transport: data output (called by other modules)
4, Introduction to Kibana
Kibana is an open source analysis and visualization platform for Elasticsearch, which is used to search and view the data interactively stored in Elasticsearch index. With kibana, advanced data analysis and display can be carried out through various charts. It is easy to operate, and the browser based user interface can quickly create a dashboard to display the Elasticsearch query dynamics in real time. Setting up kibana is very simple. Kibana installation can be completed and Elasticsearch index monitoring can be started in a few minutes without writing code.
5, Configure ELK log analysis system
Environmental preparation
| host | operating system | Host name IP address | Main software |
|---|---|---|---|
| The server | Centos7.4 | node1 | 192. 168.35.40 |
| The server | Centos7.4 | node2 | 192.168.35.10 |
| The server | Centos7.4 | apache | 192.168.35.20 |
1. Install elasticsearch cluster
1.1. Configure elasticsearch environment
Change host name configuration domain name resolution view Java environment
hostnamectl set-hostname node1
hostnamectl set-hostname node2
hostnamectl set-hostname apache
vim /etc/hosts
192.168.35.40 node1
192.168.35.10 node2
upload jdk Compressed package to opt Directory
tar xzvf jdk-8u91-linux-x64.tar.gz -C /usr/local/
cd /usr/local/
mv jdk1.8.0_91 jdk
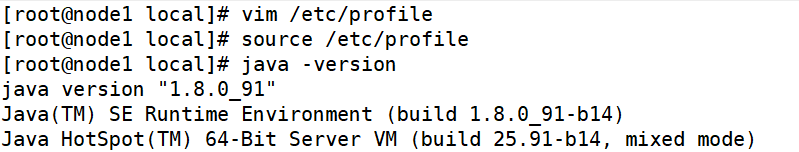
vim /etc/profile
export JAVA_HOME=/usr/local/jdk
export JRE_HOME=${JAVA_HOME}/jreexport CLASSPATH=.:${JAVA_HOME}/lib:${JRE_HOME}/lib
export PATH=${JAVA_HOME}/bin:$PATH
source /etc/profile
java -version
1.2. Deploy elasticsearch software
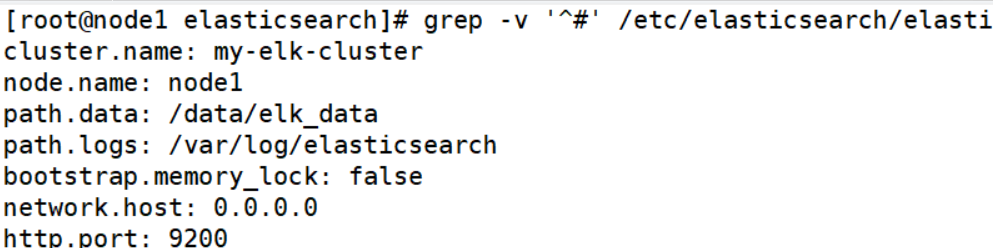
upload elasticsearch Package to opt Directory

rpm -ivh elasticsearch-5.5.0.rpm
systemctl daemon-reload 	##Load system services
systemctl enable elasticsearch	##Open service

modify elasticsearch configuration file

cd /etc/elasticsearch/
cp elasticsearch.yml elasticsearch.yml.bak
vim elasticsearch.yml
	17 cluster.name: my-elk-cluster		##Change cluster name
	23 node.name: node1		##Change node name
	33 path.data: /data/elk_data		##Change data storage path, elk_data needs to be created manually
	37 path.logs: /var/log/elasticsearch		##Change file directory
	43 bootstrap.memory_lock: false	##Lock the physical memory address to prevent es memory from being swapped out. Frequent swapping will lead to high IOPS (performance test: read and write times per second)
	55 network.host: 0.0.0.0		##Change to full network segment
	59 http.port: 9200		##Open port
	68 discovery.zen.ping.unicast.hosts: ["node1", "node2"]  		##Change node name
grep -v '^#' /etc/elasticsearch/elasticsearch.yml
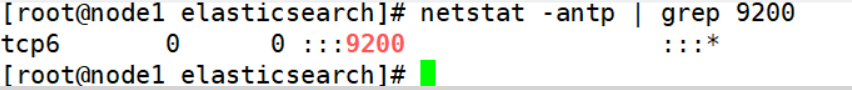
mkdir -p /data/elk_data		##Create data storage path
chown elasticsearch:elasticsearch /data/elk_data/		##Change primary group
systemctl start elasticsearch		##Open service
The node2 server has the same configuration
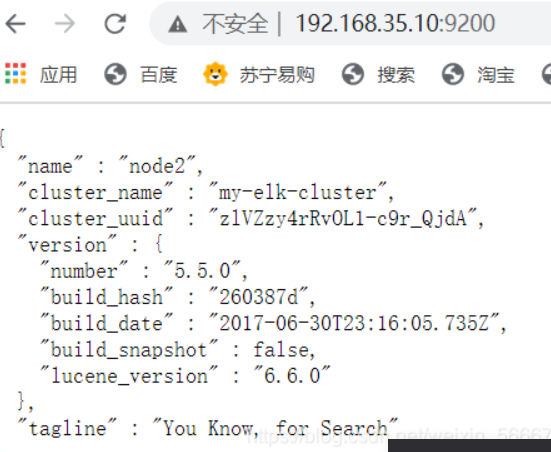
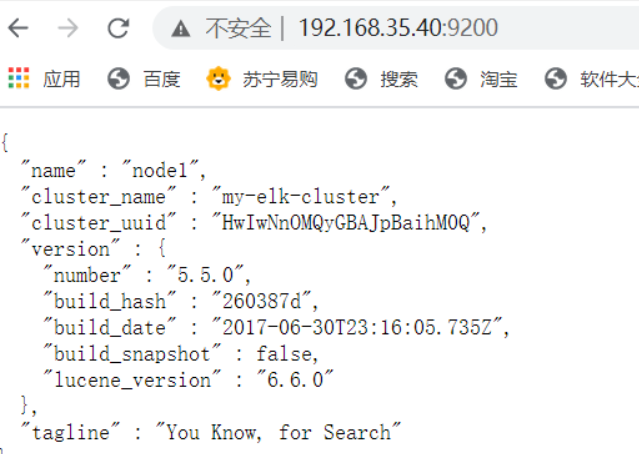
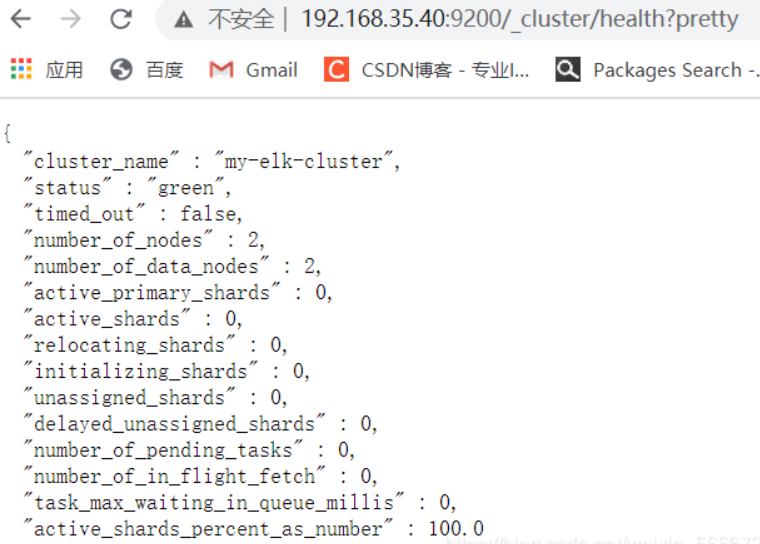
In real browser 192.168.56.1 open

192.168.35.40:9200/_cluster/health?pretty		##Check cluster health
192.168.35.40:9200/_cluster/state?pretty		##View cluster status
1.3. Install elasticsearch head plug-in
The above way to view the cluster is inconvenient. We can manage the cluster by installing the elastic search head plug-in
Log in to the node1 host at 192.168.35.40
upload node-v8.2.1.tar .gz reach/opt
yum -y install gcc gcc-C++ make
Compile and install node Component dependent packages take 47 minutes
cd /opt
tar -xzvf node-v8.2.1.tar.gz
cd node-v8.2.1
./configure
make -j3		(This process requires 10 minutes-30 Minutes vary, depending on your computer configuration)
make install
1.4. Install phantomjs front-end frame
Upload package to/usr/local/src/
cd /usr/local/src/
tar xjvf phantomjs-2.1.1-linux-x86_64.tar.bz2
cd phantomjs-2.1.1-linux-x86_64/bin
cp phantomjs /usr/local/bin
1.5. Install elasticsearch head data visualization tool
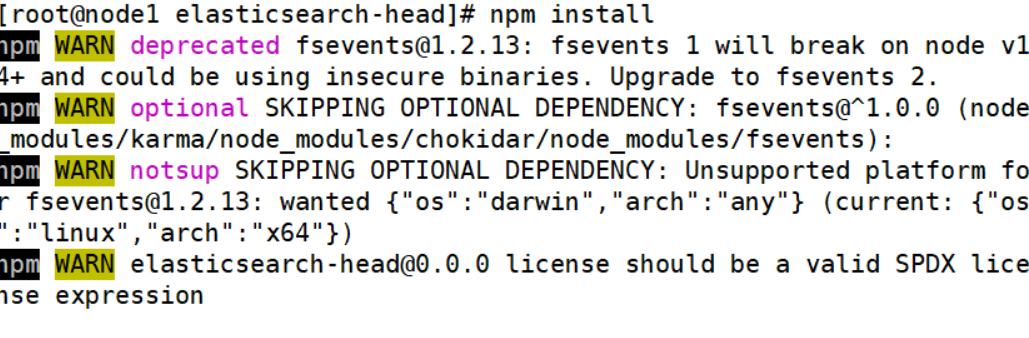
cd /usr/local/src/
tar xzvf elasticsearch-head.tar.gz
cd elasticsearch-head/
npm install
vim /etc/elasticsearch/elasticsearch.yml		##Modify master profile
 Insert the following two lines at the end of the configuration file
	http.cors.enabled: true    		##Enable cross domain access support. The default value is false
	http.cors.allow-origin: "*"		##Allowed domain names and addresses for cross domain access
systemctl restart elasticsearch
cd /usr/local/src/elasticsearch-head/
npm run start &start-up elasticsearch-head Start the server; Switch to background operation
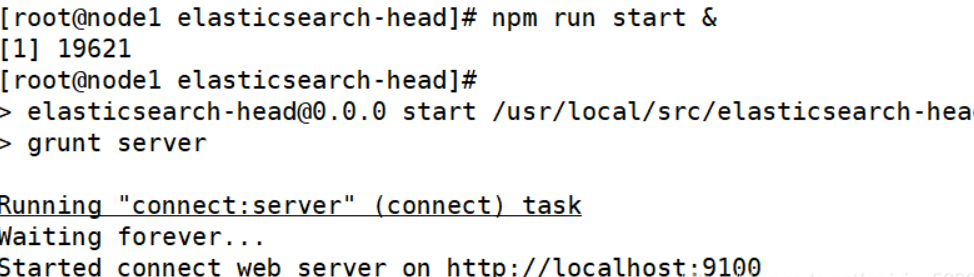
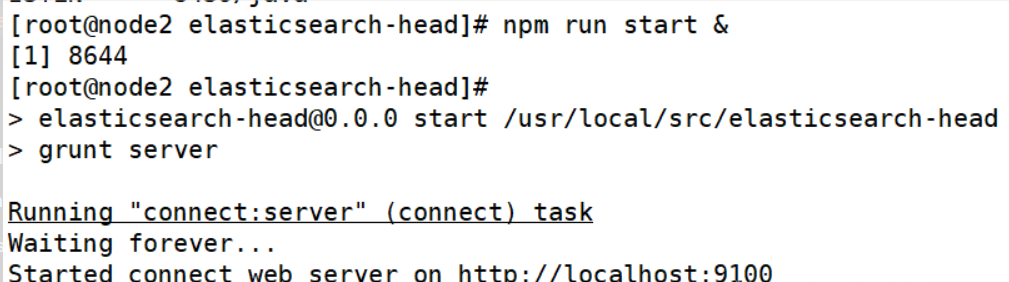
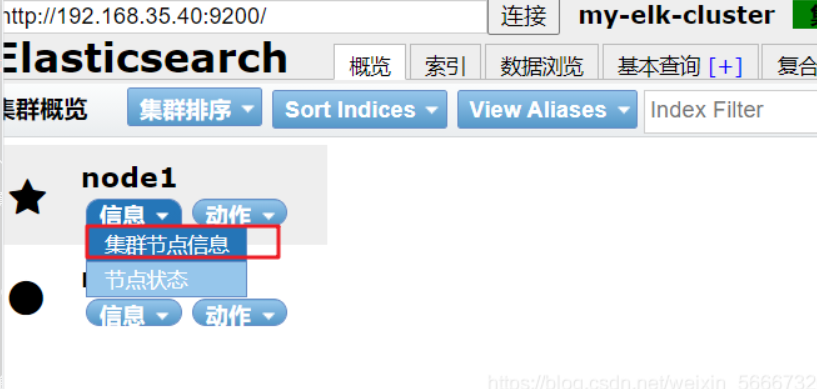
View 192.168.35.40:9100 and 192.168.35.10:9100 on windows
Changing localhost to node ip will display node status information
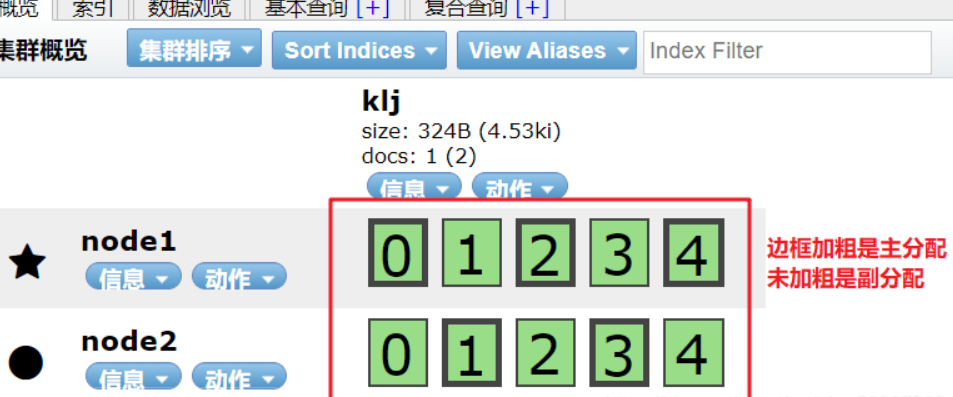
As shown in the figure below, the index is divided into 5 by default and has one copy
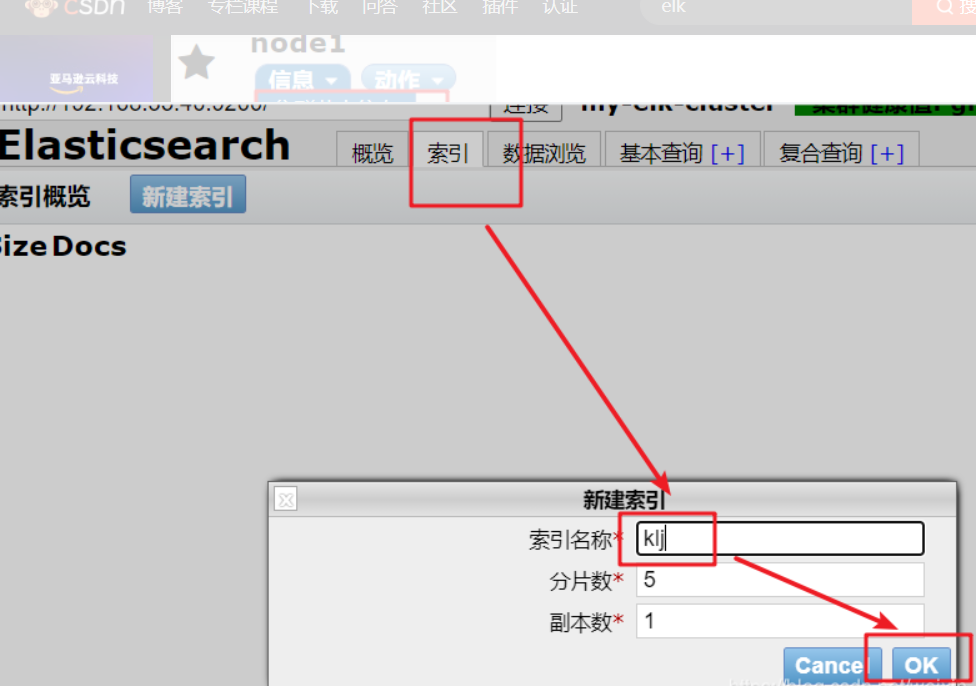
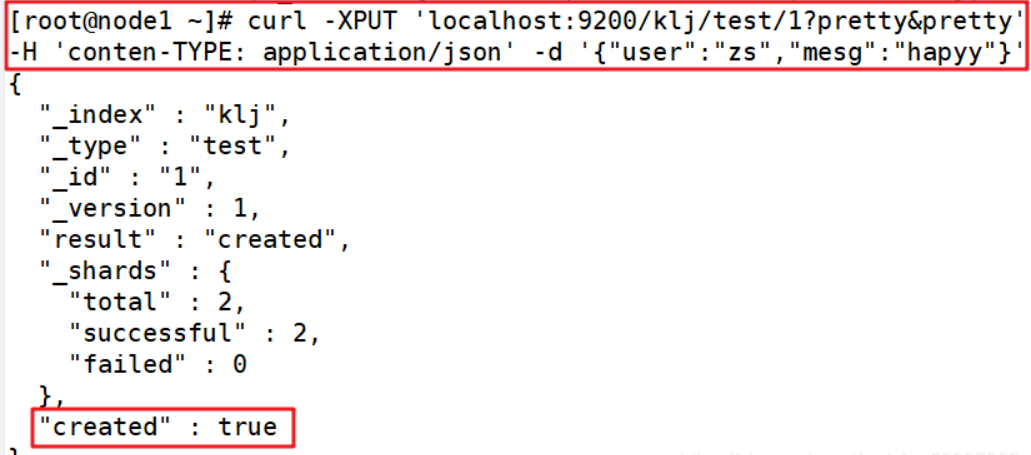
curl -XPUT 'localhost:9200/klj/test/1?pretty&pretty' -H 'conten-TYPE: application/json' -d '{"user":"zs","mesg":"hapyy"}' ##Insert an index called klj, the index type is test, the index content is zs, and the information is happy
2. Install logstash
2.2. Installing apache service and jdk environment
yum -y install httpd
systemctl start httpd
 upload jdk Compressed package to opt Directory
tar xzvf jdk-8u91-linux-x64.tar.gz -C /usr/local/
cd /usr/local/
mv jdk1.8.0_91 jdk
vim /etc/profile
	export JAVA_HOME=/usr/local/jdk
	export JRE_HOME=${JAVA_HOME}/jreexport CLASSPATH=.:${JAVA_HOME}/lib:${JRE_HOME}/lib
	export PATH=${JAVA_HOME}/bin:$PATH
source /etc/profile
java -version
2.3 installation of logstash
Upload installation package to opt Directory

cd /opt
rpm -ivh logstash-5.5.1.rpm
systemctl start logstash.service
ln -s /usr/share/logstash/bin/logstash /usr/local/bin/
2.4 docking test logstash
Description and explanation of the Logstash command test field:
-f: This option allows you to specify the configuration file of logstash and configure logstash according to the configuration file
-e: Followed by a string, which can be used as the configuration of logstash (if it is "", stdin is used as the standard input and stdout is used as the standard output by default)
-t: Test that the configuration file is correct and exit
2.5 standard input / output
logstash agent(agent)Plug in for
①input
②filter
③output
logstash -e 'input { stdin{} } output { stdout{} }'
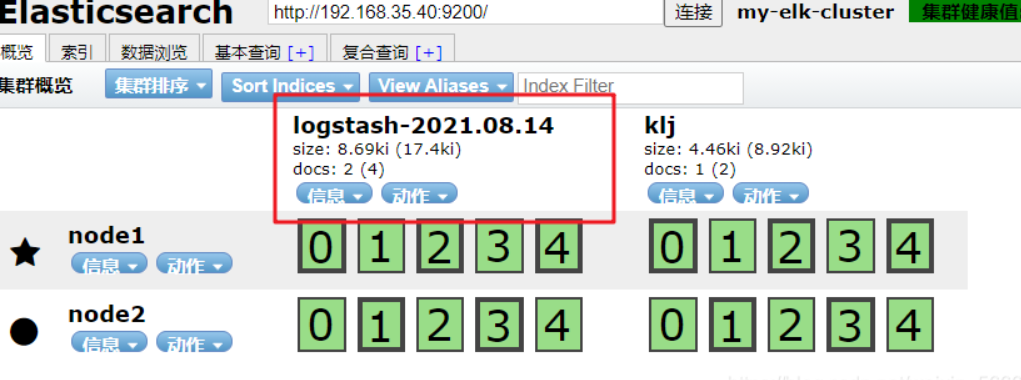
Input docking without exiting. Access the data browsing of elasticsearch head plug-in in the local window
It can be seen that the overview is more than logstash-2021.8.14
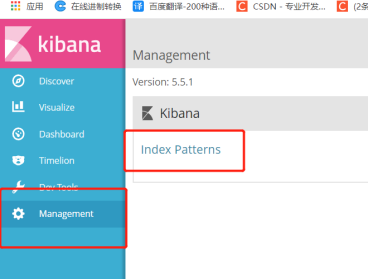
3. Install kibana on node1 host
upload kibana-5.5.1-x86_64.rpm reach/usr/local/src catalogue
cd /usr/local/src
rpm -ivh kibana-5.5.1-x86_64.rpm
cd /etc/kibana/
cp kibana.yml kibana.yml.bak
vim kibana.yml
	 2 server.port: 5601		##kibana open port
	 7 server.host: "0.0.0.0"		##Address where kibana listens
	21 elasticsearch.url: "http://192.168.35.40:9200" 		## Contact elasticsearch
	30 kibana.index: ".kibana"		##Add. kibana index in elasticsearch
systemctl start kibana.service		##Start kibana service
 To access port 5601: http://192.168.35.40:5601/
3.1. Log of docking with apache (accessed and error)
cd /etc/logstash/conf.d/
vim apache_log.conf
input {
	file{
	    path => "/etc/httpd/logs/access_log"
	    type => "access"
	    start_position => "beginning"
	    }
	file{
	    path => "/etc/httpd/logs/error_log"
	    type => "error"
	    start_position => "beginning"
	    }
	}
output {
	if [type] == "access" {
	elasticsearch {
            hosts => ["192.168.35.40:9200"]
	    index => "apache_access-%{+YYYY.MM.dd}"
   	    }
	}
	if [type] == "error" {
	elasticsearch {
            hosts => ["192.168.35.40:9200"]
	    index => "apache_error-%{+YYYY.MM.dd}"
   	    }
	}
	}
logstash -f apache_log.conf		##Specify to use Apache_ Configuration file for log.conf
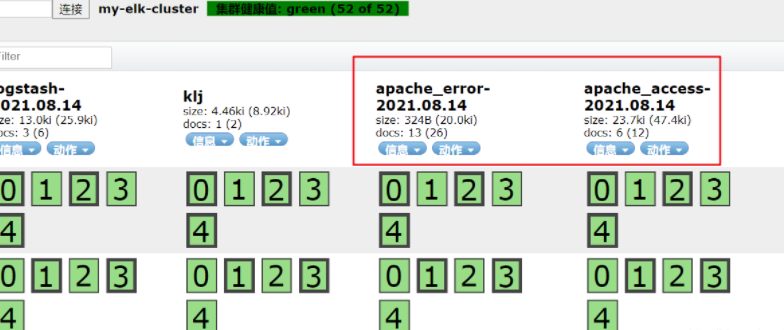
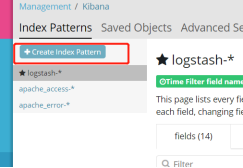
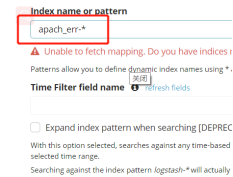
Enter kibana to create Apache index appche_acess and apache_error
Homepage Management – Index Patterns – Create Index Pattern – select inde name or pattern
At this time, you can query Apache by viewing kibana_ access-,Apache_error-,system-*
6, Summary
This chapter explains that elk (management tool for simplified log analysis) is composed of ElasticSearch, Logstash and Kiabana; Their functions are as follows:
- ES(nosql non relational database): storage function and index
- Logstash (log collection): take the log from the application server and output it to es after format conversion
Collect / collect log s through the input function
filter: formatting data
Output: log output to es database
- Kibana (display tool): display the data in es in the browser and display it through the UI interface (you can process the log according to your own needs for easy viewing and reading)