ELK log analysis
1, ELK introduction
ELK platform is a complete set of centralized log processing solution, which combines ElasticSearch, Logstash and Kiabana, three open-source tools to meet the more powerful user requirements for log query, sorting and statistics.
-
Elastic search: it is a distributed storage and retrieval engine based on Lucene (a full-text retrieval engine architecture), which is used to store all kinds of logs.
Elasticsearch is developed in Java and allows users to communicate with elasticsearch through a browser through a RESTful Web interface.
Elasticsearch is a real-time, distributed and scalable search engine, which allows full-text and structured search. It is usually used to index and search large amounts of log data, and can also be used to search many different types of documents. -
Kiabana: kibana is usually deployed together with Elasticsearch. Kibana is a powerful data visualization Dashboard of Elasticsearch. Kibana provides a graphical web interface to browse Elasticsearch log data, which can be used to summarize, analyze and search important data.
-
Logstash: as a data collection engine. It supports dynamic data collection from various data sources, filtering, analyzing, enriching and unifying the data, and then storing it to the location specified by the user, which is generally sent to Elasticsearch.
Logstash is written in Ruby language and runs on Java virtual machine (JVM). It is a powerful data processing tool that can realize data transmission, format processing and formatted output. Logstash has powerful plug-in functions and is often used for log processing.
#Other components that can be added:
- Filebeat: lightweight open source log file data collector. Usually, install filebeat on the client that needs to collect data and specify the directory and log format. Filebeat can quickly collect data and send it to logstash for parsing, or directly send it to Elasticsearch for storage. In terms of performance, it has obvious advantages over logstash running on JVM and is a substitute for it. It is often used in EFLK architecture.
#Benefits of filebeat combined with logstash:
1. Logstash has a disk based adaptive buffer system, which will absorb the incoming throughput, thus reducing the pressure on Elasticsearch to continuously write data
2. Extract from other data sources, such as databases, S3 object stores, or message delivery queues
3. Send data to multiple destinations, such as S3, HDFS (Hadoop distributed file system) or write files
4. Use conditional data flow logic to form more complex processing pipelines
-
Cache / message queue (redis, kafka, RabbitMQ, etc.): traffic peak shaving and buffering can be carried out for high concurrency log data. Such buffering can protect data from loss to a certain extent and decouple the application of the whole architecture.
-
Fluent D: is a popular open source data collector. Because logstash is too heavyweight, it has low performance and high resource consumption. Then fluent appeared. Compared with logstash, fluent is easier to use, less resource consumption, higher performance, more efficient and reliable in data processing. It is welcomed by enterprises and has become an alternative to logstash, which is often used in EFK architecture. EFK is also often used as a log data collection scheme in Kubernetes clusters.
In the Kubernetes cluster, fluent is usually run through the daemon set, so that it can run a Pod on each Kubernetes work node. It obtains the container log file, filters and transforms the log data, and then passes the data to the elastic search cluster, where it is indexed and stored.
2, ELK advantages and disadvantages
- advantage
Improve security
Centralized management - shortcoming
Difficult to analyze logs
Logs mainly include system logs, application logs and security logs. System operation and maintenance personnel and developers can understand the server software and hardware information through the log, check the errors in the configuration process and the causes of the errors. Regular analysis of logs can understand the load, performance and security of the server, so as to take timely measures to correct errors.
Often, we can basically analyze the logs of a single machine by using grep, awk and other tools, but when the logs are scattered and stored on different devices. If you manage dozens or hundreds of servers, you are still using the traditional method of logging in to each machine in turn. Does this feel cumbersome and inefficient. It is imperative that we use centralized log management, such as the open source syslog, to collect and summarize the logs on all servers. After centralized log management, log statistics and retrieval become a more troublesome thing. Generally, we can use grep, awk, wc and other Linux commands to achieve retrieval and statistics. However, for the requirements of higher query, sorting and statistics and the huge number of machines, it is inevitable that we can't use this method.
Generally, a large-scale system is a distributed deployment architecture. Different service modules are deployed on different servers. When a problem occurs, in most cases, it is necessary to locate the specific server and service module according to the key information exposed by the problem, and build a centralized log system, which can improve the efficiency of locating the problem.
3, Basic characteristics of complete log system
Collection: it can collect log data from multiple sources
Transmission: it can analyze, filter and transmit the log data to the storage system stably
Store: store log data
Analysis: supports UI analysis
Warning: it can provide error report and monitoring mechanism
4, ELK working process
-
Deploy Logstash on all servers that need to collect logs; Or you can centralize the log management and deploy Logstash on the log server.
-
Logstash collects logs, formats them and outputs them to Elasticsearch cluster.
-
Elasticsearch indexes and stores the formatted data.
-
Kibana queries the data from the ES cluster, generates charts, and displays the front-end data.
Summary: as a log collector, logstash collects data from the data source, filters and formats the data, and then sends it to Elasticsearch for storage. kibana visualizes the log.
5, ELK log analysis system deployment
- Environment configuration
| host | operating system | IP address | Installation package / software / tools |
|---|---|---|---|
| node1 | CentOS7 | 192.168.86.10 | Elasticsearch |
| node2 | CentOS7 | 192.168.86.20 | Elasticsearch |
| apache | CentOS7 | 192.168.86.30 | httpd / Logstash |
| Real machine | Windows | 192.168.86.100 | - |
All nodes turn off the firewall
systemctl stop firewalld.service
setenforce 0
node1(192.168.86.10)
hostnamectl set-hostname node1
su -
node2(192.168.86.20)
hostnamectl set-hostname node2
su -
apache(192.168.86.30)
hostnamectl set-hostname apache
su -
- Configure the elasticsearch environment (node1, node2)
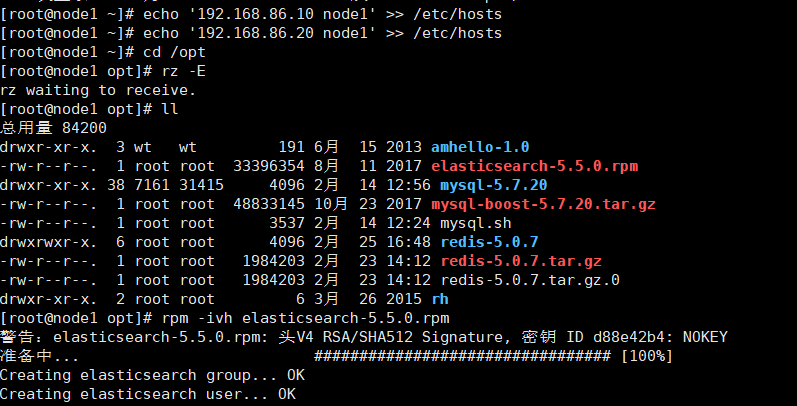
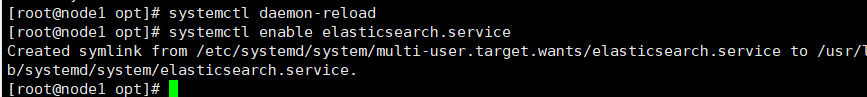
echo '192.168.86.10 node1' >> /etc/hosts
echo '192.168.86.20 node2' >> /etc/hosts


cd /opt
rz elasticsearch-5.5.0.rpm

rpm -ivh elasticsearch-5.5.0.rpm

systemctl daemon-reload
systemctl enable elasticsearch.service
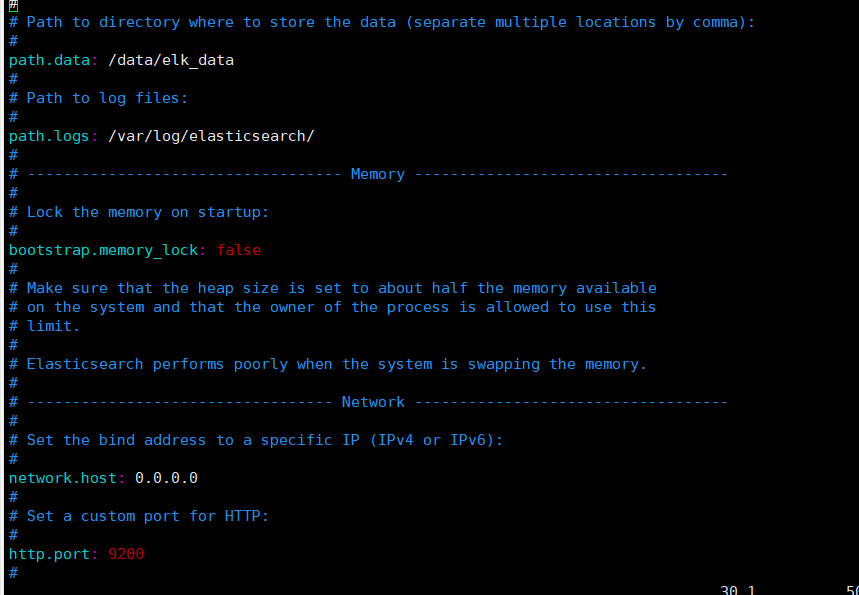
cp /etc/elasticsearch/elasticsearch.yml /etc/elasticsearch/elasticsearch.yml.bak

vim /etc/elasticsearch/elasticsearch.yml

==17==
cluster.name: my-elk-cluster

==23==
node.name: node1						#Here, node2 node is set to node2

==33==
path.data: /data/elk_data

==37==
path.logs: /var/log/elasticsearch/

==43==
bootstrap.memory_lock: false

==55==
network.host: 0.0.0.0

==59==
http.port: 9200

==68==
discovery.zen.ping.unicast.hosts: ["node1", "node2"]
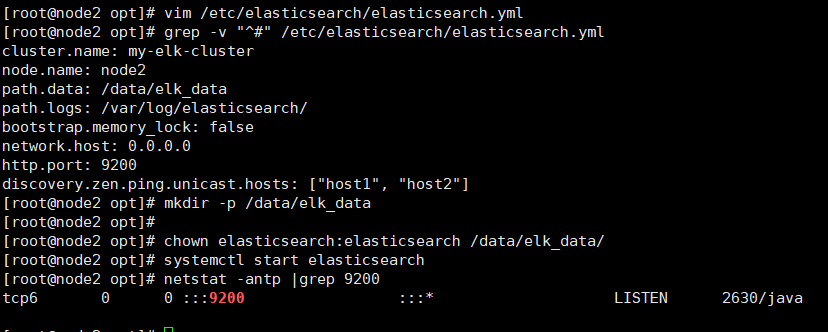
grep -v "^#" /etc/elasticsearch/elasticsearch.yml

mkdir -p /data/elk_data
chown elasticsearch:elasticsearch /data/elk_data/

systemctl start elasticsearch
netstat -antp |grep 9200
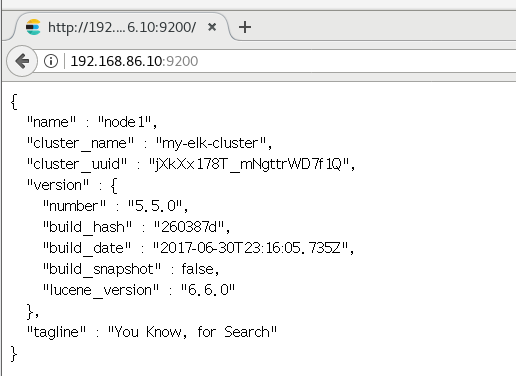
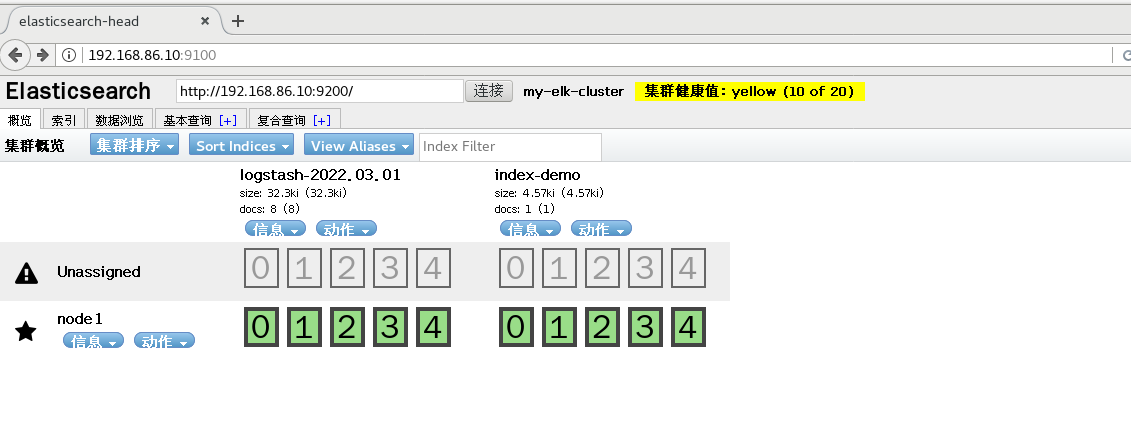
- At this time, you can access and view the node information
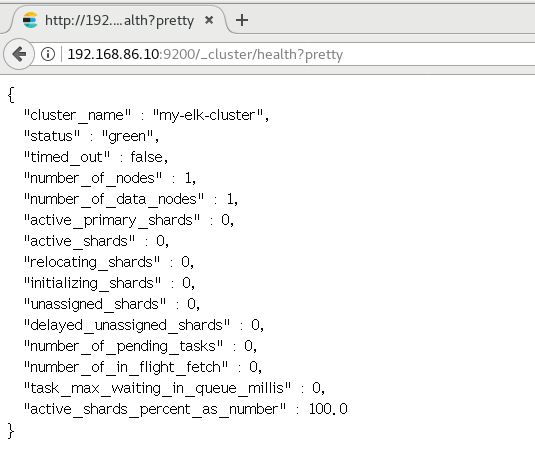
The real machine detects the cluster health and checks the cluster status
- Install the elasticsearch head plug-in
node1,node2
yum -y install gcc gcc-c++ make

cd /opt
rz node-v8.2.1.tar.gz
tar xzvf node-v8.2.1.tar.gz
cd node-v8.2.1/
./configure
make && make install
cd /usr/local/src
rz phantomjs-2.1.1-linux-x86_64.tar.bz2

tar xjvf phantomjs-2.1.1-linux-x86_64.tar.bz2


cd phantomjs-2.1.1-linux-x86_64/bin
cp phantomjs /usr/local/bin

cd /usr/local/src/
rz elasticsearch-head.tar.gz

tar xzvf elasticsearch-head.tar.gz
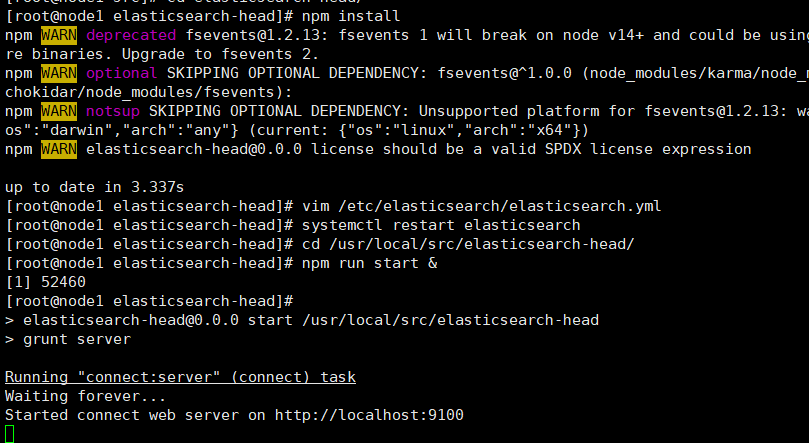
cd elasticsearch-head/
npm install

vim /etc/elasticsearch/elasticsearch.yml
==Last line insertion==
http.cors.enabled: true
http.cors.allow-origin: "*"

systemctl restart elasticsearch

cd /usr/local/src/elasticsearch-head/
npm run start &

netstat -lnupt |grep 9100
netstat -lnupt |grep 9200


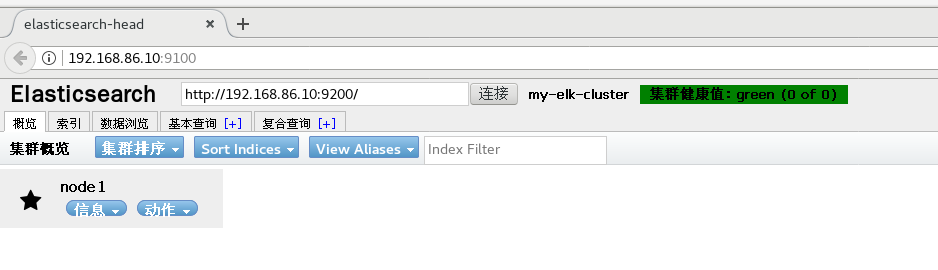
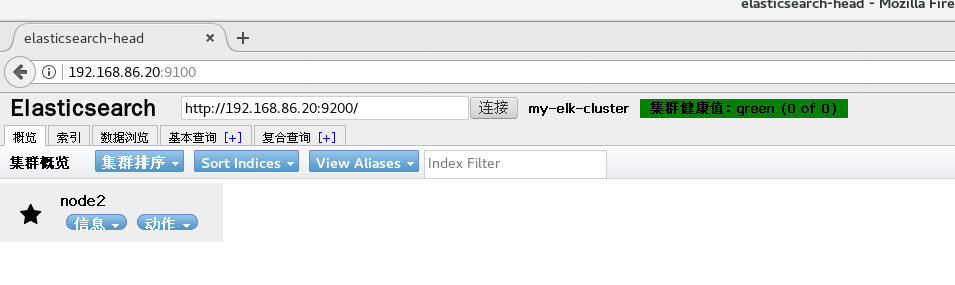
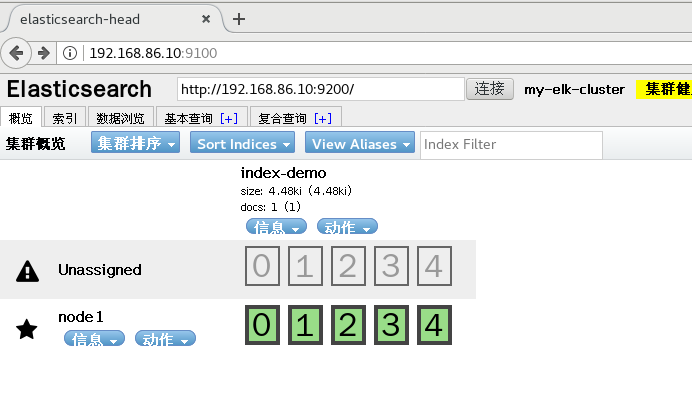
Open browser input on real machine
http://192.168.86.10:9100
http://192.168.86.20:9100
#Enter in the column after elastic search
http://192.168.86.10:9200
http://192.168.86.20:9200
node1
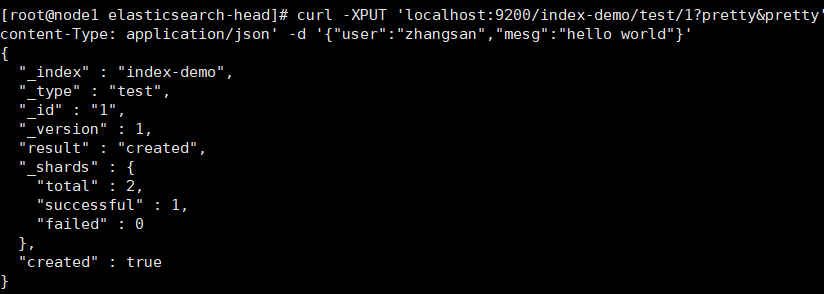
The index is index demo and the type is test. You can see the successful creation
curl -XPUT 'localhost:9200/index-demo/test/1?pretty&pretty' -H 'content-Type: application/json' -d '{"user":"zhangsan","mesg":"hello world"}'
Real machine access, view
- Install logstash
Install logstash and do some log collection and output it to elastic search
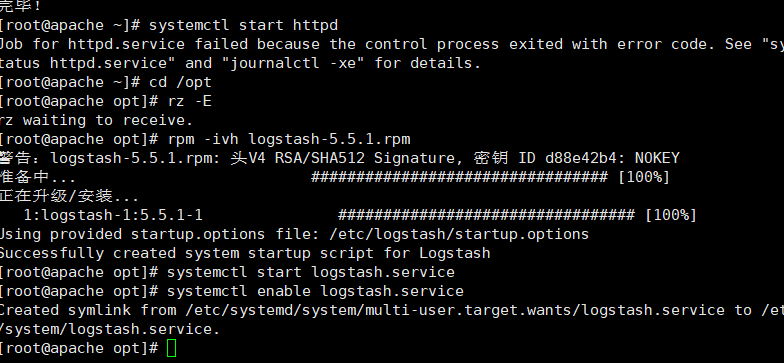
apache
yum -y install httpd
systemctl start httpd

cd /opt
rz logstash-5.5.1.rpm

rpm -ivh logstash-5.5.1.rpm

systemctl start logstash.service
systemctl enable logstash.service
ln -s /usr/share/logstash/bin/logstash /usr/local/bin/
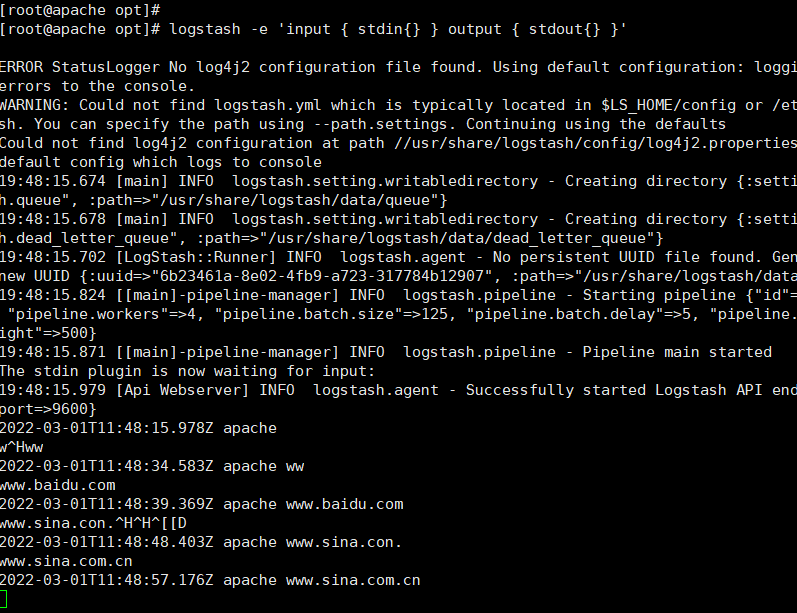
logstash -e 'input { stdin{} } output { stdout{} }'
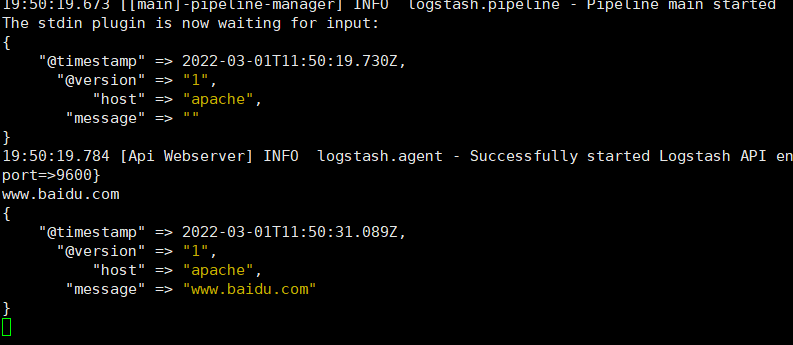
logstash -e 'input { stdin{} } output { stdout{ codec=>rubydebug } }'

Logstash API endpoint {:port=>9600}
[root@apache opt]# logstash -e 'input { stdin{} } output { elasticsearch { hosts=>["192.168.86.10:9200"] } }'

Logstash API endpoint {:port=>9600}
www.baidu.com                     ###Input content
www.sina.com.cn                   ###Input content
www.google.com.cn                 ###Input content
Ctrl c
Real machine access to view index information
2. apache docking configuration
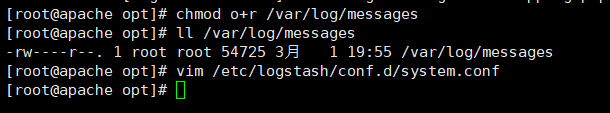
chmod o+r /var/log/messages
ll /var/log/messages
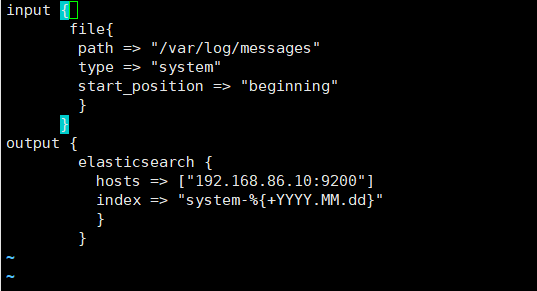
vim /etc/logstash/conf.d/system.conf
input {
file{
path => "/var/log/messages"
type => "system"
start_position => "beginning"
}
}
output {
elasticsearch {
hosts => ["192.168.86.10:9200"]
index => "system-%{+YYYY.MM.dd}"
}
}
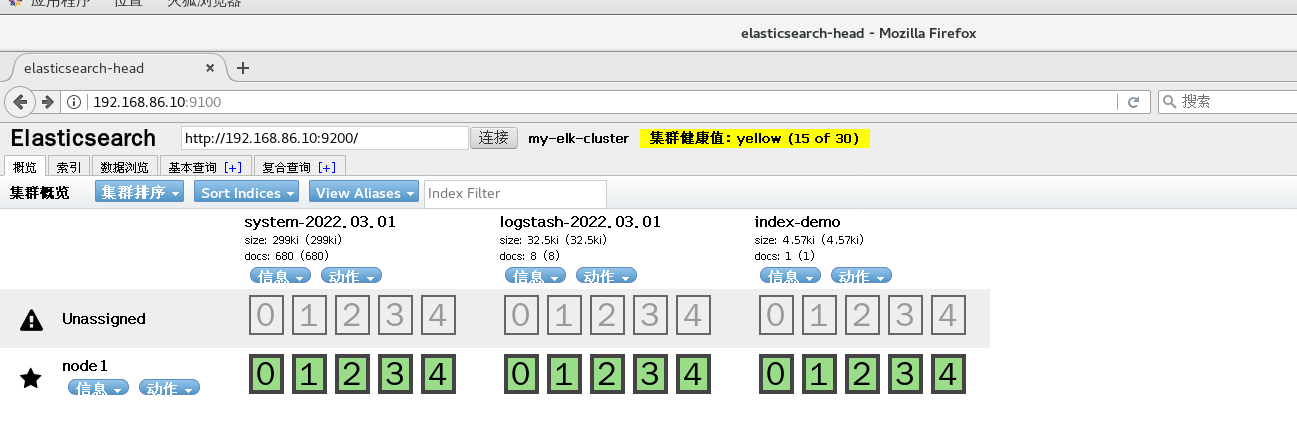
Real machine view index information
- Install kibana on node1 host
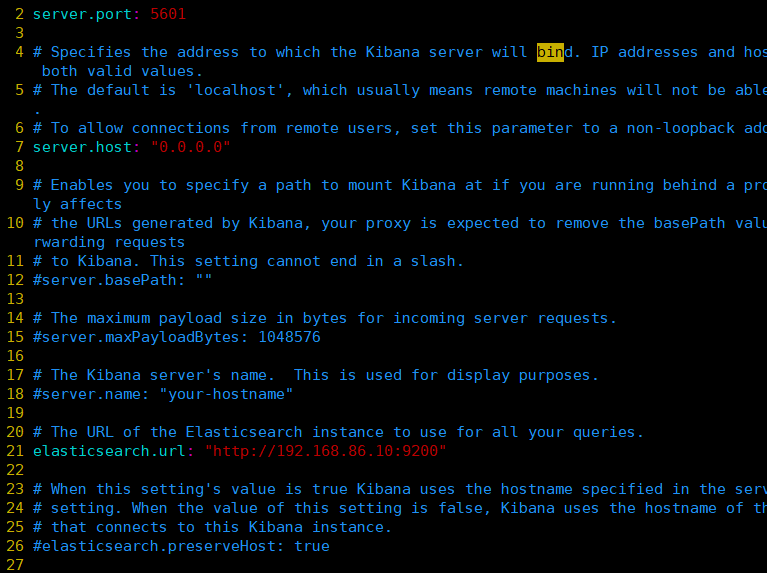
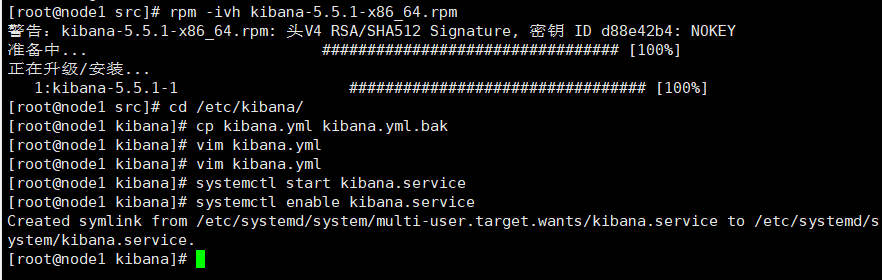
cd /usr/local/src/
rz kibana-5.5.1-x86_64.rpm

rpm -ivh kibana-5.5.1-x86_64.rpm

cd /etc/kibana/
cp kibana.yml kibana.yml.bak

vim kibana.yml
2/ server.port: 5601               		 				#kibana open port
7/ server.host: "0.0.0.0"          						#Address where kibana listens
21/ elasticsearch.url: "http://192.168.184.10:9200 "# establish contact with elasticsearch
30/ kibana.index: ".kibana"              				#Add in elasticsearch kibana index

systemctl start kibana.service
systemctl enable kibana.service
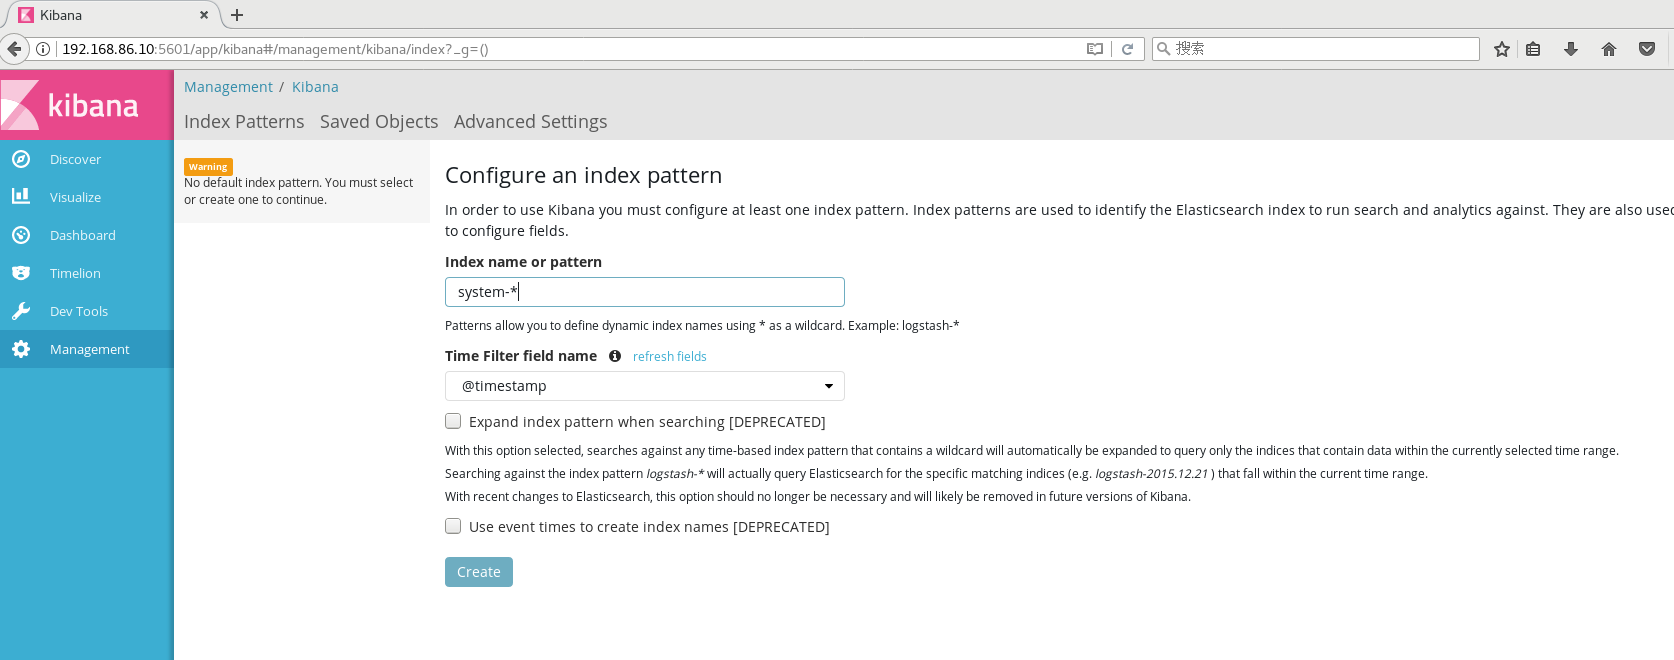
Real machine access
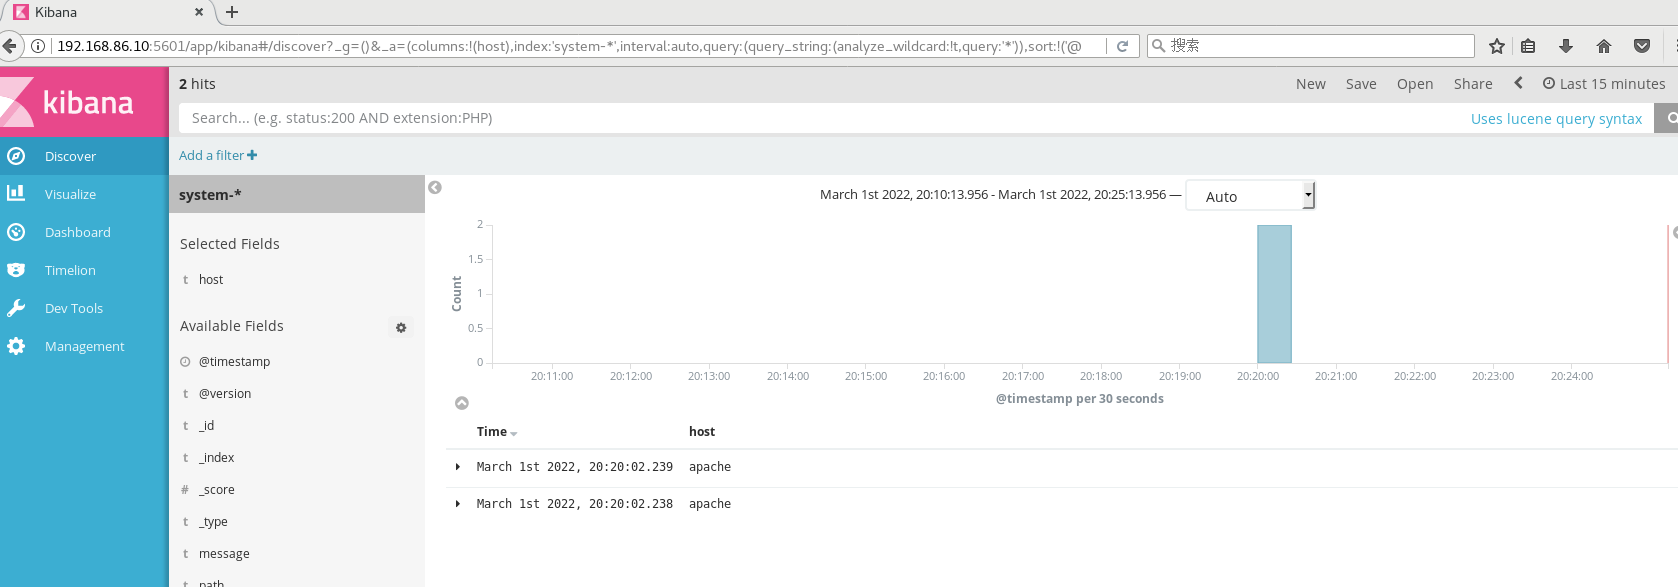
192.168.86.10:5601
#Create an index name for the first login: System - * this is the docking system log file
#Then click the Create button at the bottom to create
#Then click the Discover button in the top left corner to find the system - * information
#Then click add next to the host below, and you will find that the figure on the right has only Time and host options, which is more friendly