Log system
scene
- In general, we need to do log analysis scenarios: directly in the log file, grep and awk can get the information they want. However, in large-scale scenarios, this method is inefficient, facing problems such as how to archive too much logs, how to do too slow text search, and how to multi-dimensional query. Centralized log management is required, and logs on all servers are collected and summarized. The common solution is to establish a centralized log collection system to collect, manage and access the logs on all nodes.
- Large system is a distributed deployment architecture. Different service modules are deployed on different servers. When problems occur, most situations need to locate specific servers and service modules according to the key information exposed by the problems, and build a centralized log system, which can improve the efficiency of positioning problems.
- Analyze a large number of log business data, such as platform PV, UV, IP, PageTOP and other dimensions. In addition, security audit, data mining, behavior analysis and so on are all supported by logs.
effect
- Information search: search log information, locate corresponding bug s, and find solutions.
- Service diagnosis: through the statistics and analysis of log information, we can understand the server load and service running status, find out the time-consuming requests for optimization, etc.
- Data analysis: if it is a formatted log, further data analysis can be done, and meaningful information can be calculated and aggregated. For example, according to the commodity id in the request, the products of interest to top 10 users can be found
framework
There are three basic components of the log system:
- Collection end: agent (collect log source data, encapsulate data source, and send data from data source to collector)
- Aggregation end: collector (to process data according to certain rules, receive data from multiple agent s, summarize and import it into the back-end store)
- Storage side: store (log storage system, which should have scalability and reliability, such as HDFS ES, etc.)
Common solutions
ELF/EFK
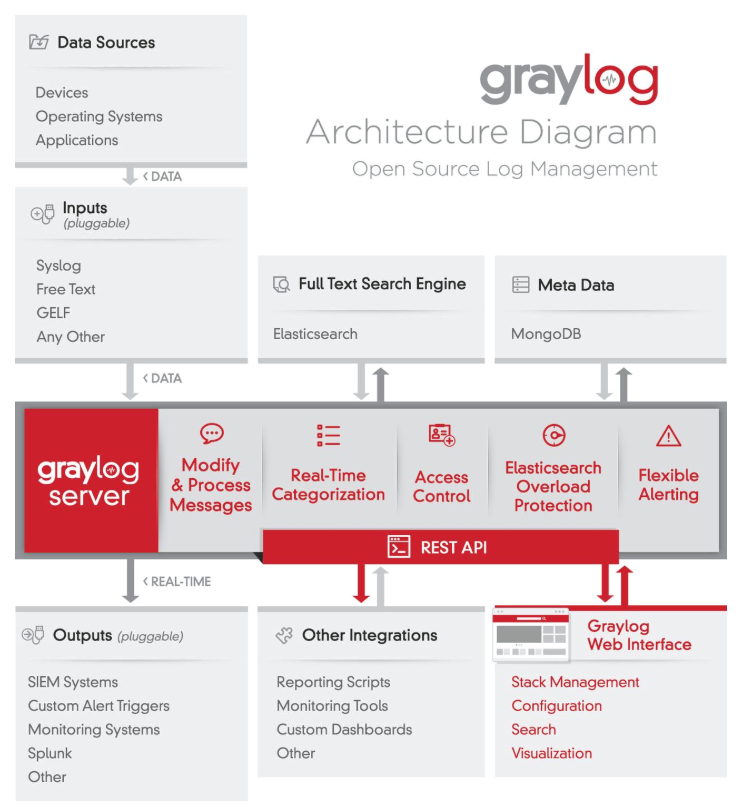
graylog
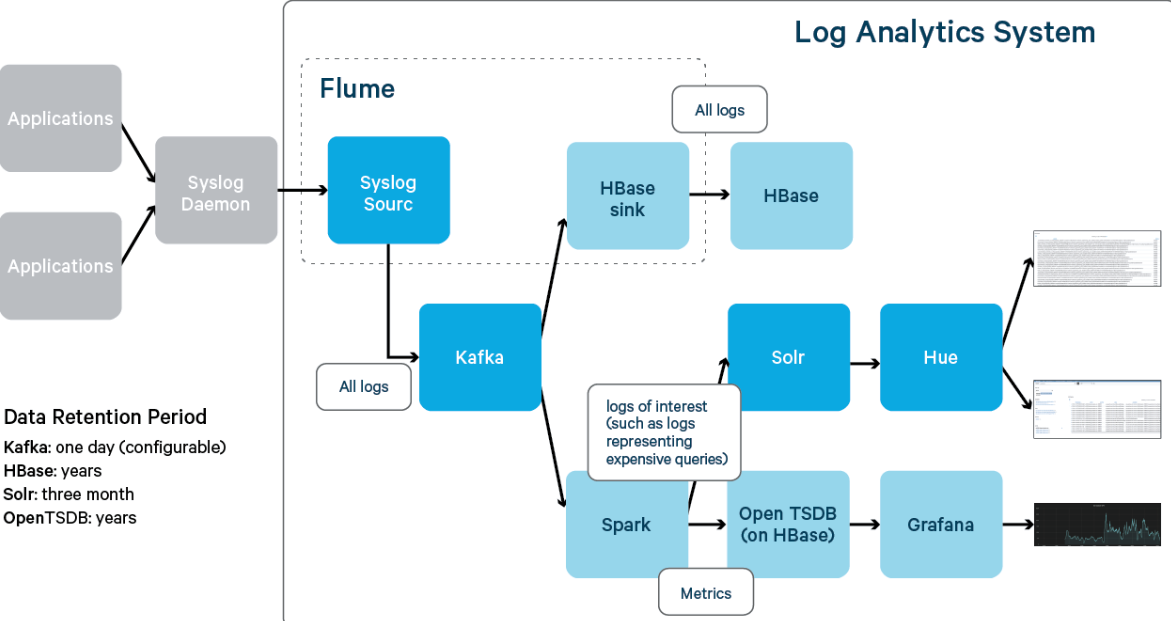
Flow analysis
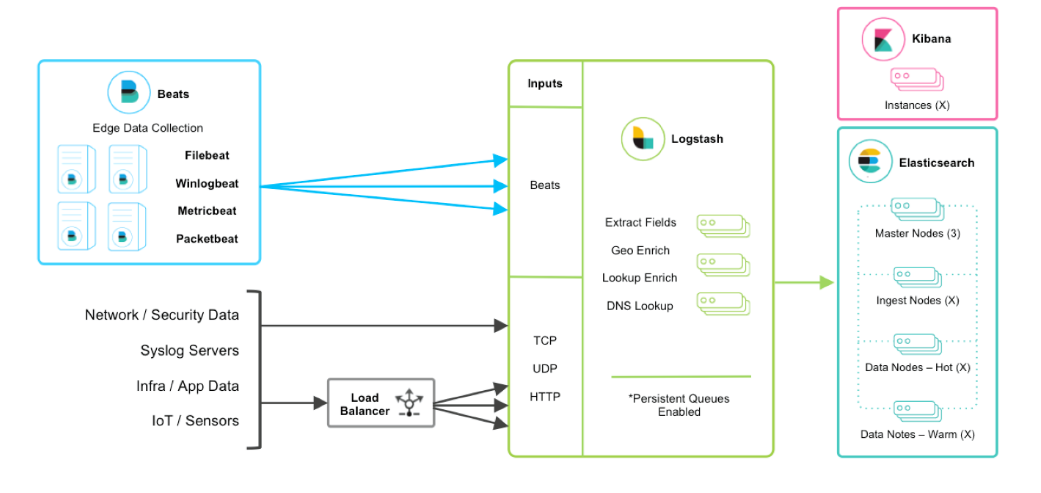
ELK scheme
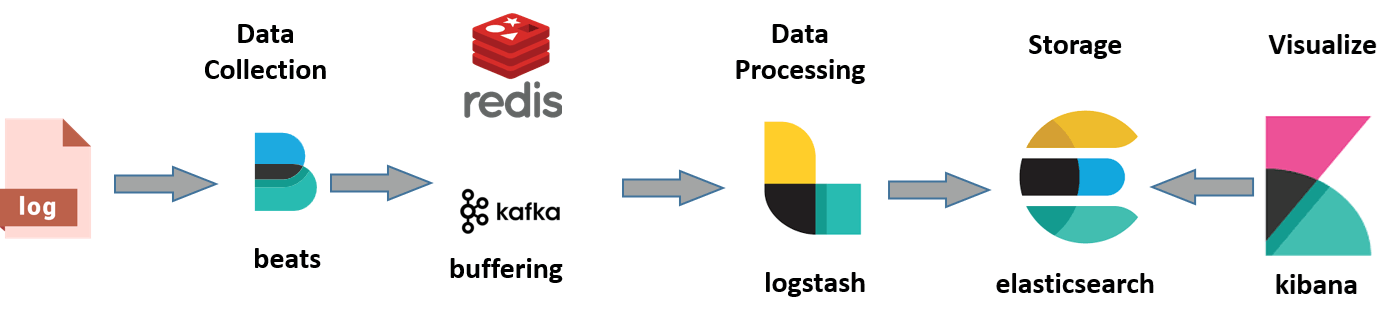
assembly
- Elasticsearch log storage and search engine, its characteristics are: distributed, zero configuration, automatic discovery, index automatic segmentation, index copy mechanism, restful style interface, multiple data sources, automatic search load, etc.
- Logstash is a fully open-source tool, which can collect and filter your logs and store them for later use (it supports dynamic data collection from various data sources and data filtering, analysis, enrichment, unified format and other operations).
- Kibana is also an open-source and free tool. Kibana can provide a log analysis friendly Web interface for Logstash and ElasticSearch, which can help you summarize, analyze and search important data logs.
- Filebeat: like Logstash, it is a log collection and processing tool, which is based on the original Logstash fowarder source code. Compared with Logstash, filebeat is lighter and consumes less resources
technological process
AppServer > logstash > elasticsearch > kibana > Browser
Log stash collects logs generated by AppServer and stores them in the ElasticSearch cluster, while Kibana queries data from the ElasticSearch cluster to generate a chart and then returns it to Browser.
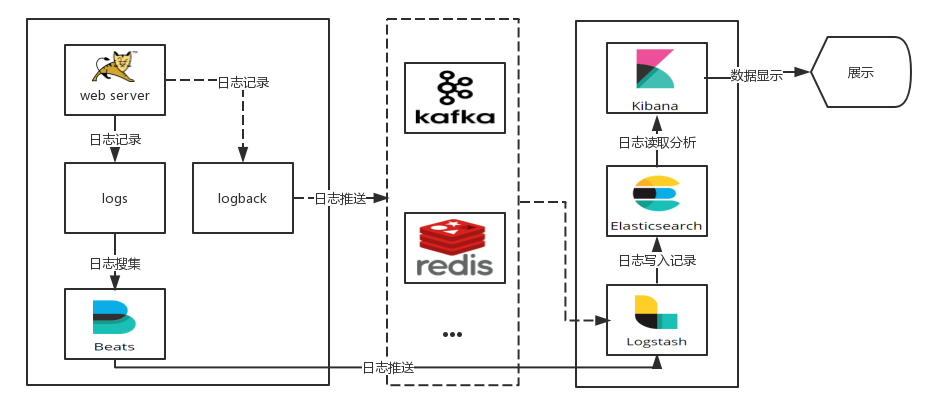
Considering the load problem of the aggregation end (log processing, cleaning, etc.) and the transmission efficiency of the collection end, queues are usually added at the collection end and the aggregation end when the amount of logs is large, so as to realize the peak cancellation of logs.
ELK log process can have many schemes (different components can be combined freely, according to their own business configuration). The common schemes are as follows:
- Logstash (acquisition, processing) - > elasticsearch (storage) - > kibana (display)
- Logstash (Collection) - > logstash (aggregation, processing) - > elasticsearch (storage) - > kibana (display)
- Filebeat (collection, processing) - > elasticsearch (storage) - > kibana (display)
- Filebeat (Collection) - > logstash (aggregation, processing) - > elasticsearch (storage) - > kibana (display)
- Filebeat (Collection) - > Kafka / redis (peak elimination) - > logstash (aggregation, processing) - > elasticsearch (storage) - > kibana (display)
deploy
Overall planning of server
| host | role |
|---|---|
| Host 1 | elasticsearch |
| Host 2 | kibana,zookeeper,kafka |
| Host 3 | logstash |
| Host 4 | nginx,filebeat |
jdk configuration
[root@localhost ~]# tar -zxf jdk-8u201-linux-x64.tar.gz -C /usr/local/
[root@localhost ~]# ls /usr/local/
bin  etc  games  include  jdk1.8.0_201  lib  lib64  libexec  sbin  share  src
[root@localhost ~]# Add content at the end of vim /etc/profile
export JAVA_HOME=/usr/local/jdk1.8.0_201
export JRE_HOME=/usr/local/jdk1.8.0_201/jre
export CLASSPATH=$JAVA_HOME/lib/tools.jar:$JAVA_HOME/lib/dt.jar
export PATH=$JAVA_HOME/bin:$JRE_HOME/bin:$PATH
[root@localhost ~]# source /etc/profile
[root@localhost ~]# java -version
java version "1.8.0_201"
Java(TM) SE Runtime Environment (build 1.8.0_201-b09)
Java HotSpot(TM) 64-Bit Server VM (build 25.201-b09, mixed mode)
Elastic search deployment
[root@localhost ~]# wget https://artifacts.elastic.co/downloads/elasticsearch/elasticsearch-6.3.2.tar.gz
[root@localhost ~]# tar -zxf elasticsearch-6.3.2.tar.gz -C /usr/local/
[root@localhost ~]# ln -s /usr/local/elasticsearch-6.3.2/ /usr/local/es
[root@localhost ~]# chown -R es:es /usr/local/es/
mkdir -p /es/{data,log}
groupadd es
useradd es -g es -p es
chown -R es:es /es/data
chown -R es:es /es/log
Modify system parameters
echo '* soft nofile 819200' >> /etc/security/limits.conf
echo '* hard nofile 819200' >> /etc/security/limits.conf
echo '* soft nproc 2048' >> /etc/security/limits.conf
echo '* hard nproc 4096' >> /etc/security/limits.conf
echo '* soft memlock unlimited' >> /etc/security/limits.conf
echo '* hard memlock unlimited' >> /etc/security/limits.conf
echo 'vm.max_map_count=655360' >> /etc/sysctl.conf
sysctl -p
es parameter setting
vim /usr/local/es/config/elasticsearch.yml
cluster.name: bdqn
node.name: es
node.master: true
node.data: true
path.data: /es/data
path.logs: /es/log
network.host: 0.0.0.0
http.port: 9200
discovery.zen.minimum_master_nodes: 1
bootstrap.memory_lock: false
bootstrap.system_call_filter: false #These two lines are written together
In the configuration file, except for the above modification items, others are annotation items. If the last item is true, some system calls of es will be restricted, which may cause es startup failure
Seccomp (full name: secure computing mode) is a security mechanism supported by Linux kernel since version 2.6.23. In Linux system, a large number of system calls are directly exposed to user state programs. However, not all system calls are needed, and unsafe code abuse of system calls will pose a security threat to the system. Through seccomp, we restrict the program to use some system calls, which can reduce the exposure of the system and make the program enter a "safe" state.
#Modify jvm parameters reasonably according to machine configuration

vim /usr/local/es/config/jvm.options
-Xms1g
-Xmx1g
es control
[root@es1 ~]# su es
[es@es1 root]$ /usr/local/es/bin/elasticsearch -d
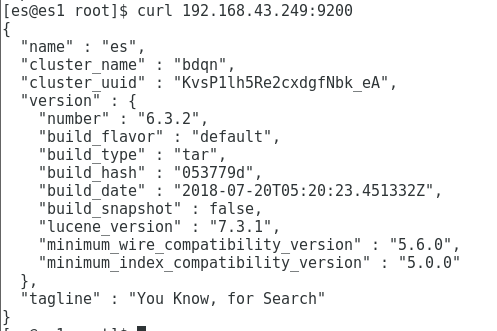
[es@es1 root]$ curl 192.168.43.249:9200
{
"name" : "es",
"cluster_name" : "bdqn",
"cluster_uuid" : "KvsP1lh5Re2cxdgfNbk_eA",
"version" : {
"number" : "6.3.2",
"build_flavor" : "default",
"build_type" : "tar",
"build_hash" : "053779d",
"build_date" : "2018-07-20T05:20:23.451332Z",
"build_snapshot" : false,
"lucene_version" : "7.3.1",
"minimum_wire_compatibility_version" : "5.6.0",
"minimum_index_compatibility_version" : "5.0.0"
},
"tagline" : "You Know, for Search"
}
[root@es1 ~]# iptables -F
kibana deployment
#  Download and install
wget https://artifacts.elastic.co/downloads/kibana/kibana-6.3.2-linux-x86_64.tar.gz
tar zxvf kibana-6.3.2-linux-x86_64.tar.gz  -C  /usr/local/
ln -s /usr/local/kibana-6.3.2-linux-x86_64/ /usr/local/kibana

# Configure kibana
vim /usr/local/kibana/config/kibana.yml

server.port: 5601
server.host: "0.0.0.0"
elasticsearch.url: "http://192.168.43.249:9200"

#Start kibana
/usr/local/kibana/bin/kibana
kafka deployment
Deploy zookeeper
wget http://archive.apache.org/dist/zookeeper/zookeeper-3.4.12/zookeeper-3.4.12.tar.gz
tar zxvf zookeeper-3.4.12.tar.gz -C /usr/local
cd /usr/local/zookeeper-3.4.12
cp conf/zoo_sample.cfg conf/zoo.cfg

# edit zoo.cfg file
vim /usr/local/zookeeper-3.4.12/conf/zoo.cfg
tickTime=2000
initLimit=10
syncLimit=5
dataDir=/data/zookeeper/zkdata
dataLogDir=/data/zookeeper/zkdatalog
clientPort=2181

#Create directory
mkdir -p /data/zookeeper/{zkdata,zkdatalog}

#Configure ZK node ID
echo 1  > /data/zookeeper/zkdata/myid

 #start-up
/usr/local/zookeeper-3.4.12/bin/zkServer.sh start

#stop it
/usr/local/zookeeper-3.4.12/bin/zkServer.sh stop

#View status
/usr/local/zookeeper-3.4.12/bin/zkServer.sh status
kafka deployment
#Download the latest version 2.12-2.1
wget http://mirrors.hust.edu.cn/apache/kafka/2.1.0/kafka_2.12-2.1.0.tgz

#Extract and apply to the specified location
tar zxvf kafka_2.12-2.1.0.tgz  -C /usr/local/
ln -s /usr/local/kafka_2.12-2.1.0/ /usr/local/kafka


# vim  /usr/local/kafka/config/server.properties
broker.id=2
listeners = PLAINTEXT://192.168.43.74:9092 ×
num.network.threads=5
num.io.threads=8
socket.send.buffer.bytes=102400
socket.receive.buffer.bytes=102400
socket.request.max.bytes=104857600
log.dirs=/data/kafka/kfdata
delete.topic.enable=true #newly added
num.partitions=2
num.recovery.threads.per.data.dir=1
offsets.topic.replication.factor=1
transaction.state.log.replication.factor=1
transaction.state.log.min.isr=1
log.flush.interval.messages=10000 #note off
log.flush.interval.ms=1000 #note off
log.retention.hours=72
log.segment.bytes=1073741824
log.retention.check.interval.ms=300000
zookeeper.connect=192.168.43.74:2181
zookeeper.connection.timeout.ms=6000
group.initial.rebalance.delay.ms=0
kafka management
#Start service:
/usr/local/kafka/bin/kafka-server-start.sh -daemon /usr/local/kafka/config/server.properties
#Out of Service:
/usr/local/kafka/bin/kafka-server-stop.sh
kafka queue
Create topic
/usr/local/kafka/bin/kafka-topics.sh --create \
--zookeeper 192.168.43.74:2181 \
--replication-factor 1 --partitions 2 \
--topic elktest
View kafka queues
/usr/local/kafka/bin/kafka-topics.sh --zookeeper 192.168.43.74:2181 --topic "elktest" --describe
kafka communication verification
Production message
/usr/local/kafka/bin/kafka-console-producer.sh --broker-list 192.168.43.74:9092 --topic elktest
Enter hello at the command prompt, enter
Consumer News
/usr/local/kafka_2.12-2.1.0/bin/kafka-console-consumer.sh --bootstrap-server 192.168.43.74:9092 --topic elktest --from-beginning
After entering the command, you can see the information just entered, as shown in the following figure
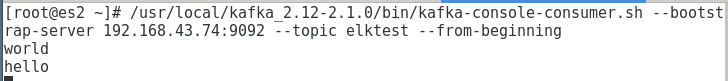
After verification, you can exit both terminals
filebeat deployment
working principle
In any environment, applications have the potential to shut down. Filebeat reads and forwards log lines, and if interrupted, remembers where all events are when they are back online.
Filebeat has internal modules (audit, Apache, Nginx, System and MySQL), which can simplify the collection, analysis and visualization of general log format through a specified command.
FileBeat won't overload your pipes. If FileBeat transfers data to Logstash, when Logstash is busy processing data, it will notify FileBeat to slow down the reading speed. Once the congestion is resolved, the FileBeat will return to its original speed and continue to propagate.
Filebeat maintains the state of each file and frequently refreshes the disk state in the registry file. The status is used to remember the last offset that the harvester is reading and ensure that all log lines are sent. Filebeat stores the delivery status of each event in a registry file. Therefore, it can ensure that the event is delivered to the configured output at least once without data loss.
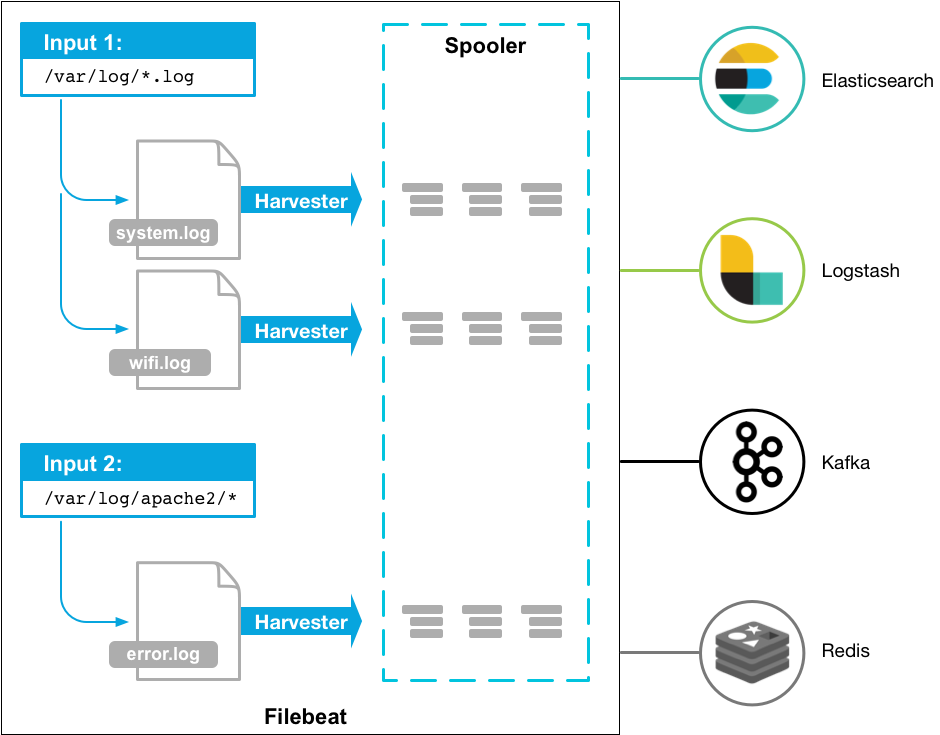
Filebeat has two main components:
-
Harvester: a harvester is responsible for reading the contents of a single file. Harvester reads each file line by line and sends that content to the output. Start a harvester for each file. The harvester is responsible for opening and closing the file, which means that the file descriptor remains open when the harvester runs. When the harvester is reading the contents of the file, the file is deleted or renamed, then the Filebeat will continue to read the file. There is a problem. As long as the harvester responsible for this file is not closed, the disk space will not be released. By default, Filebeat saves the file open until it is closed_ Inactive arrived.
-
Input: an input manages the harvesters and finds all sources to read. If the input type is log, input looks for all files on the drive that match the glob path that has been defined, and starts a harvester for each file.
Installation configuration
https://artifacts.elastic.co/downloads/beats/filebeat/filebeat-6.3.2-linux-x86_64.tar.gz

tar zxvf filebeat-6.3.2-linux-x86_64.tar.gz -C /usr/local/
ln -s /usr/local/filebeat-6.3.2-linux-x86_64/ /usr/local/filebeat

You need to configure it before you start it. Now, you don't need to configure it, and the next startup command doesn't execute it

start-up
/usr/local/filebeat/filebeat -c  /usr/local/filebeat/filebeat.yml
parameter
- input parameter
  paths
        paths specifies the log to monitor

    encoding
        Code of the file, where plain does not verify or convert any input

    exclude_lines
        A set of regular expressions that match the rows you want to include. Filebeat only exports rows that match this set of regular expressions. By default, all rows are exported. Blank line ignored

    include_lines
        A set of regular expressions that match the rows you want to include. Filebeat only exports rows that match this set of regular expressions. By default, all rows are exported. Blank lines are ignored.

    harvester_buffer-size
        The number of bytes of buffer used by each harvester when grabbing a file. 16384 by default

    max_bytes
        The maximum number of bytes allowed for a single log message. Over max_bytes will be discarded and will not be sent. This setting is useful for multiline log messages because they tend to be large. The default is 10MB (10485760)

    json
        Option to enable Filebeat to parse the log as a JSON message

    multiline
        Control how Filebeat expands multiline processing log messages

    exclude_files
        A set of regular expressions that match the files you want to ignore. No files are excluded by default

    ignore_older
        Specify Filebeat to ignore the log content modified outside the specified time period, such as 2h, 2 hours or 5m(5 minutes)

    scan_frequency
        Specify the inspection frequency and how often to check the new files in the specified path
- Multiline multiline parameters
    multiline.pattern
        Specifies a regular expression to match multiple lines

    multiline.negate
        Defines whether a pattern is negated. The default is false.

    multiline.match
        Specifies how Filebeat merges multiple rows into one event. The optional values are after or before.

    multiline.max_lines
        The maximum number of rows that can be combined into an event. If a multiline message contains more than max lines_ Lines, more than lines are discarded. The default is 500.
- output parameter
 enabled
        Enable or disable the output. Default true

    host
        List of nodes. Events are sent to these nodes in circular order. If one node becomes inaccessible, it is automatically sent to the next node. Each node can be in the form of URL or IP:PORT

    username
        User name for authentication

    password
        Password for user authentication

    protocol
        The optional values are: http or https. The default is http

    headers
        Add custom HTTP headers to each request output

    index
        Index name, to which index

    timeout
        Request timeout. The default is 90 seconds.
Transmission scheme
- output.elasticsearch
If you want to use filebeat to output data directly to elastic search, you need to configure output.elasticsearch
output.elasticsearch:
  hosts: ["192.168.43.249:9200"]
- output.logstash
If you use FileBeat to output data to logstash, then logstash to output data to elastic search, you need to configure output.logstash . When logstash and FileBeat work together, if logstash is busy processing data, it will notify FileBeat to slow down the reading speed. Once the congestion is resolved, the FileBeat will return to its original speed and continue to propagate. In this way, the pipeline overload can be reduced.
output.logstash:
  hosts: ["192.168.199.5:5044"]  #logstaship
- output.kafka
If you use filebeat to output data to kafka, then logstash as the consumer pulls the logs in kafka, and then outputs data to elastic search, you need to configure output.logstash
output.kafka:
  enabled: true
  hosts: ["192.168.43.74:9092"]
  topic: elktest
logstash deployment
working principle
Logstash has two necessary elements: input and output, and an optional element: filter. These three elements represent the three stages of logstash event processing: input > Filter > output
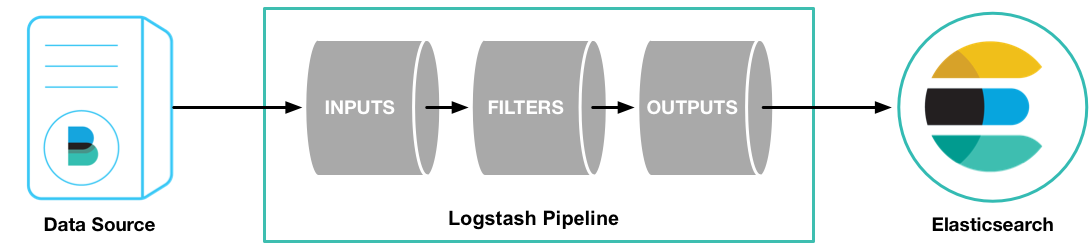
- Collect data from data source.
- filter changes the data to the format or content you specify.
- output transfers data to the destination.
In practical application scenarios, there are usually more than one input, output and filter. These three elements of Logstash use plug-in management mode, which can flexibly select plug-ins needed in each stage according to application needs, and use them in combination.
configuration file
- logstash.yml : the default configuration file of logstash, such as node.name , path.data , pipeline.workers , queue.type The configuration can be overridden by the relevant parameters in the command line parameters
- jvm.options : JVM configuration file for logstash.
- startup.options (Linux): contains the options used by the system installation script in / usr/share/logstash/bin to build the appropriate startup script for your system. When installing the Logstash package, the system installation script will execute at the end of the installation process, and use the startup.options To set options for users, groups, service names, and service descriptions.
- pipelines.yml : file defining data processing flow
input common modules
Logstash supports various input options and can capture events from many common sources at the same time. It can collect data from logs, indicators, Web applications, data storage and various AWS services in a continuous streaming mode.
- File: read from a file on the file system
- syslog: listen for system log messages on well-known port 514 and parse them according to RFC3164 format
- Redis: read from the redis server, and use the redis channel and redis list. Redis is often used as an "agent" in a centralized Logstash installation, which queues Logstash events received from remote Logstash "shippers.".
- beats: handles events sent by Filebeat.
Common filter modules
The filter is an intermediate processing device in the Logstash pipeline. You can combine condition filters to perform actions on events.
- Grok: parse and structure arbitrary text. Grok is currently the best way for Logstash to parse unstructured log data into structured and queryable data.
- mutate: performs a general conversion on an event field. You can rename, delete, replace, and modify fields in an event.
- drop: completely discards an event, such as a debug event.
- clone: make a copy of an event, which may add or remove fields.
- geoip: add information about the geographic location of the IP address
Common output
- Elastic search: sends event data to elastic search (recommended mode).
- File: writes event data to a file or disk.
- Graphite: send event data to graphite (a popular open source tool for storing and drawing metrics, http://graphite.readthedocs.io/en/latest/ ).
- Statsd: sends event data to statsd (a service that listens for statistics, such as counters and timers, sent over UDP and aggregates to one or more pluggable back-end services).
Common code plug-ins
- JSON: encode or decode data in JSON format.
- Multiline: combines multiline text events, such as java exceptions and stack trace messages, into a single event.
Transmission scheme
- Transfer to ES using beats:
input {
  beats {
    port => 5044 # This port needs to be connected with filebeat.yml  Same port in
  }
}


output {
  elasticsearch {
    hosts => "192.168.199.4:9200"
    manage_template => false
    index => "%{[@metadata][beat]}-%{[@metadata][version]}-%{+YYYY.MM.dd}"
    document_type => "%{[@metadata][type]}"
  }
}
- Read transfer from Kafka to ES:
input {
      kafka {
        bootstrap_servers => "192.168.199.6:9092"
        auto_offset_reset => "latest"
        consumer_threads => 5
        decorate_events => true
        topics => ["elktest"]
      }
}

output {
    elasticsearch {
        hosts => ["192.168.199.4:9200"]
        index => "elktest-%{+YYYY.MM.dd}"
        }
}
Installation test
# Download and install
wget https://artifacts.elastic.co/downloads/logstash/logstash-6.3.2.tar.gz
tar zxvf logstash-6.3.2.tar.gz  -C /usr/local/
ln -s /usr/local/logstash-6.3.2/ /usr/local/logstash


vim /usr/local/logstash/config/logstash.yml
#Turn on profile autoload
config.reload.automatic: true

#Define profile overload time period
config.reload.interval: 10

#Define access host name, generally domain name or IP
http.host: "192.168.199.5"

#Profile directory
path.config: /usr/local/logstash/config/*.conf   #Note: there is a space between and /

#Log output path
path.logs: /var/log/logstash

#test(After typing in the command, enter any message)  #At present, there is no conf file. You can't type this command for the moment
/usr/local/logstash/bin/logstash -e  'input{stdin{}}output{stdout{}}'
use
Experiment 1
The key point of the experiment is to understand the coordination process of each component and learn the use of beats (filebeat s)
NginxLog ----> Filebeat —> Logstash —> ES —>Kibana
Node description
| host name | address | role | effect | edition |
|---|---|---|---|---|
| es | 192.168.43.249 | Elasticsearch | Log storage | elasticsearch-6.3.2 |
| logstash | 192.168.43.147 | Logstash | Log processing | Logstatsh-6.3.2 |
| zkk | 192.168.199.43.74 | Kibana | Log display | kibana-6.3.2 |
| app1 | 192.168.43.253 | Nginx,FileBeat | Log production, log collection | filebeat-6.3.2 |
Experimental premise
- ES install configuration and start
- Filebeat installation complete
- Logstash installation complete
- Kibana installation configuration complete
- Firewall opens related ports
- Disable selinux
Service configuration
- filebeat configuration
[root@es3 ~]# vim /usr/local/filebeat/filebeat.yml
#=========================== Filebeat inputs =============================

#filebeat.inputs:

# Each - is an input. Most options can be set at the input level, so
# you can use different inputs for various configurations.
# Below are the input specific configurations.
filebeat:
  prospectors:
    - type: log
      paths:
        - /usr/local/nginx/logs/access.log
      tags: ["nginx"]

  # Change to true to enable this input configuration.
  enabled: true

#----------------------------- Logstash output --------------------------------
output.logstash:
    hosts: ["192.168.43.147:5044"]

//There is an elastic search output above logstas output that needs to be commented out

#function
/usr/local/filebeat/filebeat -c  /usr/local/filebeat/filebeat.yml
- filebeat host installs nginx and starts
A brief history
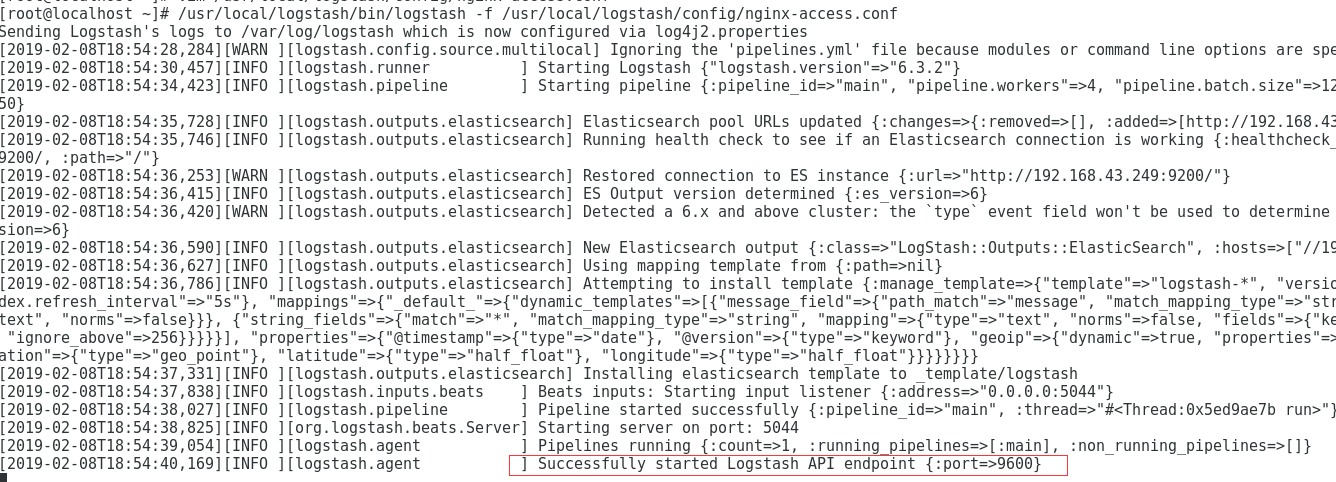
- logstash configuration
[root@localhost ~]# vim /usr/local/logstash/config/nginx-access.conf
input {
  beats {
    port => 5044
  }
}

output {
  elasticsearch {
        hosts => "192.168.43.249:9200"
        index => "nginx-%{+YYYY.MM.dd}"
  }
}

#function
/usr/local/logstash/bin/logstash -f /usr/local/logstash/config/nginx-access.conf
- kibana show
Accessing the local 5601 port on the kibana host
firefox 192.168.43.74:5601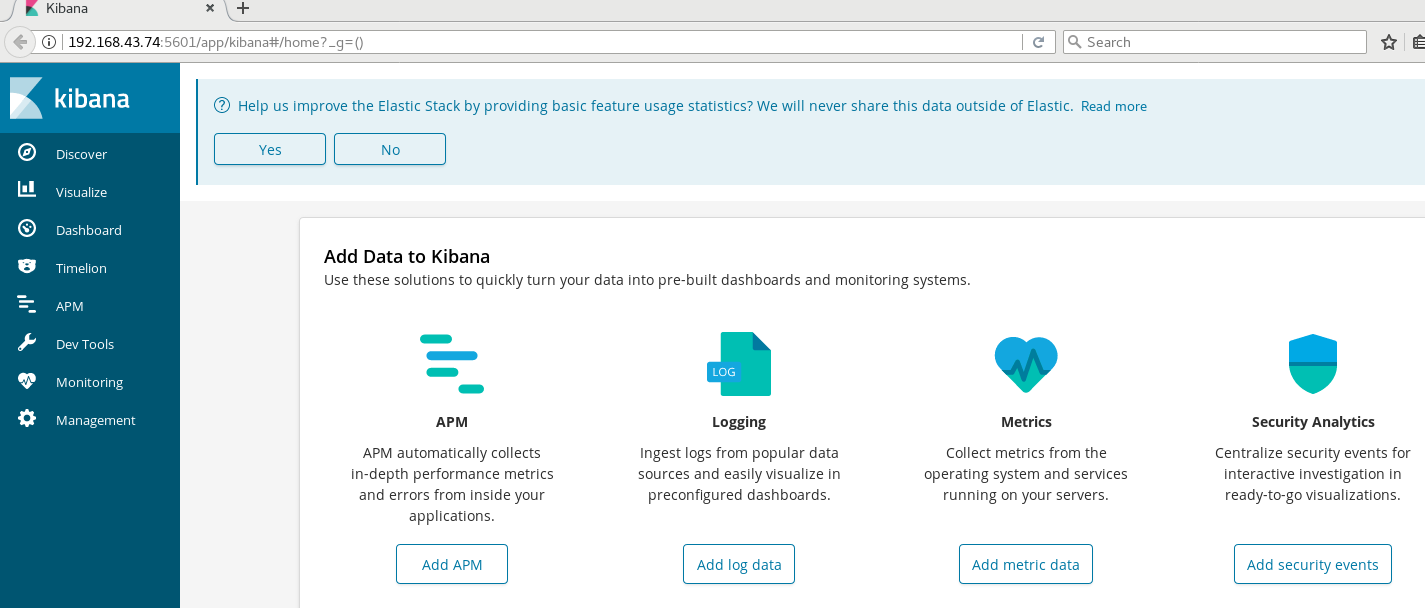
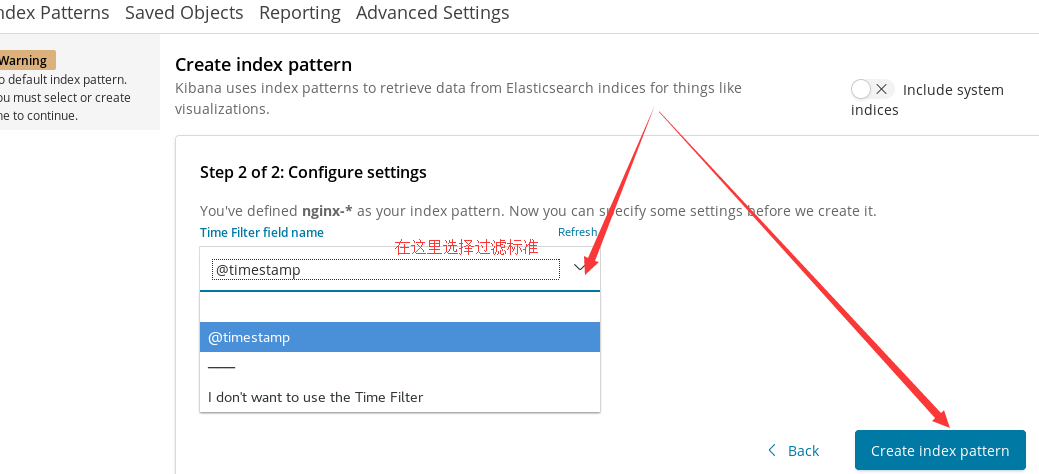
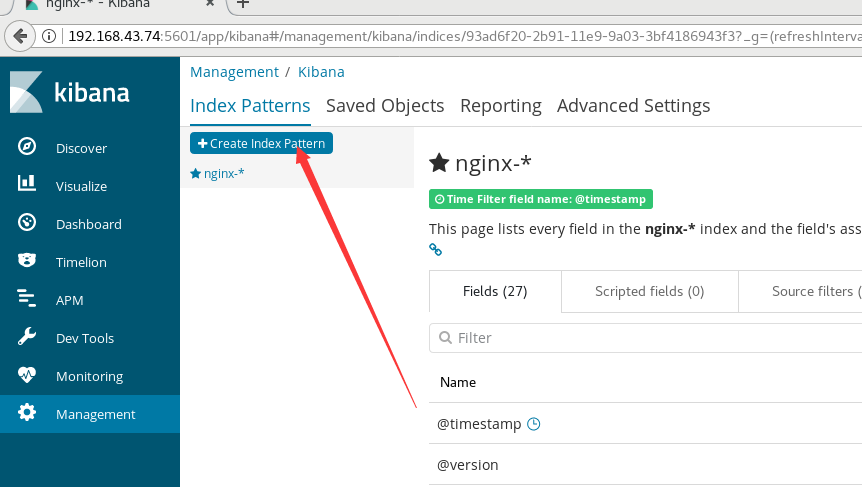
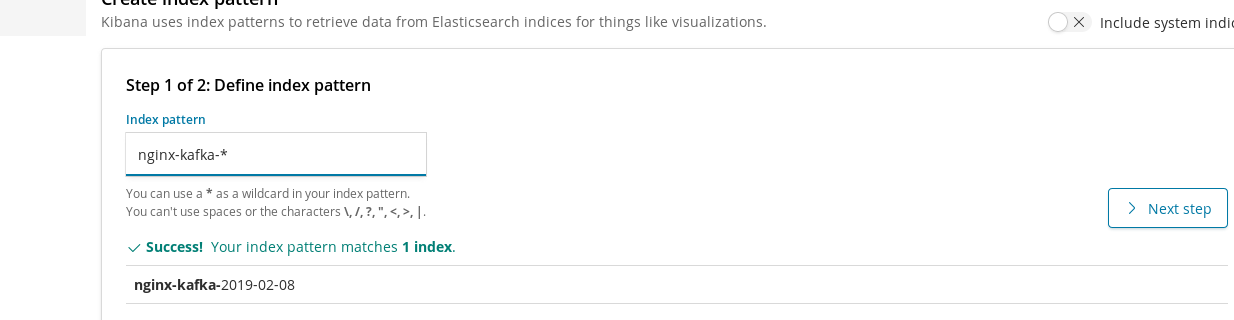
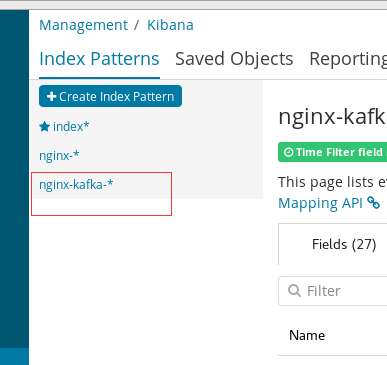
Click discover on the left menu and enter nginx - * as the index style in the input box of the new page, then click Next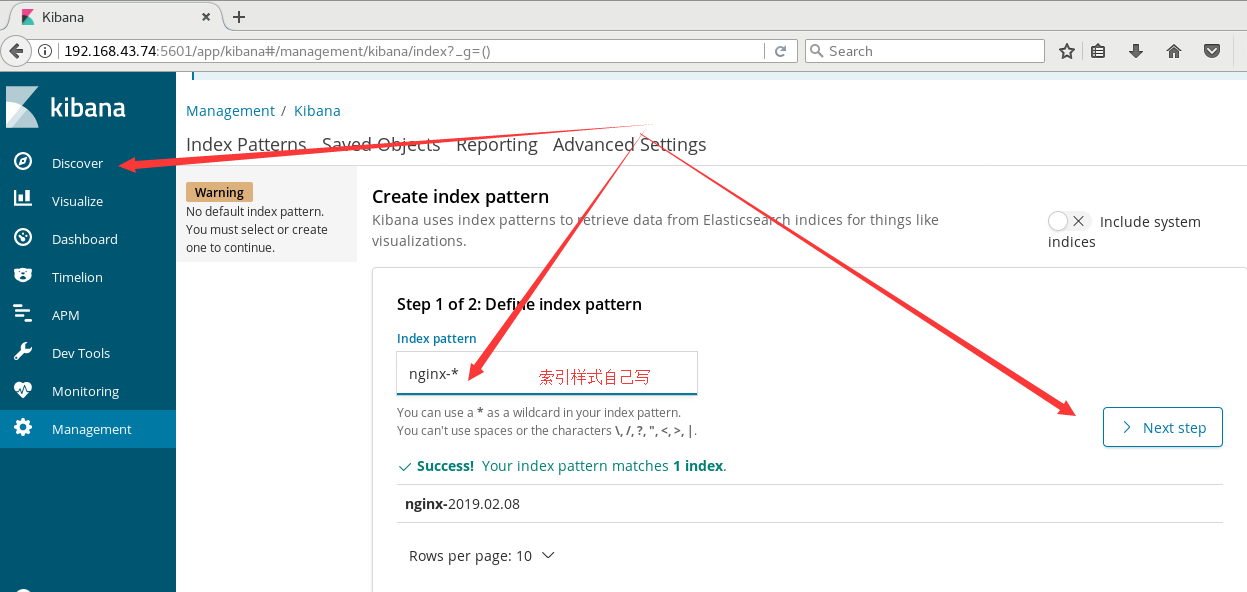
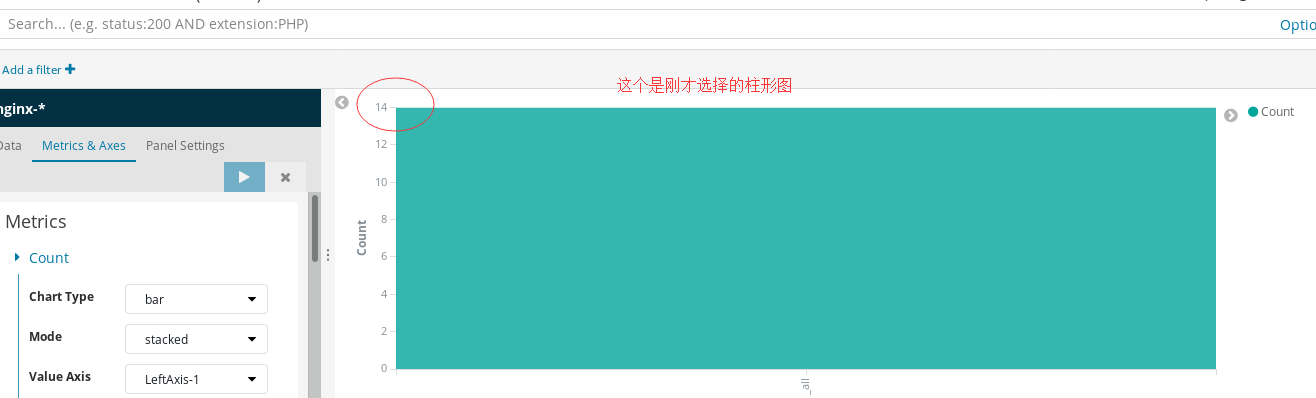
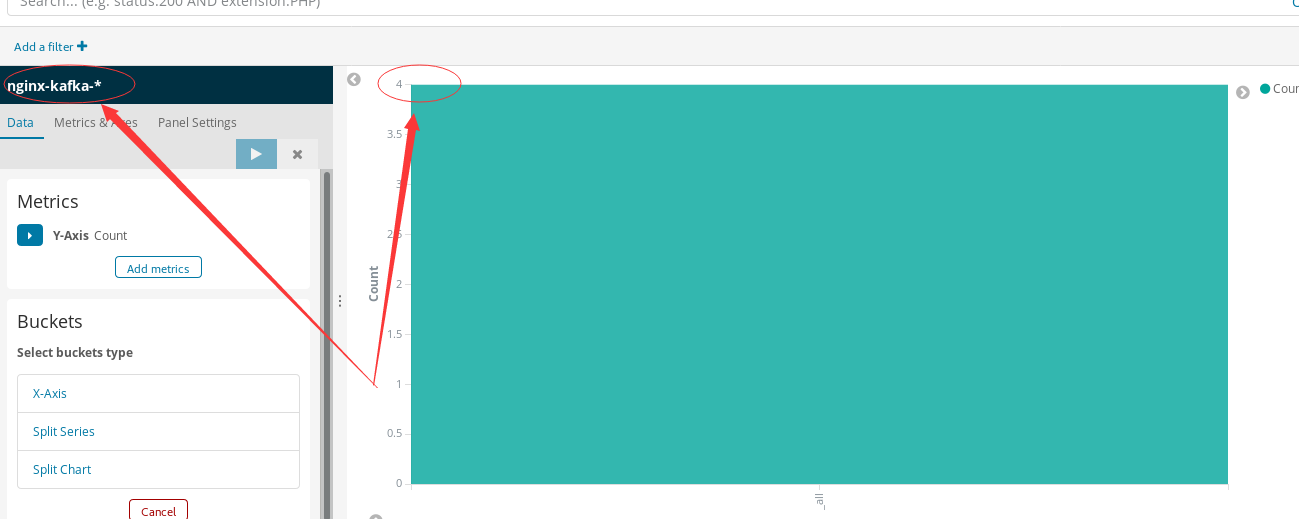
After adding the index, click the visualization in the left menu to create a visualization chart, and select the vertical bar in the new page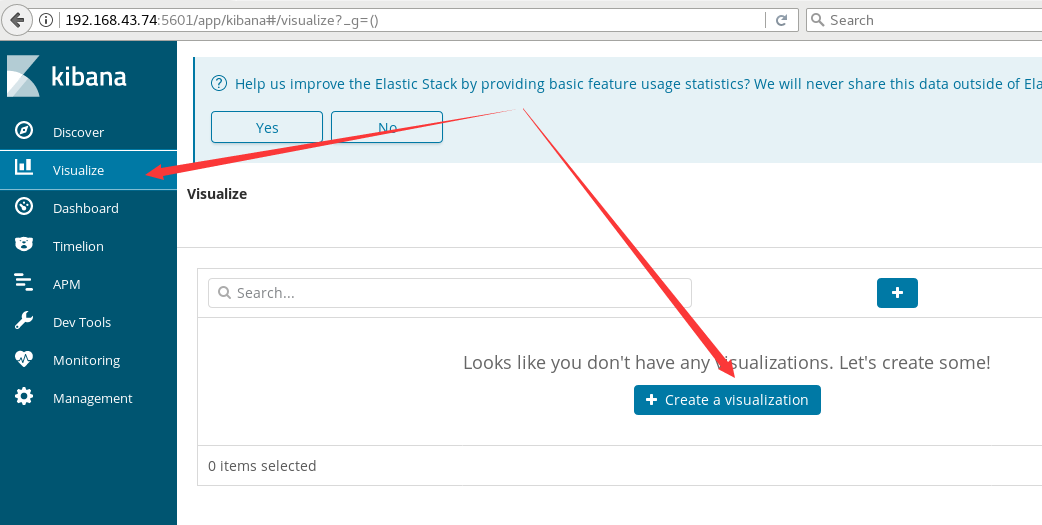
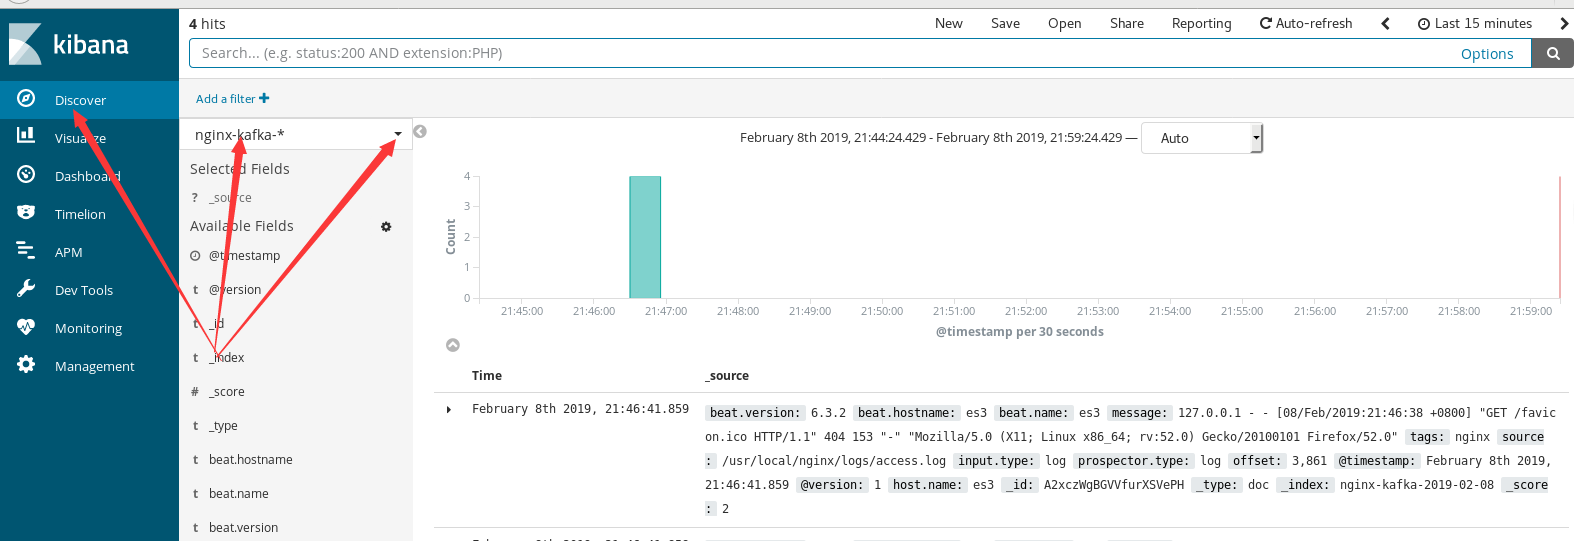
Select the index style we have created, and you can see the data. If it is not obvious, go to nginx and visit yourself several times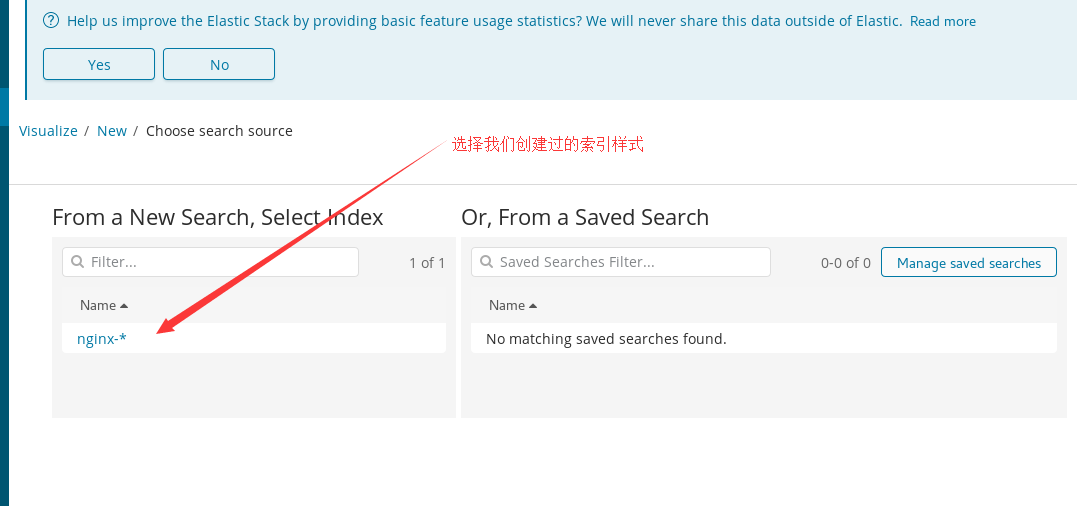
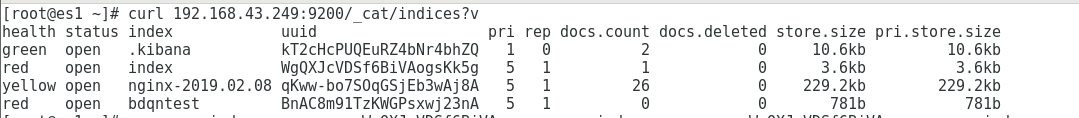
View index list on es for verification
[root@es1 ~]# curl 192.168.43.249:9200/_cat/indices?v
health status index            uuid                   pri rep docs.count docs.deleted store.size pri.store.size
green  open   .kibana          kT2cHcPUQEuRZ4bNr4bhZQ   1   0          2            0     10.6kb         10.6kb
red    open   index            WgQXJcVDSf6BiVAogsKk5g   5   1          1            0      3.6kb          3.6kb
yellow open   nginx-2019.02.08 qKww-bo7SOqGSjEb3wAj8A   5   1         26            0    229.2kb        229.2kb
red    open   bdqntest         BnAC8m91TzKWGPsxwj23nA   5   1          0            0       781b           781b
Experiment 2
The focus of the experiment is to understand the coordination process of each component and the architecture after joining the message queue
NginxLog —> Filebeat —> Kafka —> Logstash —> ES —>Kibana
Node description
| host name | address | role | effect | edition |
|---|---|---|---|---|
| es | 192.168.43.249 | Elasticsearch | Log storage | elasticsearch-6.3.2 |
| logstash | 192.168.43.147 | Logstash | Log processing | Logstatsh-6.3.2 |
| zkk | 192.168.199.43.74 | Kibana,kafka,zookeeper | Log display | kibana-6.3.2 |
| app1 | 192.168.43.253 | Nginx,FileBeat | Log production, log collection | filebeat-6.3.2 |
Experimental premise
1. ES install configuration and start
 2. Filebeat installation complete
 3. Logstash installation complete
 4. Kibana installation configuration complete
 5. Firewall opens related ports
 6. Disable selinux
 7. Zookeeper running and starting
 8. Kafka is configured to run
Service configuration
- kafka configuration
#Create a topic and test that the consumer is OK (previously created)
/usr/local/kafka_2.12-2.1.0/bin/kafka-topics.sh --create \
--zookeeper 192.168.43.74:2181 \
--replication-factor 1 --partitions 2 \
--topic elktest1
- filebeat configuration
[root@es3 nginx-1.15.4]# vim /usr/local/filebeat/filebeat.yml
On the basis of the above experiment, comment out the logstash output and write the output of kafka
output.kafka:
  enabled: true
  hosts: ["192.168.43.74:9092"]
  topic: "elktest1"

#Running filebeat
/usr/local/filebeat/filebeat -c  /usr/local/filebeat/filebeat.yml
- logstash configuration
[root@localhost ~]# vim /usr/local/logstash/config/nginx-access.conf
input{
  kafka{
    bootstrap_servers => "192.168.43.74:9092"
    topics => "elktest"
    consumer_threads => 1
    decorate_events => true
    auto_offset_reset => "latest"

  }
}

output {
   elasticsearch {
         hosts => ["192.168.43.249:9200"]
         index => "nginx-kafka-%{+YYYY-MM-dd}"
   }
}

#function
/usr/local/logstash/bin/logstash -f /usr/local/logstash/config/nginx-access.conf
- kibana show
kibana host starts kafka (if it has been started before, this will not be ignored)
 #Start zookeeper
/usr/local/zookeeper-3.4.12/bin/zkServer.sh start
#Start kafka
/usr/local/kafka/bin/kafka-server-start.sh -daemon /usr/local/kafka/config/server.properties
Accessing the local 5601 port on the kibana host
firefox 192.168.43.74:5601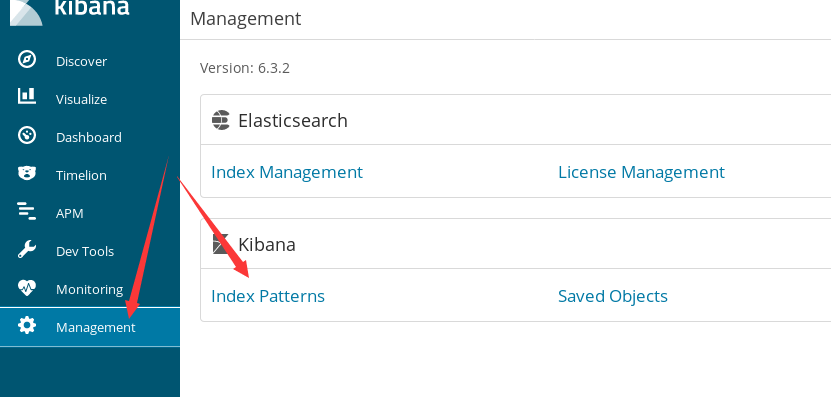
Experiment 3
The key point of the experiment is to understand the coordination process of each component and learn how to merge multiple lines of logs
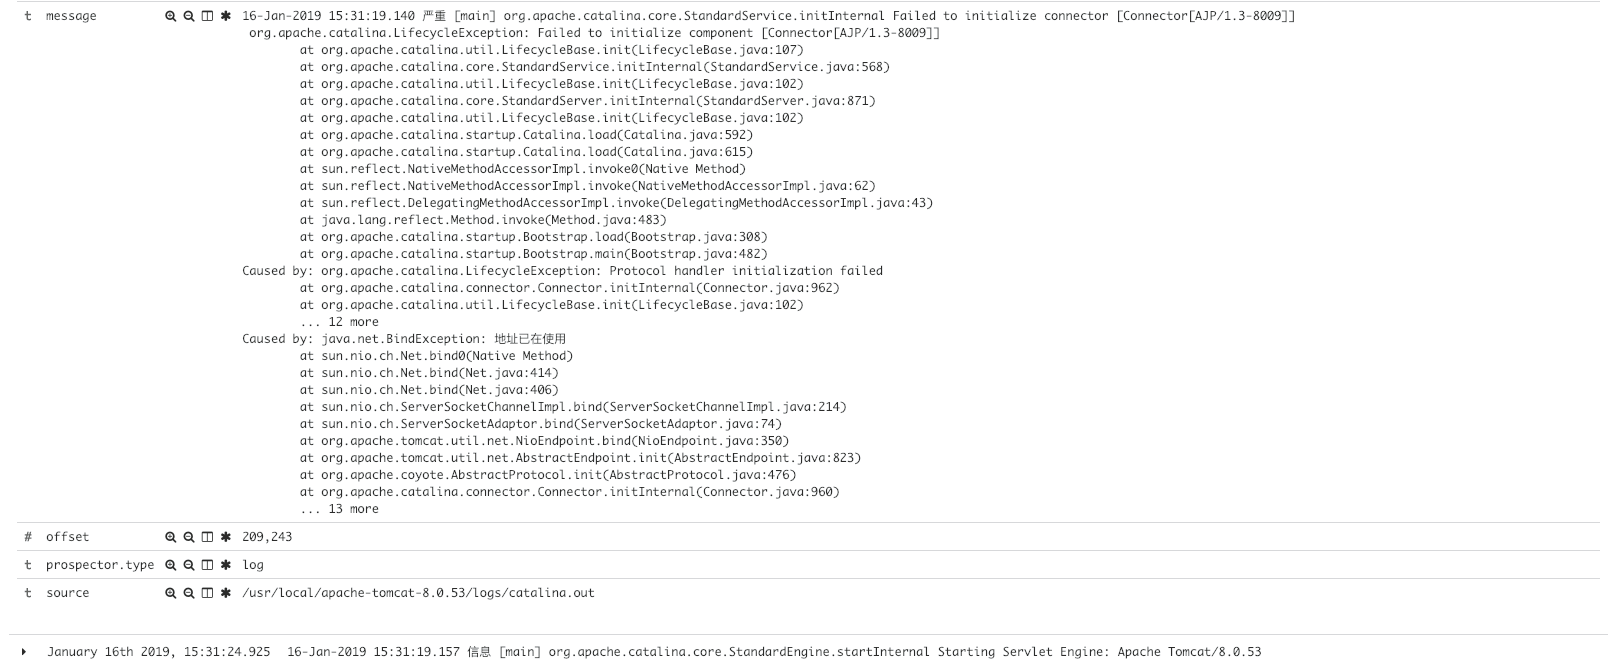
Tomcat(Catalina.out) —> Filebeat —> Kafka —> Logstash —> ES —>Kibana
Node description
| host name | address | role | effect | edition |
|---|---|---|---|---|
| es | 192.168.43.249 | Elasticsearch | Log storage | elasticsearch-6.3.2 |
| logstash | 192.168.43.147 | Logstash | Log processing | Logstatsh-6.3.2 |
| zkk | 192.168.199.43.74 | Kibana,kafka,zookeeper | Log display | kibana-6.3.2 |
| app1 | 192.168.43.253 | Tomcat,FileBeat | Log production, log collection | filebeat-6.3.2 |
Experimental premise
1. ES install configuration and start
 2. Filebeat installation complete
 3. Logstash installation complete
 4. Kibana installation configuration complete
 5. Firewall opens related ports
 6. Disable selinux
 7. Zookeeper running and starting
 8. Kafka is configured to run
 9. Tomcat8 installation configuration and default log format
Service configuration
- kafka configuration
#Create a topic and test that the consumer is OK (previously created)
/usr/local/kafka_2.12-2.1.0/bin/kafka-topics.sh --create \
--zookeeper 192.168.43.74:2181 \
--replication-factor 1 --partitions 2 \
--topic elktest1
- filebeat configuration
# Match the log lines in the Tomcat log that do not start with the time (Format: 16-Jan-2019 00:54:38.599 information...), and merge multiple lines

[root@app1 filebeat]# cat filebeat.yml
filebeat:
  prospectors:
    - type: log
      paths:
        - /usr/local/apache-tomcat-8.0.53/logs/catalina.out
      multiline.pattern: '^[0-9]{2}-[A-Za-z]*-[0-9]{4}'
      multiline.negate: true
      multiline.match: after

output.kafka:
  enabled: true
  hosts: ["192.168.43.74:9092"]
  topic: "elktest1"

#Running filebeat
/usr/local/filebeat/filebeat -c  /usr/local/filebeat/filebeat.yml
- logstash configuration
[root@logstash config]# cat tomcat-catalina.conf
input{
  kafka{
    bootstrap_servers => "192.168.43.74:9092"
    topics => "elktest"
    consumer_threads => 1
    decorate_events => true
    auto_offset_reset => "latest1"
  }
}


filter {
  json {
    source => "message"
  }
}

output {
   elasticsearch {
         hosts => ["192.168.43.249:9200"]
         index => "tomcat-kafka-%{+YYYY-MM-dd}"
   }
}

#function
/usr/local/logstash/bin/logstash -f /usr/local/logstash/config/nginx-access.conf
Result verification
- Original log format
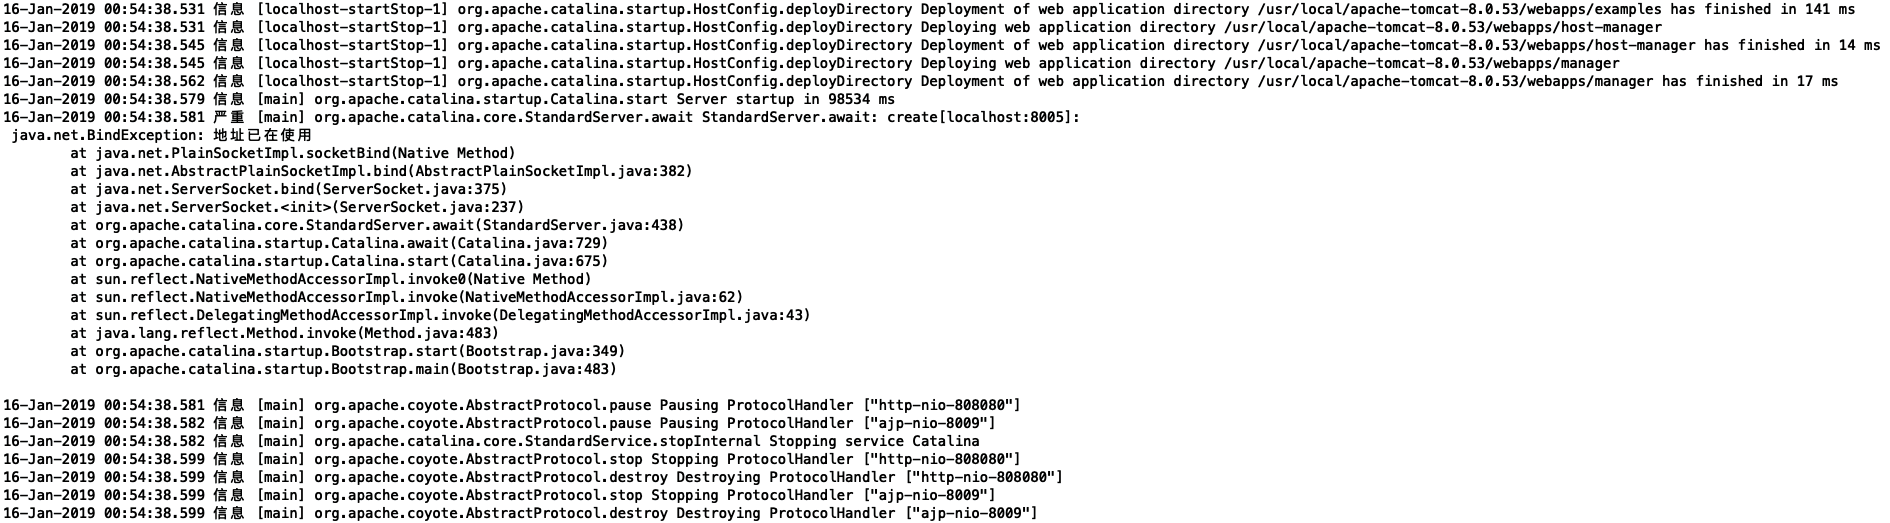
- Repeatedly start Tomcat to simulate error reporting
- kibana shows multiline merging
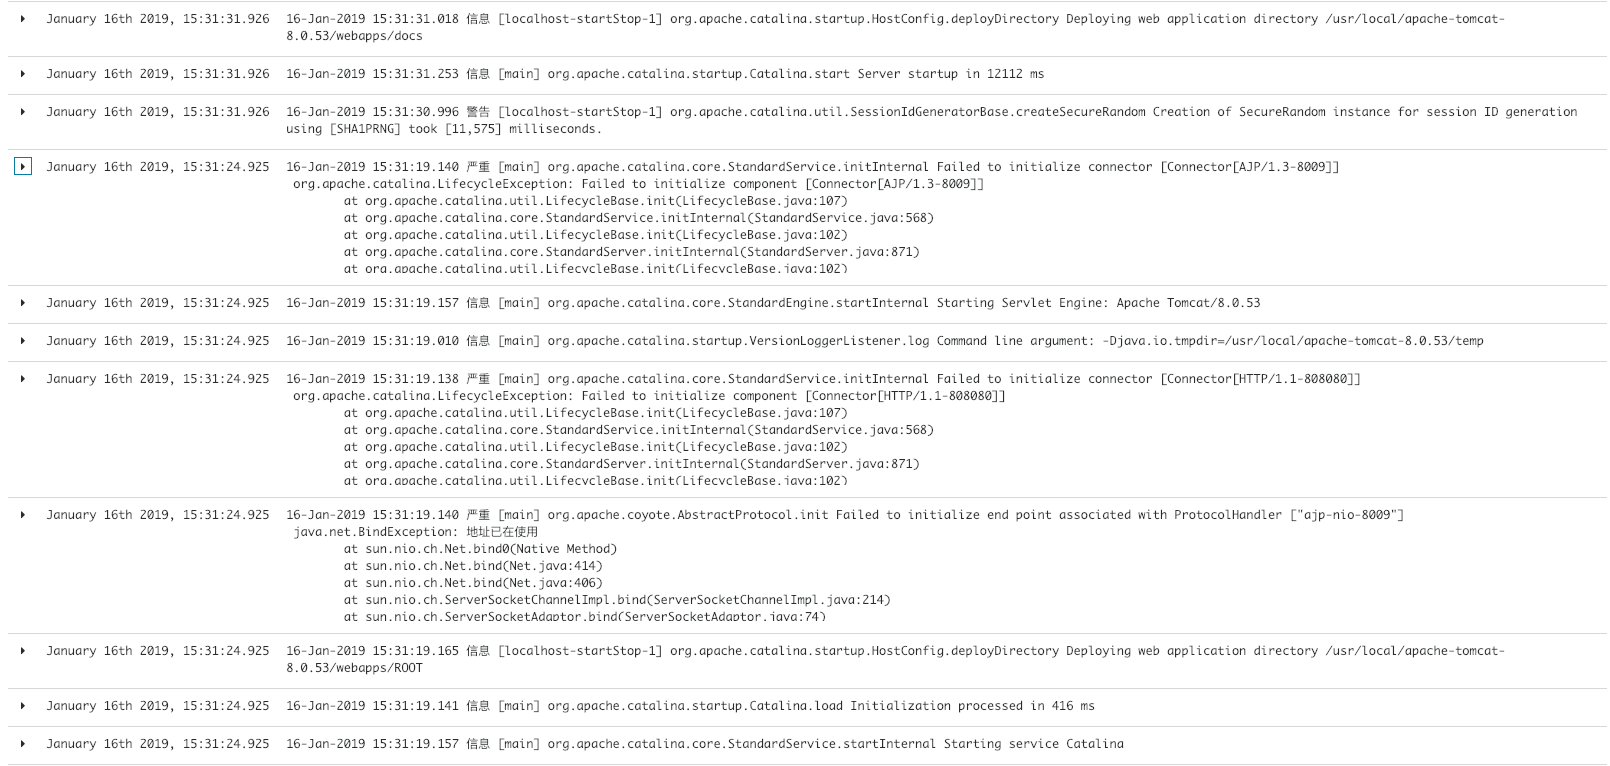
- Expand the error log to see if the merge is normal