ELKB log system
Antecedents
Why do you do this?
"Inspiration source" is the blogger's own project. The blogger of this project writes too freely. There are miscellaneous functions. He always reports some strange errors... Errors. Let's look at the log and find out how to make mistakes, right. However, this local report is wrong. It's ok. I'll take a direct look at the console. ok, it can be solved quickly. The fault is that there is a test environment. jenkins is used for pipeline deployment and runs on the server. If an error is reported, you can only look at the log file. This is the log, right? Tail - N 300 XXX Log or tail - f XXX Log, isn't this pure xx. ok, just build a log system by yourself and integrate jinkens by the way. This is all later
My logs are on the remote server. I will install Beats on the server, which is lighter than Logstash, and then use Redis as a message queue to deploy a real ELK system on the virtual machine.
Why add Redis?
Because my virtual machine is on the intranet, I can't guarantee that the virtual machine will be on at any time, so I think of an FTP service, and then manually adjust the FTP download every time I query the log. However, I find that it seems that I have to manually download the log every time, which is very annoying. I learned about Beats later, but I was thinking, when he gave Logstash, my virtual machine went down again? Unexpectedly, I saw a post saying that Filebeat has a persistence mechanism. If it is found that the destination is unavailable, it will support saving, and then send it back when it is available. Then I thought about it. If I lose it in the message middleware, I can actually cry. However, at present, the chat system has not officially entered the development stage. It is just a demo, so the message queue has not been used. Therefore, let's use redis as a message queue. I'm still thinking, when I really get up, will I burst the remaining 1g of memory? Let's talk about it then. Who hasn't had a few accidents, right
How do you do it? What can I do for you?
Es must be. In fact, now I also have es and kibana. L and B are Logstash and Beats respectively.
Logstash is an open source data collection engine with good real-time performance. It can dynamically unify data from different sources, output the data to the destination you want, and directly import the data into ES. I remember when I learned ES myself, I still handwritten java code to take the data from MySQL, and then assembled it into ES myself. Logstash can completely replace this step, so that we Java only care about the core retrieval business
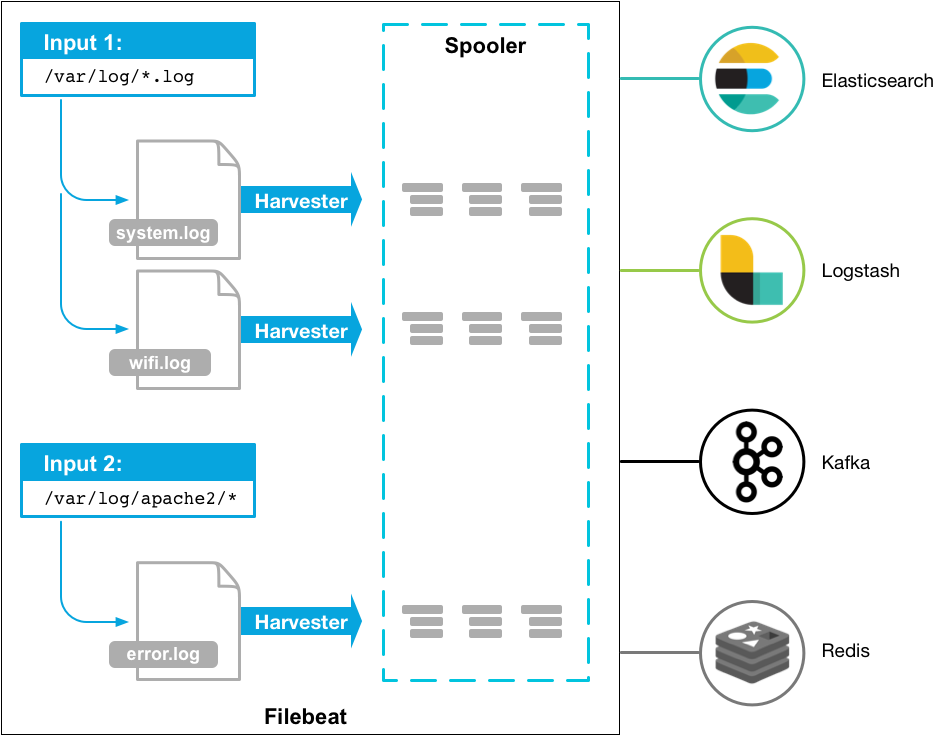
Beats is an open source data transmitter. It can be installed on the proxy server, and it can be directly connected to ES. It is divided into many types, because log collection is actually some log files, so Filebeat is fully competent
Filebeat
Download and install
https://www.elastic.co/guide/en/beats/filebeat/7.16/setup-repositories.html#_yum
I directly use the YUM download method provided on the official website (CentOS 8.2)
# Introduction rpm
sudo rpm --import https://packages.elastic.co/GPG-KEY-elasticsearch
# Configure yum warehouse
vim /etc/yum.repos.d/elastic.repo
# Paste the following code to execute: wq
[elastic-7.x]
name=Elastic repository for 7.x packages
baseurl=https://artifacts.elastic.co/packages/7.x/yum
gpgcheck=1
gpgkey=https://artifacts.elastic.co/GPG-KEY-elasticsearch
enabled=1
autorefresh=1
type=rpm-md
# install
sudo yum install filebeat
# Startup and self start
sudo systemctl enable filebeat
# If CentOS 7 X startup and self startup
sudo chkconfig --add filebeat
# The directory structure is very similar to nginx
# home -- /usr/share/filebeat
# bin -- /usr/share/filebeat/bin
# conf -- /etc/filebeat
# data -- /var/lib/filebeat
# logs -- /var/log/filebeat
Post a document home page. Other installation methods are here
https://www.elastic.co/guide/en/beats/filebeat/current/index.html
Simple configuration
# ============================== Filebeat inputs ===============================

filebeat.inputs:
  - type: log
  enabled: true
  paths:
    - /var/log/nginx/*.log

# ============================== Filebeat modules ==============================

filebeat.config.modules:
  path: ${path.config}/modules.d/*.yml
  reload.enabled: false
# ======================= Elasticsearch template setting =======================

setup.template.settings:
  index.number_of_shards: 1

# ================================== Outputs ===================================

# ------------------------------ Logstash Output -------------------------------
output.redis:
  hosts: ["47.96.5.71:9736"]
  password: "Tplentiful"
  key: "filebeat:"
  db: 0
  timeout: 5
#output.logstash:
  # The Logstash hosts
  #hosts: ["localhost:5044"]

  # Optional SSL. By default is off.
  # List of root certificates for HTTPS server verifications
  #ssl.certificate_authorities: ["/etc/pki/root/ca.pem"]

  # Certificate for SSL client authentication
  #ssl.certificate: "/etc/pki/client/cert.pem"

  # Client Certificate Key
  #ssl.key: "/etc/pki/client/cert.key"

# ================================= Processors =================================
processors:
  - add_host_metadata:
      when.not.contains.tags: forwarded
  - add_cloud_metadata: ~
  - add_docker_metadata: ~
  - add_kubernetes_metadata: ~
Data sample
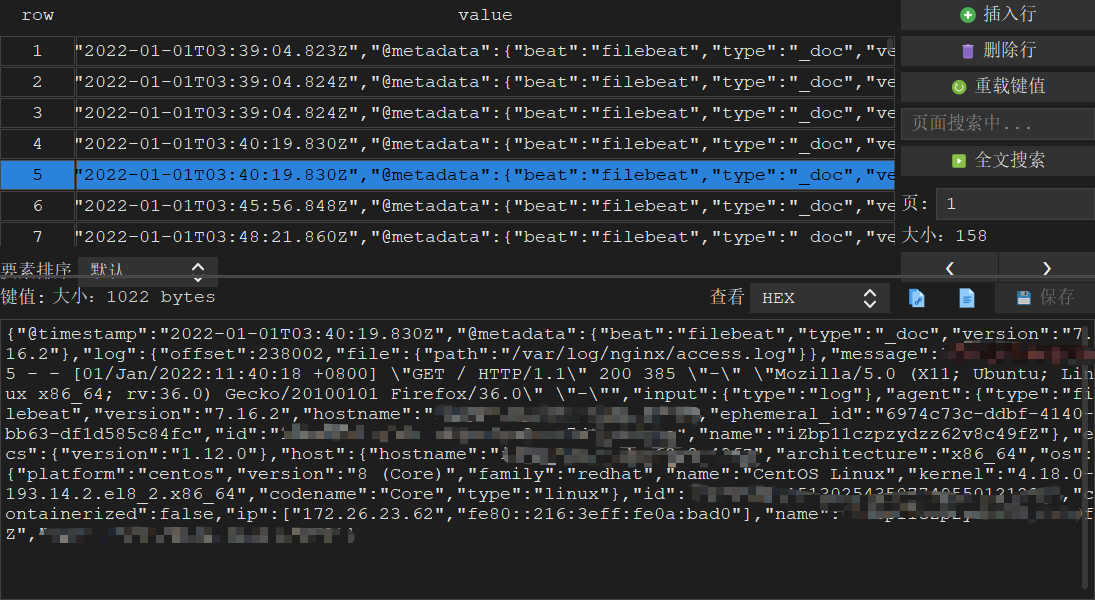
I'm here to put the data Output into Redis and view it with a visualization tool
input configuration
Since I only collect the log files of my own projects, I don't need to make other complex configurations for the Input related to filebeat. Interested hxd can check the official documents by themselves
filebeat.inputs:
- type: log
  enabled: true
  backoff: "1s"
  paths:
    - /data/family_doctor/logs/article/*.log
    - /data/family_doctor/logs/article/*/*.log
  fields:
    filename: article_log
  fields_under_root: true
  multiline:
    type: pattern
    pattern: '^\[[0-9]{4}-[0-9]{2}-[0-9]{2}'
    negate: true
    match: after

- type: log
  enabled: true
  backoff: "1s"
  paths:
    - /data/family_doctor/logs/other/*.log
    - /data/family_doctor/logs/other/*/*.log
  # Customize a fields field to filter the output
  fields:
    filename: other_log
  fields_under_root: true
  # Use regular matching to match timestampe for multi line statistics (example on the official website)
  multiline:
    type: pattern
    # type: count the number of rows that can be customized
    pattern: '^\[[0-9]{4}-[0-9]{2}-[0-9]{2}'
    negate: true
    match: after
...
output configuration
output.redis:
  hosts: ["host:port"]
  password: "Tplentiful"
  # Default key value
  key: "default_log"
  db: 0
  timeout: 5
  keys:
  # Generate different key values according to custom field names
    - key: "article_log"
      when.equals:
        filename: article_log
    - key: "other_log"
      when.equals:
        filename: other_log
    - key: "user_log"
      when.equals:
        filename: user_log
    - key: "sys_log"
      when.equals:
        filename: sys_log
    - key: "rtc_log"
      when.equals:
        filename: rtc_log
filebeat startup script
#!/bin/bash
agent="/usr/share/filebeat/bin/filebeat"
args="-c /etc/filebeat/filebeat.yml"
test() {
$agent $args
}
start() {
    pid=`ps -ef | grep $agent | grep -v grep | awk '{print $2}'`
    if [ ! "$pid" ];then
        echo "start-up filebeat: "
        test
        if [ $? -ne 0 ]; then
            echo
            exit 1
        fi
        $agent $args &
        if [ $? == '0' ];then
            echo "filebeat Start successful"
        else
            echo "filebeat Startup failed"
        fi
    else
        echo "filebeat Running"
        exit
    fi
}
stop() {
    echo -n $"stop it filebeat: "
    pid=`ps -ef | grep $agent | grep -v grep | awk '{print $2}'`
    if [ ! "$pid" ];then
echo "filebeat Has stopped"
    else
        kill $pid
echo "filebeat Stop successful"
    fi
}
restart() {
    stop
    start
}
status(){
    pid=`ps -ef | grep $agent | grep -v grep | awk '{print $2}'`
    if [ ! "$pid" ];then
        echo "filebeat Currently stopped"
    else
        echo "filebeat Currently running"
    fi
}
case "$1" in
    start)
        start
    ;;
    stop)
        stop
    ;;
    restart)
        restart
    ;;
    status)
        status
    ;;
    *)
        echo $"Usage: $0 {start|stop|restart|status}"
        exit 1
esac
Logstash
Download and install
https://www.elastic.co/guide/en/logstash/current/installing-logstash.html
# To use the Java version, you need to install the JDK before this. There are a lot of them on the Internet, so they don't post them specifically
# rpm package management
sudo rpm --import https://artifacts.elastic.co/GPG-KEY-elasticsearch
# Create edit file
vim /etc/yum.repos.d/logstash.repo
# Copy paste
[logstash-7.x]
name=Elastic repository for 7.x packages
baseurl=https://artifacts.elastic.co/packages/7.x/yum
gpgcheck=1
gpgkey=https://artifacts.elastic.co/GPG-KEY-elasticsearch
enabled=1
autorefresh=1
type=rpm-md
# install
sudo yum install logstash
# Directory structure and default location
# home -- /usr/share/logstash
# bin -- /usr/share/logstash/bin
# settings -- /etc/logstash
# conf -- /etc/logstash/conf.d/*.conf
# logs -- /var/log/logstash
# plugins -- /usr/share/logstash/plugins
# data -- /var/lib/logstash
Basic knowledge
https://www.elastic.co/guide/en/logstash/current/pipeline.html
Input
Data sources collected
There are four common forms of Logstash input:
- File: a standard file system. Collecting data is like tail -fn 100
- syslog: the log file of the system (I don't know much about it)
- Redis: get data from redis (in fact, Message Oriented Middleware)
- Beats: get data directly from beats
There are more ES, HTTP, JDBC, Kafka, Log4j, RabbitMQ, WebSocket
Filters
The filter is a unique event processing device in the Logstash pipeline, which filters and processes different events according to specific conditions
- At present, the official website of grok is the best way to parse data in a structured and searchable manner
- mutate: process event fields, such as renaming, deleting, modifying and replacing
- drop: delete event completely
- Clone: clone an event. You can add or delete some fields
Output
This is the last stage of the Logstash pipeline. An event can pass through multiple different outputs. Once all outputs are completed, the event is completed
- ElasticSearch: direct docking with ES
- file: write data to disk
- email: send by mail
- Http: in the form of HTTP request
- Message Oriented Middleware: Kafka, RabbitMQ, redis (pretending to be Message Oriented Middleware)
- WebSocket: sent in the form of socket
Codecs
Codec allows different data to have different output forms
- JSON: output in JSON format
- Multiline: multiline output (multiple events are combined into one event)
configuration file
logstash.yml
The parameters in the command line will override the configuration in yml
# It can be understood as the maximum upper limit condition of acquisition frequency
pipeline:
  batch:
    size: 50
    delay: 5
# Node name
node.name: logstash1
# Data path
path.data: /var/lib/logstash
# Configure automatic loading. Logstash should not be forced to kill. If there are still blocked logs that are not output, data will be lost
config.reload.automatic: true
# Configure hot load test cycle
config.reload.interval: 10s
# host and port
api.http.host: 192.168.5.128
api.http.port: 9600
# Log path
path.logs: /var/log/logstash
pipeline.yml
A Logstash instance can run multiple pipeline configurations
There is no configuration here, so it is impossible to use such advanced functions. The official document says that the configuration here will overwrite the pipeline configuration in the yaml above
jvm.options
JVM parameters for Logstash
## JVM configuration

# Xms represents the initial size of total heap space
# Xmx represents the maximum size of total heap space

-Xms384m
-Xmx384m

################################################################
## Expert settings
################################################################
##
## All settings below this section are considered
## expert settings. Don't tamper with them unless
## you understand what you are doing
##
################################################################

## GC configuration
8-13:-XX:+UseConcMarkSweepGC
8-13:-XX:CMSInitiatingOccupancyFraction=75
8-13:-XX:+UseCMSInitiatingOccupancyOnly

## Locale
# Set the locale language
#-Duser.language=en

# Set the locale country
#-Duser.country=US

# Set the locale variant, if any
#-Duser.variant=

## basic

# set the I/O temp directory
#-Djava.io.tmpdir=$HOME

# set to headless, just in case
-Djava.awt.headless=true

# ensure UTF-8 encoding by default (e.g. filenames)
-Dfile.encoding=UTF-8

# use our provided JNA always versus the system one
#-Djna.nosys=true

# Turn on JRuby invokedynamic
-Djruby.compile.invokedynamic=true
# Force Compilation
-Djruby.jit.threshold=0
# Make sure joni regexp interruptability is enabled
-Djruby.regexp.interruptible=true

## heap dumps

# generate a heap dump when an allocation from the Java heap fails
# heap dumps are created in the working directory of the JVM
-XX:+HeapDumpOnOutOfMemoryError

# specify an alternative path for heap dumps
# ensure the directory exists and has sufficient space
#-XX:HeapDumpPath=${LOGSTASH_HOME}/heapdump.hprof

## GC logging
#-XX:+PrintGCDetails
#-XX:+PrintGCTimeStamps
#-XX:+PrintGCDateStamps
#-XX:+PrintClassHistogram
#-XX:+PrintTenuringDistribution
#-XX:+PrintGCApplicationStoppedTime

# log GC status to a file with time stamps
# ensure the directory exists
#-Xloggc:${LS_GC_LOG_FILE}

# Entropy source for randomness
-Djava.security.egd=file:/dev/urandom

# Copy the logging context from parent threads to children
-Dlog4j2.isThreadContextMapInheritable=true

17-:--add-opens java.base/sun.nio.ch=ALL-UNNAMED
17-:--add-opens java.base/java.io=ALL-UNNAMED
log4j2.properties
Logstash's log configuration file - just use the default log. We just troubleshoot this log ourselves
startup.options
Startup parameter configuration, some paths and working directories, and startup user configuration
The configuration of logstash input and output is based on logstash sample under / etc/logstash / Conf configuration
ElasticSearch
Download and install
# Classic three piece set
rpm --import https://artifacts.elastic.co/GPG-KEY-elasticsearch
vim /etc/yum.repos.d/elasticsearch.repo
# Copy it in
[elasticsearch]
name=Elasticsearch repository for 7.x packages
baseurl=https://artifacts.elastic.co/packages/7.x/yum
gpgcheck=1
gpgkey=https://artifacts.elastic.co/GPG-KEY-elasticsearch
enabled=0
autorefresh=1
type=rpm-md
# implement
sudo yum install --enablerepo=elasticsearch elasticsearch
# The directory structure and default path should be specified
# home -- /usr/share/elasticsearch /
# bin -- /usr/share/elasticsearch/bin / the startup files are all here. In fact, they are in / etc / init D / inside is commonly used
# logs -- /var/log/elasticsearch / log file directory
# Conf -- configuration file directory of / etc / elasticsearch / es
# Evoment conf -- / etc / sysconfig / elasticsearch configuration file of ES environment variable, JVM parameters, etc
# data -- /var/lib/elasticsearch / data
# jdk -- /usr/share/elasticsearch/jdk / where the JDK is configured, it can be modified in the event conf
# plugins -- /usr/share/elasticsearch/plugins / plug-in, which may use plug-ins such as word splitter
For more usage of ES, please refer to the official website documents or the Chinese community
https://www.elastic.co/guide/en/elasticsearch/reference/7.16/index.html
configuration file
elasticsearch.yml
# Path / etc / elasticsearch / elasticsearch yml
# Node name
node.name: loges1
# Data directory
path.data: /var/lib/elasticsearch
# Log directory
path.logs: /var/log/elasticsearch
# IP address of your own server
network.host: 192.168.5.128
# ES port, remember to turn on the firewall
http.port: 9200
# Maximum amount of data per request
http.max_content_length: 50mb
# ES has its own cluster. Configure the master node
cluster.initial_master_nodes: ["loges1"]
log4j2.properties
# He was what he was. I didn't change it. Some configurations of ES built-in Java log printing do not make much sense
jvm.options
# When ES is started, there are some JVM parameters. The front is the version corresponding to JDK, and the back is some configurations, garbage collector, whether to print GC logs or not. I just changed the heap size. I shouldn't use much space, so I changed Xms512m Xmx512m
elasticsearch
# Path / etc/sysconfig/elasticsearch
# Here are some environment variable parameters. I configured es in it_ JAVA_ Home doesn't seem to work, so I set it directly in / etc/profile and execute source /etc/profile
ES_JAVA_HOME=/usr/share/elasticsearch/jdk
ES_PATH_CONF=/etc/elasticsearch
ES_JAVA_OPTS="-Xms512m -Xmx512m"
ES_STARTUP_SLEEP_TIME=5
# Others are commented out. If any problems are found later, they will be corrected one by one and added
Note: ES cannot be started directly with the Root account and will report an error, so it is best to open a new account. In fact, ES created an account called elasticsearch and a group called this name for us during installation. Its user name is too long, so I don't need to create one myself to join this group. Don't forget to give users permission to some of the above directories
Just start ES /usr/share/elasticsearch/bin/elasticsearch -d
Kibana
Download and install
# Copy paste
rpm --import https://artifacts.elastic.co/GPG-KEY-elasticsearch
vim /etc/yum.repos.d/kibana.repo
# Copy the following
[kibana-7.x]
name=Kibana repository for 7.x packages
baseurl=https://artifacts.elastic.co/packages/7.x/yum
gpgcheck=1
gpgkey=https://artifacts.elastic.co/GPG-KEY-elasticsearch
enabled=1
autorefresh=1
type=rpm-md
# implement
sudo yum install kibana
# Power on
sudo systemctl daemon-reload
sudo systemctl enable kibana.service
# Start stop
sudo systemctl start kibana.service
sudo systemctl stop kibana.service
# directory structure
# home -- /usr/share/kibana
# bin -- /usr/share/kibana/bin
# conf -- /etc/kibana
# data -- /var/lib/kibana
# logs -- /var/log/kibana
# plugins -- /usr/share/kibana/plugins
configuration file
server.port: 5601
server.host: "192.168.5.128"
server.name: "kibana-1"
elasticsearch.hosts: ["http://192.168.5.128:9200"]
# Just start it by a non root user
kibana has nothing to say. I just use it to write some request templates. Finally, the real call is Java. The nesting of request parameters is clear at a glance
For subsequent updates over time, paste a directory first