Article catalogue
1 Preface
Hi, everyone, this is senior student Dan Cheng. Today, we will build an epidemic visualization system based on big data. This is just a demo. We will try to analyze the epidemic data and the visualization system
Bi design help, problem opening guidance, technical solutions
??746876041
2 Introduction to development
Starting from the situation that the cumulative number of confirmed cases in each province increases with time and the situation that the spatial distribution increases with time, the seniors use the collected data to present the temporal and spatial distribution of the cumulative number of confirmed cases in each province in the form of maps, line charts and stacked bar charts, roughly analyze the overall posture, and then display the detailed information related to the epidemic situation in each province at different granularity, To find out the reasons that affect the change of its situation in different periods of time (overseas input, promulgation of relevant policies, etc.).
At the same time, the data related to the diagnosis and death of the epidemic are also linked with the GDP, education level, urbanization rate and medical and health level of each province, so as to find out whether there is a relationship between it and GDP, education level and urbanization rate.
Its target users are the government and other prevention and control organs. Through this system, we can analyze the temporal and spatial distribution mode of the epidemic, monitor the development trend of the epidemic and evaluate the epidemic prevention and control measures.
3 data set
Data from crawler and manual collection:
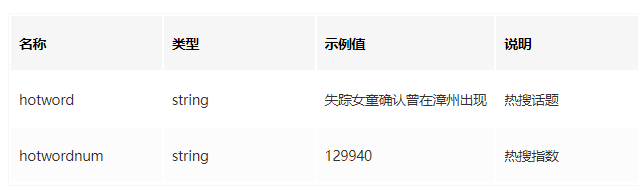
weibo.json Sina Weibo real-time hot search of the top 50 data
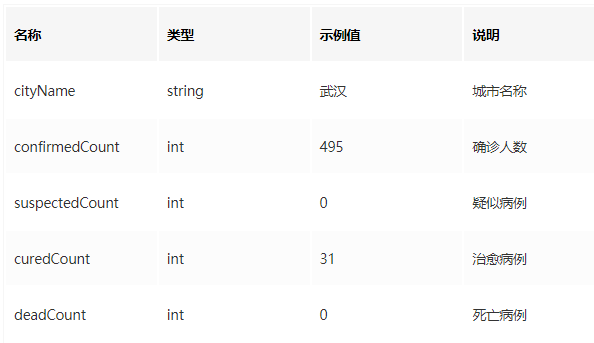
ProvinceData. Details of epidemic situation in JSON provinces and cities
Data from China National Bureau of Statistics (2018 China Statistical Yearbook)
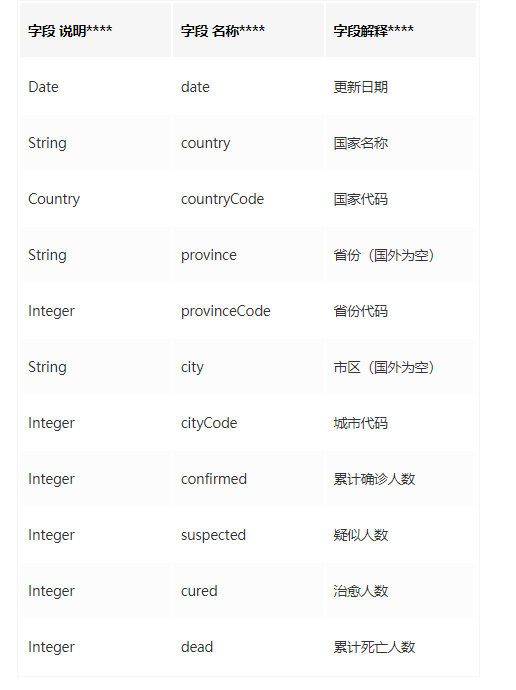
From January 10, 2020 to February 6, 2020, the data came from the epidemic announcement of the national, provincial and Wuhan Municipal Health Commission. After February 7, 2020, the data were collected from today's headline interface
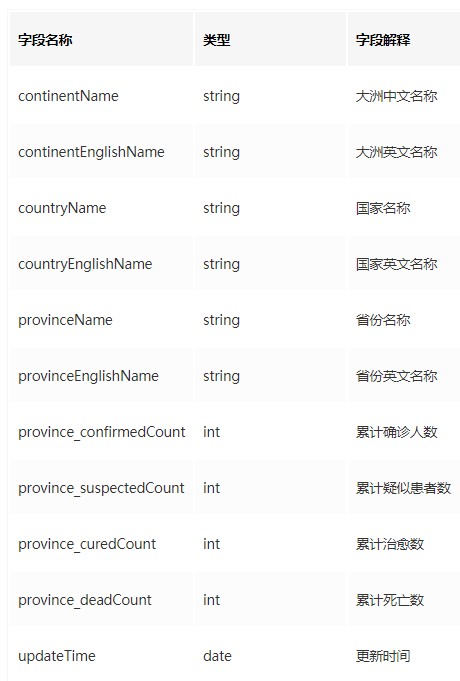
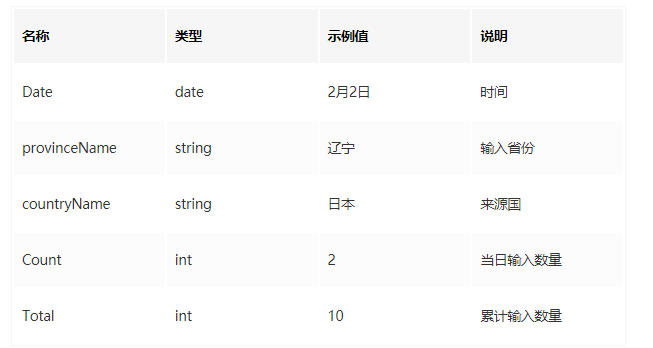
Overseas input data (manually collected from online news)
4 implementation technology
4.1 system architecture

4.2 development environment
- 1,Node.js (both front-end Vue and back-end node depend on this environment)
- 2. Development tools: Git, vscode, Hbuilder, pycharm
- 3. Development language: Python, HTML+CSS+JavaScript
- 4. Key dependency libraries: echarts, bootstrap, jQuery
4.3 epidemic map
New Coronavirus pneumonia has begun to spread all over the world, and the situation is becoming more and more serious. Apart from focusing on the development of domestic development, we have begun to pay attention to the development and changes of outbreaks. Through geographical visualization, we can intuitively see the epidemic severity of each region.
4.3.1 choropleth maps
- The filling diagram is suitable for expressing the differences between regions.
- The filling chart can well show the global differences, and the subtle differences are difficult to express.
- However, the display effect of filling map is greatly affected by the area, which is easy to be misleading
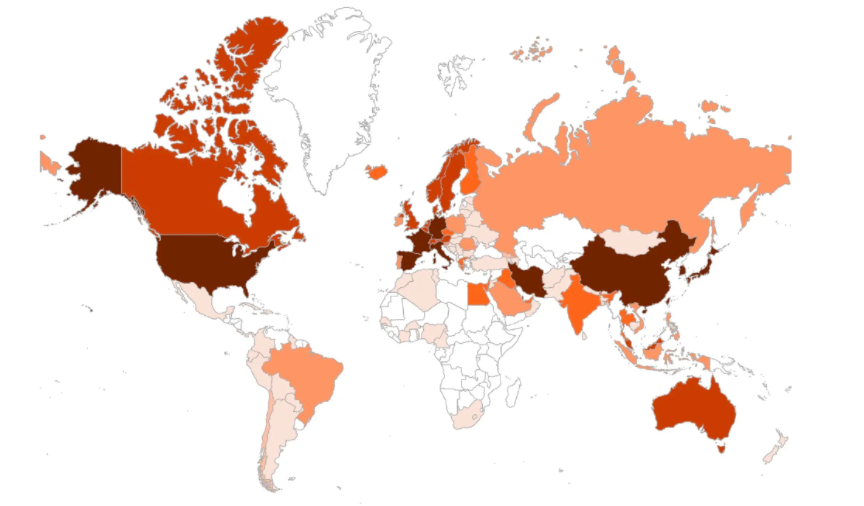
In the above filled figure, we can pay attention to the three epidemic areas of Asia, Europe and America, but it is difficult for us to pay attention to the severity of the epidemic in Italy and South Korea.
4.3.2 bubble chart
The bubble chart uses circles of different sizes to represent the values on the area. It displays one bubble per geographic coordinate or one bubble per area.
In the figure below, we visualize the epidemic map in the form of bubble chart
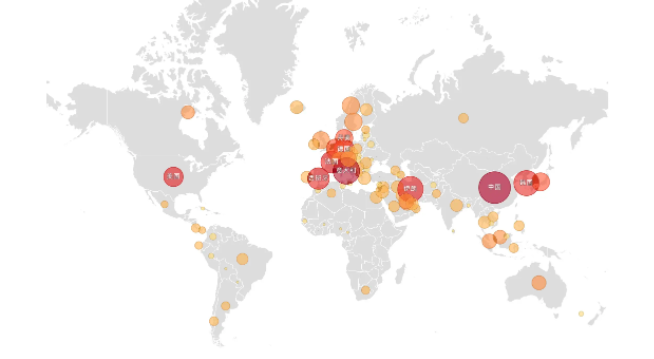
Through the bubble chart, we can clearly see the countries with serious epidemic in the world and will not be disturbed by the regional area. We can also clearly identify some countries with small area in Europe. The disadvantage of bubble chart expression is that there are too many bubbles, and too large bubbles will produce masking.
Bubbles are a good display form. If they are used improperly, they will also cause interference. For example, the selection of data mapping method and color band will affect the result of data expression.
Key codes:
# Author: Dan Cheng senior student q746876041
import json
import requests
import jsonpath
from pyecharts.charts import Map,Geo
from pyecharts import options as opts
from pyecharts.globals import GeoType,RenderType
# 1. Target website
url='https://api.inews.qq.com/newsqa/v1/automation/foreign/country/ranklist'
# 2. Request resources
resp=requests.get(url)
# 3. Extract data
# Type conversion JSON -- > Dict
data=json.loads(resp.text)
name = jsonpath.jsonpath(data,"$..name")
# print(name)
confirm = jsonpath.jsonpath(data,"$..confirm")
# print(confirm)
data_list = zip(name,confirm)
# print(list(data_list))
# 4. Visualize matplotlib and pyecharts

nameMap = {
        'Singapore Rep.':'Singapore',
        'Dominican Rep.':'Dominican',
        'Palestine':'Palestine',
        'Bahamas':'Bahamas',
        'Timor-Leste':'Timor-Leste',
        'Afghanistan':'Afghanistan',
        'Guinea-Bissau':'Guinea-Bissau',
        "C?te d'Ivoire":'Cote d'Ivoire',
        'Siachen Glacier':'Siachin glacier',
        "Br. Indian Ocean Ter.":'British Indian Ocean Territory',
        'Angola':'Angola',
        'Albania':'Albania',
        'United Arab Emirates':'The United Arab Emirates',
        'Argentina':'Argentina',
        'Armenia':'Armenia',
        'French Southern and Antarctic Lands':'French Southern Hemisphere and Antarctic Territory',
        'Australia':'Australia',
        'Austria':'Austria',
        'Azerbaijan':'Azerbaijan',
        'Burundi':'burundi',
        'Belgium':'Belgium',
        'Benin':'Benin',
        'Burkina Faso':'burkina faso ',
        'Bangladesh':'The People's Republic of Bangladesh',
        'Bulgaria':'Bulgaria',
        'The Bahamas':'Bahamas',
        'Bosnia and Herz.':'Bosnia and Herzegovina',
        'Belarus':'Belarus',
        'Belize':'Belize ',
        'Bermuda':'Bermuda',
        'Bolivia':'bolivia',
        'Brazil':'Brazil',
        'Brunei':'Brunei',
        'Bhutan':'Bhutan',
        'Botswana':'botswana',
        'Central African Rep.':'Central African',
        'Canada':'Canada',
        'Switzerland':'Switzerland',
        'Chile':'Chile',
        'China':'China',
        'Ivory Coast':'Ivory Coast',
        'Cameroon':'Cameroon',
        'Dem. Rep. Congo':'Democratic Republic of the Congo',
        'Congo':'Congo',
        'Colombia':'Columbia',
        'Costa Rica':'Costa Rica',
        'Cuba':'Cuba',
        'N. Cyprus':'northern cyprus ',
        'Cyprus':'Cyprus',
        'Czech Rep.':'Czech Republic',
        'Germany':'Germany',
        'Djibouti':'Djibouti',
        'Denmark':'Denmark',
        'Algeria':'Algeria',
        'Ecuador':'Ecuador',
        'Egypt':'Egypt',
        'Eritrea':'Eritrea',
        'Spain':'Spain',
        'Estonia':'Estonia',
        'Ethiopia':'Ethiopia',
        'Finland':'Finland',
        'Fiji':'Fei',
        'Falkland Islands':'Falkland Islands',
        'France':'France',
        'Gabon':'Gabon',
        'United Kingdom':'britain',
        'Georgia':'Georgia',
        'Ghana':'Ghana',
        'Guinea':'Guinea',
        'Gambia':'Gambia',
        'Guinea Bissau':'Guinea-Bissau',
        'Eq. Guinea':'Equatorial Guinea',
        'Greece':'Greece',
        'Greenland':'Greenland',
        'Guatemala':'Guatemala',
        'French Guiana':'French Guiana',
        'Guyana':'Guyana',
        'Honduras':'Honduras',
        'Croatia':'Croatia',
        'Haiti':'Haiti',
        'Hungary':'Hungary',
        'Indonesia':'Indonesia',
        'India':'India',
        'Ireland':'Ireland',
        'Iran':'Iran',
        'Iraq':'Iraq',
        'Iceland':'Iceland',
        'Israel':'Israel',
        'Italy':'Italy',
        'Jamaica':'Jamaica',
        'Jordan':'Jordan',
        'Japan':'Japan',
        'Japan':'Japanese mainland',
        'Kazakhstan':'Kazakhstan',
        'Kenya':'Kenya',
        'Kyrgyzstan':'Kyrgyzstan',
        'Cambodia':'Cambodia',
        'Korea':'the republic of korea',
        'Kosovo':'Kosovo ',
        'Kuwait':'Kuwait',
        'Lao PDR':'Laos',
        'Lebanon':'Lebanon',
        'Liberia':'Liberia',
        'Libya':'Libya',
        'Sri Lanka':'Sri Lanka',
        'Lesotho':'Lesotho',
        'Lithuania':'Lithuania',
        'Luxembourg':'Luxembourg',
        'Latvia':'Latvia',
        'Morocco':'Morocco',
        'Moldova':'Moldova',
        'Madagascar':'Madagascar',
        'Mexico':'Mexico',
        'Macedonia':'Macedonia',
        'Mali':'Mali',
        'Myanmar':'Myanmar',
        'Montenegro':'Montenegro ',
        'Mongolia':'Mongolia',
        'Mozambique':'Mozambique',
        'Mauritania':'Mauritania',
        'Malawi':'Malawi',
        'Malaysia':'Malaysia',
        'Namibia':'Namibia',
        'New Caledonia':'New Caledonia ',
        'Niger':'Niger',
        'Nigeria':'Nigeria',
        'Nicaragua':'Nicaragua',
        'Netherlands':'Netherlands',
        'Norway':'Norway',
        'Nepal':'Nepal',
        'New Zealand':'New Zealand',
        'Oman':'Oman',
        'Pakistan':'Pakistan',
        'Panama':'Panama',
        'Peru':'Peru',
        'Philippines':'the Philippines',
        'Papua New Guinea':'papua new guinea',
        'Poland':'poland',
        'Puerto Rico':'Puerto Rico',
        'Dem. Rep. Korea':'North Korea',
        'Portugal':'Portugal',
        'Paraguay':'Paraguay',
        'Qatar':'Qatar',
        'Romania':'Romania',
        'Russia':'Russia',
        'Rwanda':'Rwanda',
        'W. Sahara':'Western Sahara',
        'Saudi Arabia':'Saudi Arabia',
        'Sudan':'Sudan',
        'S. Sudan':'South Sudan',
        'Senegal':'Senegal',
        'Solomon Is.':'Solomon Islands',
        'Sierra Leone':'sierra leone',
        'El Salvador':'El Salvador',
        'Somaliland':'Somaliland',
        'Somalia':'Somalia',
        'Serbia':'Serbia',
        'Suriname':'Suriname',
        'Slovakia':'Slovakia',
        'Slovenia':'Slovenia',
        'Sweden':'Sweden',
        'Swaziland':'Eswatini',
        'Syria':'Syria',
        'Chad':'Chad',
        'Togo':'Togo',
        'Thailand':'Thailand',
        'Tajikistan':'Tajikistan',
        'Turkmenistan':'Turkmenistan',
        'East Timor':'Timor-Leste',
        'Trinidad and Tobago':'Trinidad and Tobago ',
        'Tunisia':'Tunisia',
        'Turkey':'turkey',
        'Tanzania':'Tanzania',
        'Uganda':'Uganda',
        'Ukraine':'Ukraine',
        'Uruguay':'Uruguay',
        'United States':'U.S.A',
        'Uzbekistan':'Uzbekistan',
        'Venezuela':'Venezuela',
        'Vietnam':'Vietnam',
        'Vanuatu':'Vanuatu',
        'West Bank':'west bank',
        'Yemen':'Yemen',
        'South Africa':'South Africa',
        'Zambia':'Zambia',
        'Zimbabwe':'zimbabwe'
    }
map = Map().add(series_name='World epidemic distribution',
                data_pair=data_list,
                maptype='world',
                name_map=nameMap,
                is_map_symbol_show=False
)
map.set_series_opts(label_opts=opts.LabelOpts(is_show=False))
map.render('World epidemic distribution 3.html')

# Author: Dan Cheng senior student q746876041
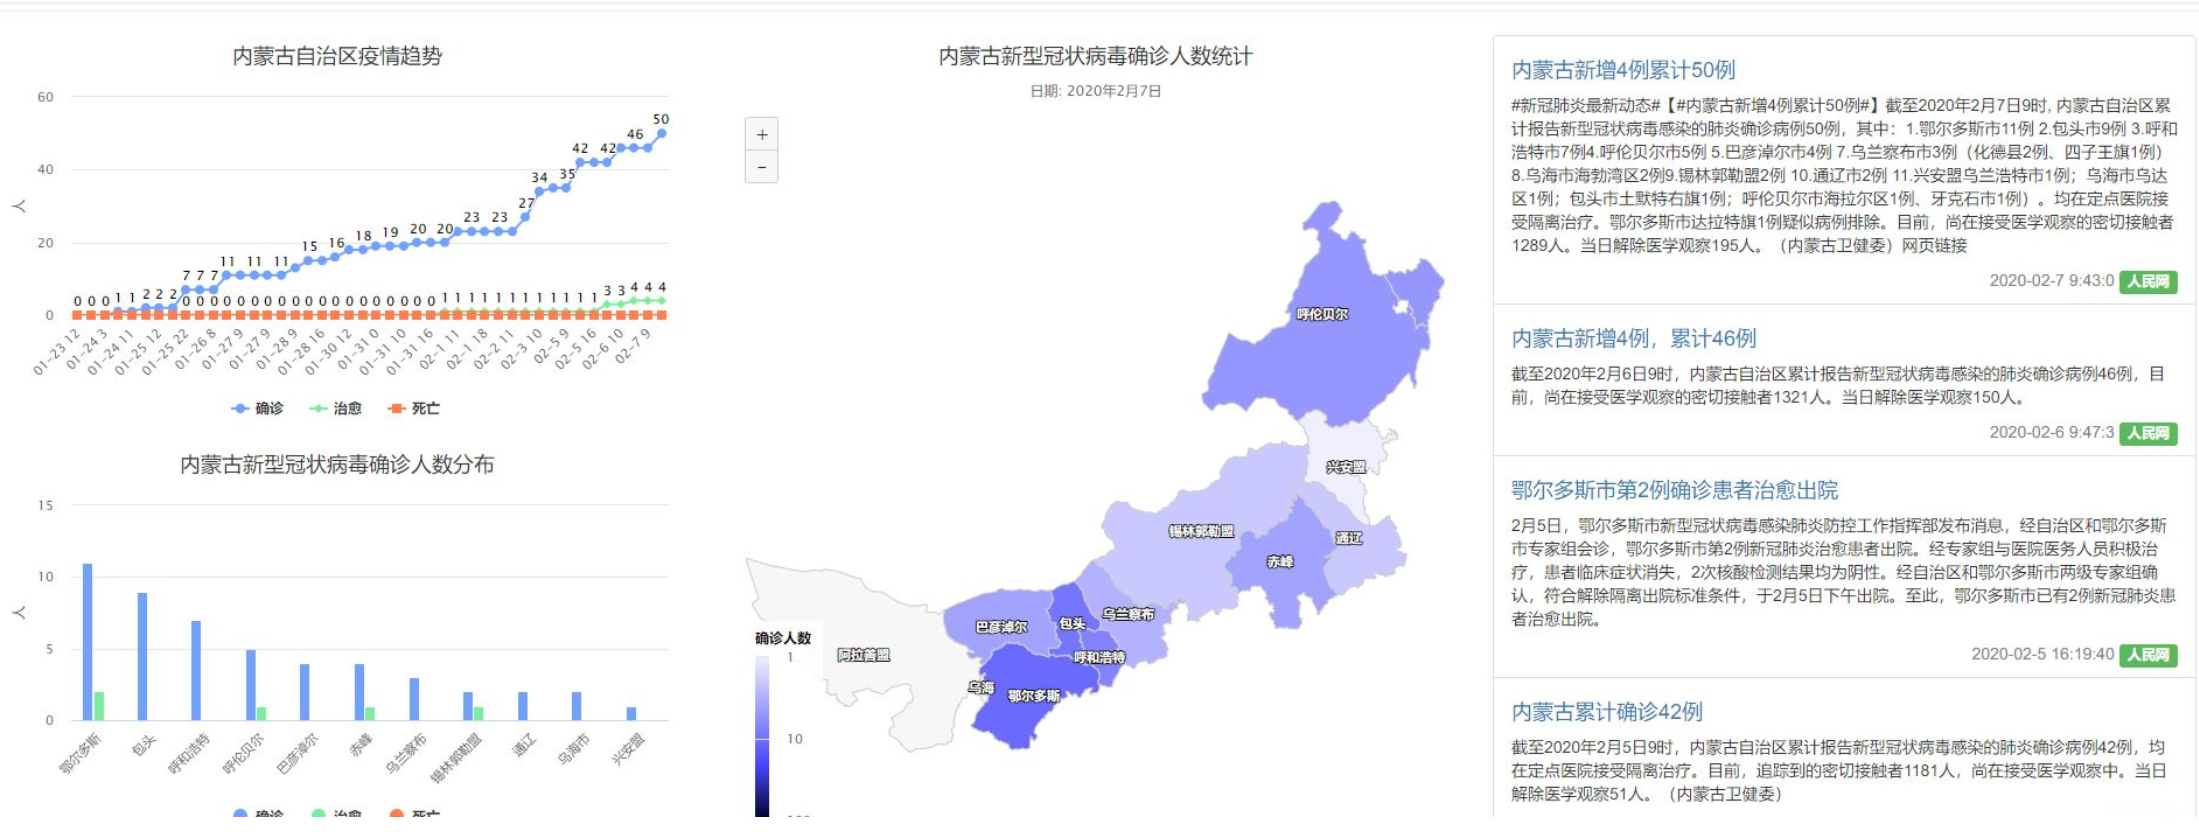
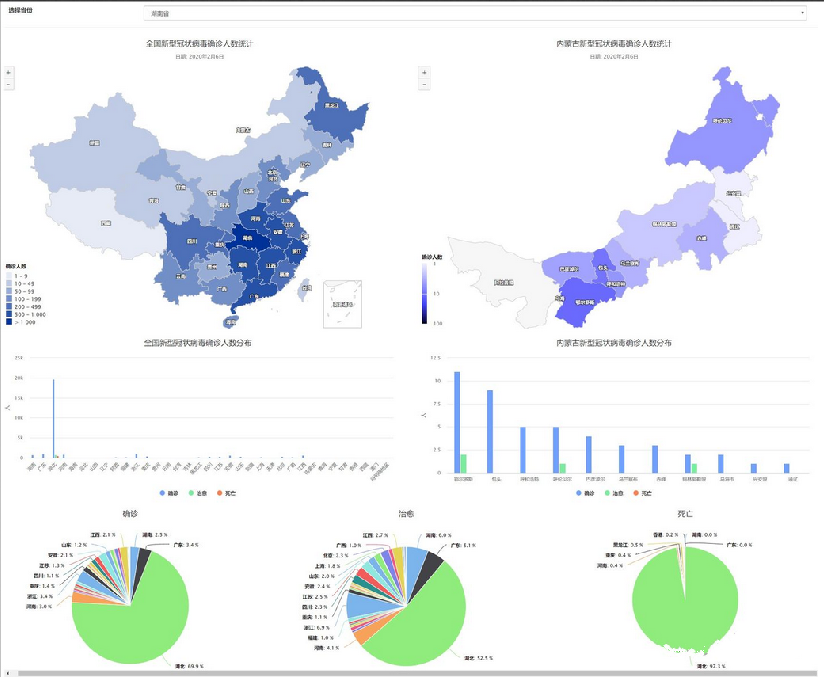
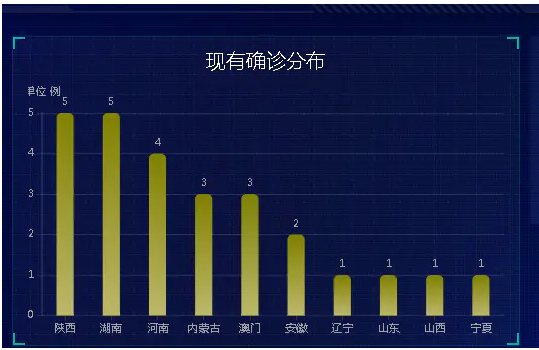
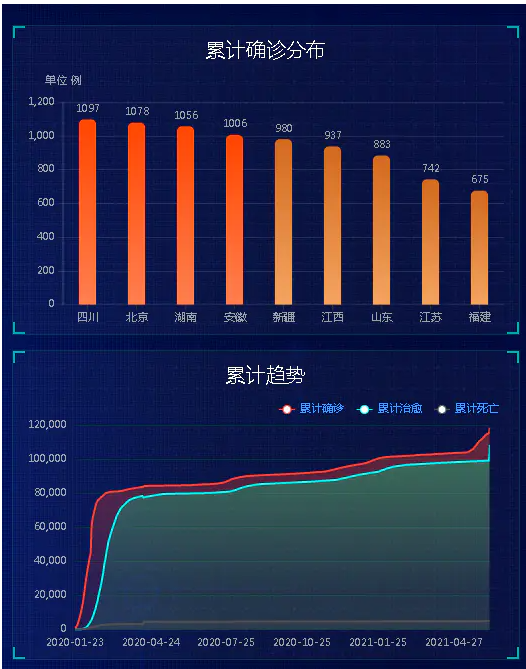
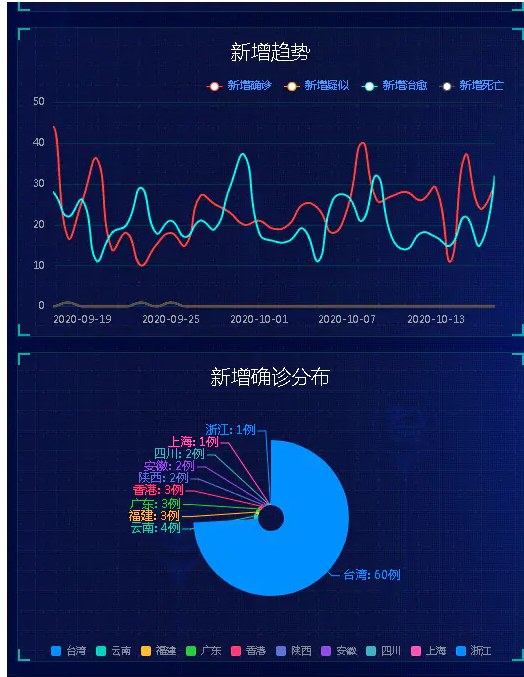
4.4 national epidemic situation real-time tracking
The national epidemic situation real-time tracking page supports the display of line chart, bar chart, sector chart and map thermal map. The chart is realized by Echarts and supports the jump of the side bar in the upper left corner.
4.6 other pages
Key code 5
Two data sheets
CREATE TABLE `history` (
  `ds` datetime NOT NULL COMMENT 'date',
  `confirm` int(11) DEFAULT NULL COMMENT 'Cumulative diagnosis',
  `confirm_add` int(11) DEFAULT NULL COMMENT 'Newly diagnosed on the same day',
  `suspect` int(11) DEFAULT NULL COMMENT 'Remaining suspected',
  `suspect_add` int(11) DEFAULT NULL COMMENT 'New suspected on the same day',
  `heal` int(11) DEFAULT NULL COMMENT 'Cumulative cure',
  `heal_add` int(11) DEFAULT NULL COMMENT 'New healing on the same day',
  `dead` int(11) DEFAULT NULL COMMENT 'Cumulative death',
  `dead_add` int(11) DEFAULT NULL COMMENT 'New deaths on the same day',
  PRIMARY KEY (`ds`) USING BTREE
) ENGINE=InnoDB DEFAULT CHARSET=utf8mb4;


CREATE TABLE `details` (
  `id` int(11) NOT NULL AUTO_INCREMENT,
  `update_time` datetime DEFAULT NULL COMMENT 'Last update time of data',
  `province` varchar(50) DEFAULT NULL COMMENT 'province',
  `city` varchar(50) DEFAULT NULL COMMENT 'city',
  `confirm` int(11) DEFAULT NULL COMMENT 'Cumulative diagnosis',
  `confirm_add` int(11) DEFAULT NULL COMMENT 'New cure',
  `heal` int(11) DEFAULT NULL COMMENT 'Cumulative cure',
  `dead` int(11) DEFAULT NULL COMMENT 'Cumulative death',
  PRIMARY KEY (`id`)
) ENGINE=InnoDB DEFAULT CHARSET=utf8mb4;


import requests
import json
import time
import pymysql

#Return historical data and detailed data of the current day
def get_tencent_data():
    url1 = "https://view.inews.qq.com/g2/getOnsInfo?name=disease_h5"
    url2 = "https://view.inews.qq.com/g2/getOnsInfo?name=disease_other"
    headers = {
        'user-agent':'Mozilla/5.0 (Windows NT 10.0; Win64; x64) AppleWebKit/537.36 (KHTML, like Gecko) Chrome/78.0.3904.70 Safari/537.36'
    }
    r1 = requests.get(url1, headers)
    r2 = requests.get(url2, headers)

    #json string to dictionary
    res1 = json.loads(r1.text)
    res2 = json.loads(r2.text)

    data_all1 = json.loads(res1["data"])
    data_all2 = json.loads(res2["data"])

    #historical data
    history = {}
    for i in data_all2["chinaDayList"]:
        ds = "2020." + i["date"]
        tup = time.strptime(ds, "%Y.%m.%d")  # Matching time
        ds = time.strftime("%Y-%m-%d", tup)  #Change the time input format, otherwise an error will be reported when inserting into the database. The database is in datatime format
        confirm = i["confirm"]
        suspect = i["suspect"]
        heal = i["heal"]
        dead = i["dead"]
        history[ds] = {"confirm": confirm, "suspect": suspect, "heal": heal, "dead": dead}
    for i in data_all2["chinaDayAddList"]:
        ds = "2020." + i["date"]
        tup = time.strptime(ds, "%Y.%m.%d")  # Matching time
        ds = time.strftime("%Y-%m-%d", tup)  #Change the time input format, otherwise an error will be reported when inserting into the database. The database is in datatime format
        confirm = i["confirm"]
        suspect = i["suspect"]
        heal = i["heal"]
        dead = i["dead"]
        history[ds].update({"confirm_add": confirm, "suspect_add": suspect, "heal_add": heal, "dead_add": dead})

    #Detailed data of the day
    details = []
    update_time = data_all1["lastUpdateTime"]
    data_country = data_all1["areaTree"]  #list 25 countries
    data_province = data_country[0]["children"] #Chinese provinces
    for pro_infos in data_province:
        province = pro_infos["name"] #Provincial name
        for city_infos in pro_infos["children"]:
            city = city_infos["name"]
            confirm = city_infos["total"]["confirm"]
            confirm_add = city_infos["today"]["confirm"]
            heal = city_infos["total"]["heal"]
            dead = city_infos["total"]["dead"]
            details.append([update_time, province, city, confirm, confirm_add, heal, dead])
    return history, details


def get_conn():
	#Establish connection
	conn = pymysql.connect(host="127.0.0.1", user="root", password="*", db="cov", charset="utf8")
	#Create cursor
	cursor = conn.cursor()
	return conn,cursor

def close_conn(conn,cursor):
	if cursor:
		cursor.close()
	if conn:
		conn.close()

#Insert details data
def update_details():
	cursor = None
	conn = None
	try:
		li = get_tencent_data()[1] #0 is the historical data and 1 is the detailed data of the current day
		conn,cursor = get_conn()
		sql = "insert into details(update_time,province,city,confirm,confirm_add,heal,dead) values(%s,%s,%s,%s,%s,%s,%s)"
		sql_query = "select %s=(select update_time from details order by id desc limit 1)"  #Compare the current maximum timestamp
		#Compare the current maximum timestamp
		cursor.execute(sql_query,li[0][0])
		if not cursor.fetchone()[0]:
			print(f"{time.asctime()}Start updating data")
			for item in li:
				cursor.execute(sql,item)
			conn.commit()
			print(f"{time.asctime()}Update to latest data")
		else:
			print(f"{time.asctime()}Is the latest data!")
	except:
		traceback.print_exc()
	finally:
		close_conn(conn,cursor)


#Insert history data
def insert_history():
    cursor = None
    conn = None
    try:
        dic = get_tencent_data()[0]#0 represents historical data dictionary
        print(f"{time.asctime()}Start inserting historical data")
        conn,cursor = get_conn()
        sql = "insert into history values (%s,%s,%s,%s,%s,%s,%s,%s,%s)"
        for k,v in dic.items():
            cursor.execute(sql,[k, v.get("confirm"),v.get("confirm_add"),v.get("suspect"),
                           v.get("suspect_add"),v.get("heal"),v.get("heal_add"),
                           v.get("dead"),v.get("dead_add")])
        conn.commit()
        print(f"{time.asctime()}Insert history data completed")
    except:
        traceback.print_exc()
    finally:
        close_conn(conn,cursor)


#Update historical data
def update_history():
    cursor = None
    conn = None
    try:
        dic = get_tencent_data()[0]#0 represents historical data dictionary
        print(f"{time.asctime()}Start updating historical data")
        conn,cursor = get_conn()
        sql = "insert into history values (%s,%s,%s,%s,%s,%s,%s,%s,%s)"
        sql_query = "select confirm from history where ds=%s"
        for k,v in dic.items():
            if not cursor.execute(sql_query,k):
                cursor.execute(sql,[k, v.get("confirm"),v.get("confirm_add"),v.get("suspect"),
                               v.get("suspect_add"),v.get("heal"),v.get("heal_add"),
                               v.get("dead"),v.get("dead_add")])
        conn.commit()
        print(f"{time.asctime()}Historical data update completed")
    except:
        traceback.print_exc()
    finally:
        close_conn(conn,cursor)


insert_history()
update_details()