Author: Ren Kun
Now living in Zhuhai, he has successively served as a full-time Oracle and MySQL DBA. Now he is mainly responsible for the maintenance of MySQL, mongoDB and Redis.
Source: original contribution
*It is produced by aikesheng open source community. The original content cannot be used without authorization. For reprint, please contact Xiaobian and indicate the source.
1. Background
A disk space alarm was received during office hours

Log in to the machine and check that the root partition is less than 16G, which has been used by more than 80% at the moment.
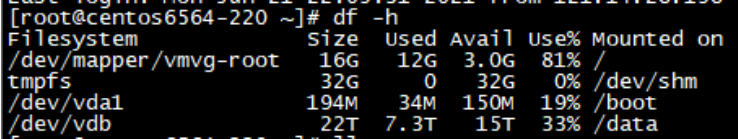
View the 10 largest files under the root partition and arrange them in descending order of size
du ‐Sm / ‐‐exclude="/data" | sort ‐k1nr | head ‐10
This command returns after a few seconds in other environments. It has been executed on this machine for nearly 1 minute. Finally, locate several log files and delete them directly.
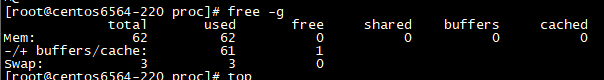
Just about to log out, I received another memory alarm. It's still this machine.

2. Diagnose
Check the memory usage. It has indeed been exhausted
top view the most memory consuming processes
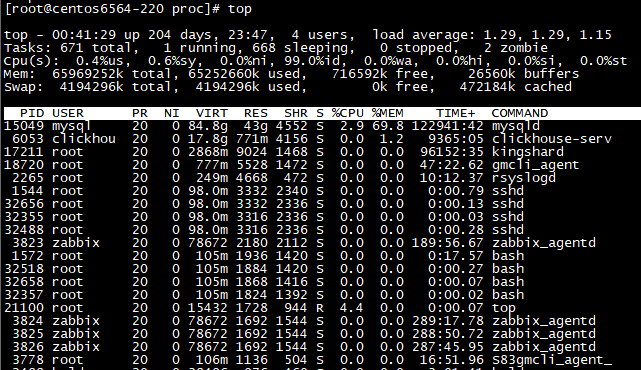
mysqld consumes only 43G for every additional memory. Even with the other processes in the screenshot, it can occupy 44G at most.
To avoid missing calculations, count the total physical memory occupied by all processes:
[root@centos6564‐220 ~]# more RSS.sh
#/bin/bash
for PROC in `ls /proc/|grep "^[0‐9]"`
do
if [ ‐f /proc/$PROC/statm ]; then
TEP=`cat /proc/$PROC/statm | awk '{print ($2)}'`
RSS=`expr $RSS + $TEP`
fi
done
RSS=`expr $RSS \* 4 / 1024 / 1024`
echo $RSS"GB"

[root@centos6564‐220 ~]# sh RSS.sh
44GB
Note: the script comes from an article written by Chu Ba many years ago http://blog.yufeng.info/archives/2456
The question is, who occupied the remaining 10 gigabytes of memory?
Neither top nor ps can give an answer. You can only view the / proc/meminfo file
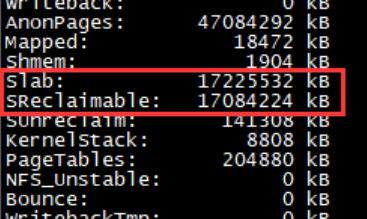
Note the information in the red box. The slab consumes too much cache and is recyclable. It's just about 16G in size.
Thinking of the extremely slow du -Sm command just executed, the answer seems obvious.
Execute slabtop
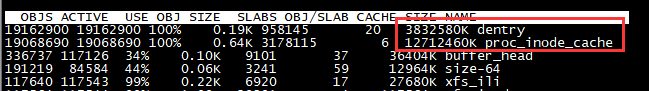
dentry and inode occupy a lot of memory, but the output results are not intuitive enough.
View slab cache components over 100M
[root@centos6564‐220 ~]# cat /proc/slabinfo |awk '{if($3*$4/1024/1024 > 1
00){print $1,$3*$4/1024/1024 "MB"} }'
xfs_inode 113.586MB
proc_inode_cache 11989.1MB
dentry 3526.19MB
inode occupies nearly 12G, dentry occupies 3.5G, and everything is right.
Since the memory shortage is caused by the slab cache, you can directly use echo 2 > / proc / sys / VM / drop_ The caches command recycles.
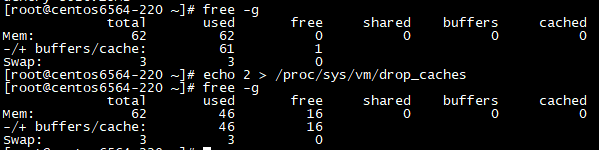
So far, the problem of insufficient memory has been solved.
3. Sourcing
The new question arises, which directory consumes a large amount of inode/dentry?
Execute the following command to count the total number of files and subdirectories in each directory under the root directory.
for i in `ls / `; do
 count=`ls ‐lR /$i | wc ‐l`
 echo "$i has $count files and dirs"
done
...
proc has 32940780 files and dirs
root has 462 files and dirs
sbin has 287 files and dirs
tmp has 2 files and dirs
....
/Proc is the culprit. Continue to explore the subdirectories under / proc. This statistical refinement is divided into files and subdirectories
for i in `ls /proc `; do
 files=`ls ‐lR /proc/$i | grep "^‐" | wc ‐l`
 dirs=`ls ‐lR /proc/$i | grep "^d" | wc ‐l`
 echo "$i has $files files and $dirs dirs" >> /tmp/count_tmps
done
7
#15049 process occupies 1600w files
[root@centos6564‐220 tmp]# more count_tmps | sort ‐k3nr | head ‐5
15049 has 16381888 files and 964 dirs
 17211 has 7653 files and 349 dirs
 6053 has 7511 files and 384 dirs
 18720 has 2289 files and 269 dirs
 sys has 1166 files and 119 dirs

 [root@centos6564‐220 tmp]# ps ‐ef | grep 15049
 mysql 15049 13839 41 Jan07 ? 85‐09:04:44 /usr/sbin/mysqld ‐‐basedir=/usr
‐‐datadir=/data/var ‐‐plugin‐dir=/usr/lib64/mysql/plugin ‐‐user=mysql ‐‐
log‐error=/data/var/err.log ‐‐pid‐file=/data/var/mysql.pid ‐‐socket=/data/v
ar/mysql.sock ‐‐port=3306
 root 24912 25232 0 01:10 pts/3 00:00:00 grep 15049
What an embarrassment. It's still a mysql problem after checking for a long time.
Statistics of subdirectory information under / proc/15049
dest=/proc/15049
for i in `ls $dest `; do
 files=`ls ‐lR $dest/$i | grep "^‐" | wc ‐l`
 dirs=`ls ‐lR $dest/$i | grep "^d" | wc ‐l`
 echo "$i has $files files and $dirs dirs" >> /tmp/15049
done

[root@centos6564‐220 task]# cat /tmp/15049 | sort ‐k3nr | head ‐5
task has 20428788 files and 955 dirs
 fdinfo has 106921 files and 0 dirs
 net has 60 files and 3 dirs
 attr has 6 files and 0 dirs
 autogroup has 1 files and 0 dirs
/The proc/15432/task directory records the information of each child thread derived from mysqld.
View the current number of child threads of mysqld
[root@centos6564‐220 task]# cat /proc/15049/status | grep ‐i threads
Threads: 191
Continue to view the details of each child thread
dest=/proc/15049/task
 for i in `ls $dest `; do
 files=`ls ‐lR $dest/$i | grep "^‐" | wc ‐l`
 dirs=`ls ‐lR $dest/$i | grep "^d" | wc ‐l`
 echo "$i has $files files and $dirs dirs" >> /tmp/15049_task
done

[root@centos6564‐220 tmp]# more 15049_task | sort ‐k3nr | head ‐5
15049 has 106957 files and 4 dirs
 15058 has 106957 files and 4 dirs
 15117 has 106957 files and 4 dirs
 15118 has 106957 files and 4 dirs
 15119 has 106957 files and 4 dirs
The number of files opened by each child thread is the same. Enter the fd directory of any child thread,
[root@centos6564‐220 fd]# pwd
/proc/15432/task/15120/fd
[root@centos6564‐220 fd]# ls | wc ‐l
85286

#Each fd is a mysql file. The naming format is partition table
[root@centos6564‐220 fd]# ll 39326
lrwx‐‐‐‐‐‐ 1 root root 64 Jul 31 01:34 39326 ‐> /data/tokudb/_*_sql_204d_
542_P_p20161105_188_status_3f14ef598_1_1d.tokudb
4. Conclusion
Log in to the database to view information_schema.partitions, more than 100 partition tables are found, with 1000 partitions for each table.
This set of examples was handed over to us by other departments halfway. The biggest feature of this group of students using mysql is that they like to create partition tables.
In addition, free -g in the whole diagnosis process shows that the free physical memory is 0, but mysqld does not cause OOM. This is because the additional 16G memory consumed is of recyclable type and can be reused by other memory requests