Flask
Flask is a lightweight WSGI Web application framework. It is designed to make it easy to get started and has the ability to scale to complex applications. It was originally a simple wrapper around Werkzeug and Jinja and has become one of the most popular Python Web application frameworks.
from flask import Flask

app = Flask(__name__)

@app.route('/')
def hello_world():
    return 'Hello World!'

if __name__ == '__main__':
    app.run()
This is the smallest application of the flash framework. After running with python, visit localhost:5000 to see the webpage displaying Hello world.
Here, the flask class is introduced first, and then an instance is created for this class. Name represents the name of this module. Because this module is run directly, the value of name at this time is main. Then a route is defined with the route() modifier, which tells flag how to access the function. Finally, the run() function is used to run the application on the server.
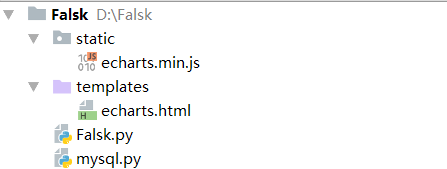
1, Directory structure
2, Connect to mysql.py
import pymysql
class Mysql(object):
    def __init__(self):
        try:
            self.conn = pymysql.connect(host='localhost',user='root',password='123456',database='meishi',charset="utf8")
            self.cursor = self.conn.cursor()  # Method used to get python to execute Mysql command (cursor operation)
            print("Successfully connected to database")
        except:
            print("connection failed")

    def getItems(self):
        sql= "select *from food"    #Get the contents of the food data table
        self.cursor.execute(sql)
        items = self.cursor.fetchall()  #Receive all return result lines
        return items
3, Flask.py
from flask import Flask
from flask import render_template
from mysql import Mysql

app = Flask(__name__)

@app.route('/')
def hello_world():
    return 'Hello World!'
@app.route('/echarts')
def getdata():
    db = Mysql()
    items=db.getItems()
    return render_template('echarts.html',items=items)

if __name__ == '__main__':
    app.run(debug=True)	#debug=True When an error occurs, it returns the place where the error occurred
- Render template(): the "render template()" method was called to render the template. The first parameter "echarts.html" of the method points to the name of the template you want to render, and the second parameter "items" is the variable you want to pass to the template, which can be passed to multiple variables.
4, echarts.html
<!DOCTYPE html>
<html lang="en">
<head>
    <meta charset="UTF-8">
    <title>Title</title>
    <script src="/static/echarts.min.js"></script>
    <style>
        #main{
            width: 600px;
            height: 400px;
        }
    </style>
</head>
<body>
<div id="main"></div>
    <script type="text/javascript">
            // Based on the prepared dom, initialize the echarts instance and draw the chart.
            var myChart=echarts.init(document.getElementById('main'));
            // Specify configuration items and data for the chart
            var option = {
                title: {
                    text: 'Ingredients and quantity'
                },
                dataZoom: [{
                          type: 'slider',
                          show: true, //Flash hides graphics directly
                          xAxisIndex: [0],
                          left: '9%', //% left of scroll bar
                          bottom: -5,
                          start: 10,//Start position of scroll bar
                          end: 20 //End position of scroll bar (divide your histogram x-axis length in proportion)
                      }],
                xAxis: {
                    name:"Ingredients",
                    type: 'category',
                    data:[
                    		{% for item in items %}
                            	"{{ item[0]}}",
                        	{% endfor %}
                       ]},
                yAxis: {
                    name:"Number",
                    type: 'value',
                    axisLabel : {
                    formatter: '{value} species'}
                },
                series: [
                        {
                            type: 'line',	//Line line line line chart. bar cylindrical graph
                            data:[{% for item in items %}
                            		"{{ item[1]}}",
                        			{% endfor %}],
                            itemStyle:{normal: {color:"#31b0d5"}}
                        }
                    ]
                };
            myChart.setOption(option);// Based on the prepared dom, initialize the echarts instance and draw the chart.
     </script>
</body>
</html>
Instance of Jinja2 template (loading database data to html)
 data:[
       {% for item in items %}
           "{{ item[0]}}",	# item[0]Here is the first column of data in the loading data table, item[1]The first column.
       {% endfor %}
 ]},
5, Run project Flask.py
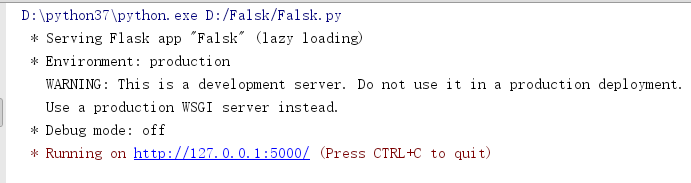
Enter http://127.0.0.1:5000/eckarts in the browser to see:
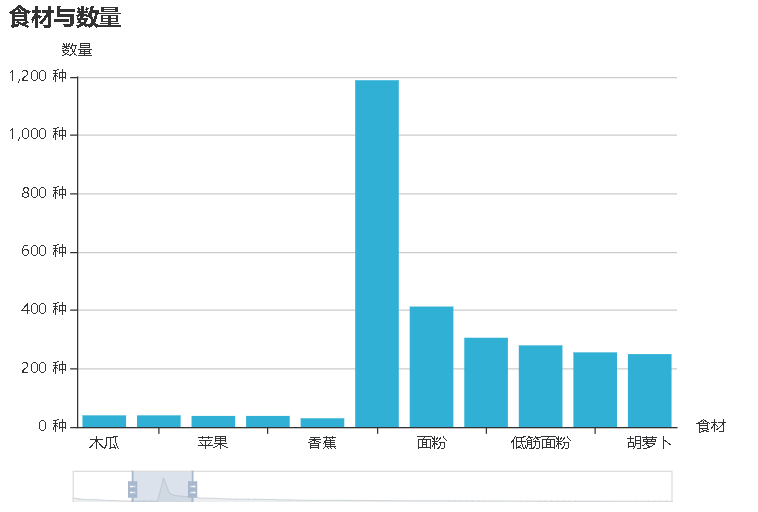
(line line line line is set in series type of echarts.html)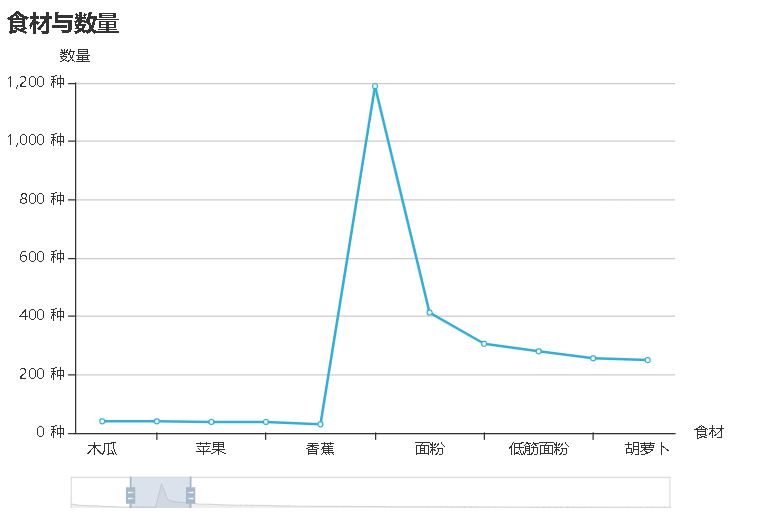
(bar histogram is set in series type of echarts.html)