
Author |
CHEYANG Fluid community committer
Xie Yuandong Fluid community committer
Source| Alibaba cloud official account
**Introduction: * * elastic scaling is one of the core capabilities of Kubernetes, but it has always been carried out around this stateless application load. Fluid provides the elastic scalability of distributed cache, which can flexibly expand and shrink data cache. It provides performance indicators such as cache space and existing cache proportion based on Runtime, and provides data cache scalability on demand in combination with its capacity to expand and shrink Runtime resources.
background
As more and more data intensive applications such as big data and AI begin to be deployed and run in Kubernetes environment, the differences between the design concept of data intensive application computing framework and the original flexible application layout of cloud lead to data access and computing bottlenecks. Cloud native data orchestration engine Fluid provides the ability to accelerate data access for applications through the abstraction of data sets, the use of distributed cache technology and the combination of scheduler.
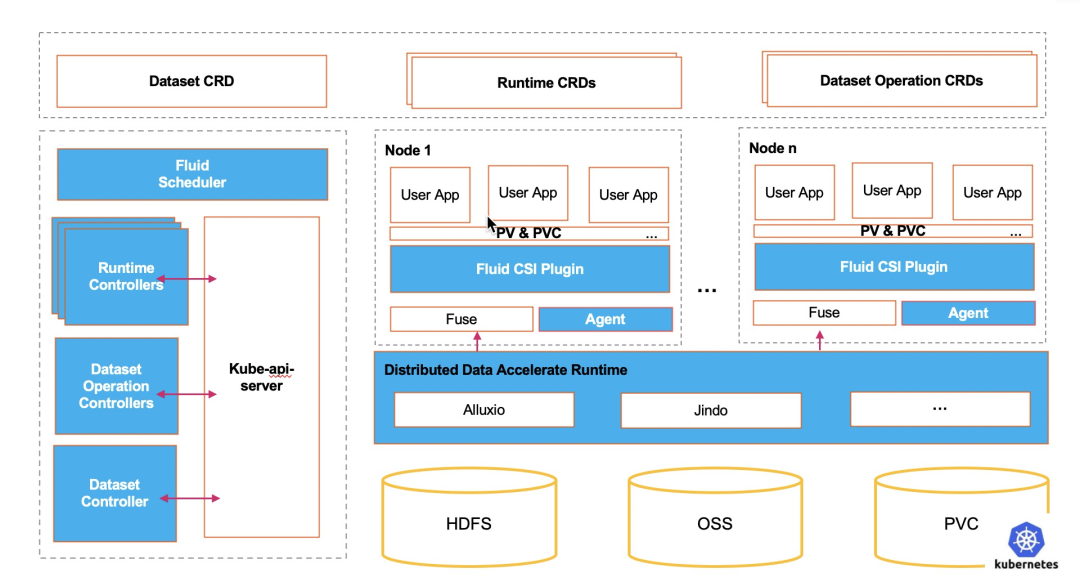
Elastic scaling is one of the core capabilities of Kubernetes, but it has always been carried out around this stateless application load. Fluid provides the elastic scalability of distributed cache, which can flexibly expand and shrink data cache. It provides performance indicators such as cache space and existing cache proportion based on Runtime, and provides data cache scalability on demand in combination with its capacity to expand and shrink Runtime resources.
This capability is very important for big data applications in the Internet scenario, because most big data applications are realized through end-to-end pipeline. This pipeline includes the following steps:
- Data extraction: use Spark, MapReduce and other big data technologies to preprocess the original data.
- Model training: use the feature data generated in the first stage to train the machine learning model, and generate the corresponding model.
- Model evaluation: evaluate and test the model generated in the second stage through the test set or verification set.
- The third stage is to provide the final reasoning service for the online reasoning model.

It can be seen that the end-to-end pipeline will contain many different types of computing tasks. For each computing task, there will be an appropriate professional system to deal with in practice (TensorFlow, PyTorch, Spark, Presto); However, these systems are independent of each other, and usually transfer data from one stage to the next with the help of external file system. However, the frequent use of file system to realize data exchange will bring a lot of I/O overhead and often become the bottleneck of the whole workflow.
Fluid is very suitable for this scenario. Users can create a Dataset object, which has the ability to disperse and cache data into the Kubernetes computing node as the medium of data exchange. In this way, remote writing and reading of data are avoided and the efficiency of data use is improved. However, the problem here is the resource estimation and reservation of temporary data cache. Before data production and consumption, accurate data volume estimation is difficult to meet. Too high estimation will lead to waste of resource reservation, and too low estimation will increase the possibility of data write failure. Or expand and shrink the capacity on demand, which is more user-friendly. We hope to achieve an effect similar to page cache. For end users, this layer is transparent, but the cache acceleration effect it brings is real.
By customizing the HPA mechanism, we introduce cache elasticity and scalability through Fluid. The condition of elastic scaling is that when the amount of cached data reaches a certain proportion, elastic expansion will be triggered to expand the cache space. For example, set the trigger condition as that the proportion of cache space exceeds 75%. At this time, the total cache space is 10G. When the data has occupied 8G cache space, the capacity expansion mechanism will be triggered.
Let's use an example to help you experience the automatic capacity expansion and contraction capability of Fluid.
prerequisite
It is recommended to use Kubernetes 1.18 or above, because HPA cannot customize the expansion and contraction strategy before 1.18, which is realized through hard coding. After 1.18, you can customize the expansion and contraction strategy, for example, you can define the cooling time after one expansion.
Specific steps
1. Install jq tools to facilitate json parsing.
In this example, the operating system we use is centos. You can install jq through yum.
yum install -y jq
2. Download and install the latest version of Fluid.
git clone https://github.com/fluid-cloudnative/fluid.git
cd fluid/charts
kubectl create ns fluid-system
helm install fluid fluid
3. Deploy or configure Prometheus.
Here, the Metrics exposed by the cache engine of AlluxioRuntime are collected by prometheus. If there is no prometheus in the cluster:
$ cd fluid
$ kubectl apply -f integration/prometheus/prometheus.yaml
If there is prometheus in the cluster, you can write the following configuration to the prometheus configuration file:
scrape_configs:
  - job_name: 'alluxio runtime'
    metrics_path: /metrics/prometheus
    kubernetes_sd_configs:
      - role: endpoints
    relabel_configs:
    - source_labels: [__meta_kubernetes_service_label_monitor]
      regex: alluxio_runtime_metrics
      action: keep
    - source_labels: [__meta_kubernetes_endpoint_port_name]
      regex: web
      action: keep
    - source_labels: [__meta_kubernetes_namespace]
      target_label: namespace
      replacement: $1
      action: replace
    - source_labels: [__meta_kubernetes_service_label_release]
      target_label: fluid_runtime
      replacement: $1
      action: replace
    - source_labels: [__meta_kubernetes_endpoint_address_target_name]
      target_label: pod
      replacement: $1
      action: replace
4. Verify that Prometheus is installed successfully.
$ kubectl get ep -n kube-system  prometheus-svc
NAME             ENDPOINTS        AGE
prometheus-svc   10.76.0.2:9090   6m49s
$ kubectl get svc -n kube-system prometheus-svc
NAME             TYPE       CLUSTER-IP      EXTERNAL-IP   PORT(S)          AGE
prometheus-svc   NodePort   172.16.135.24   <none>        9090:32114/TCP   2m7s
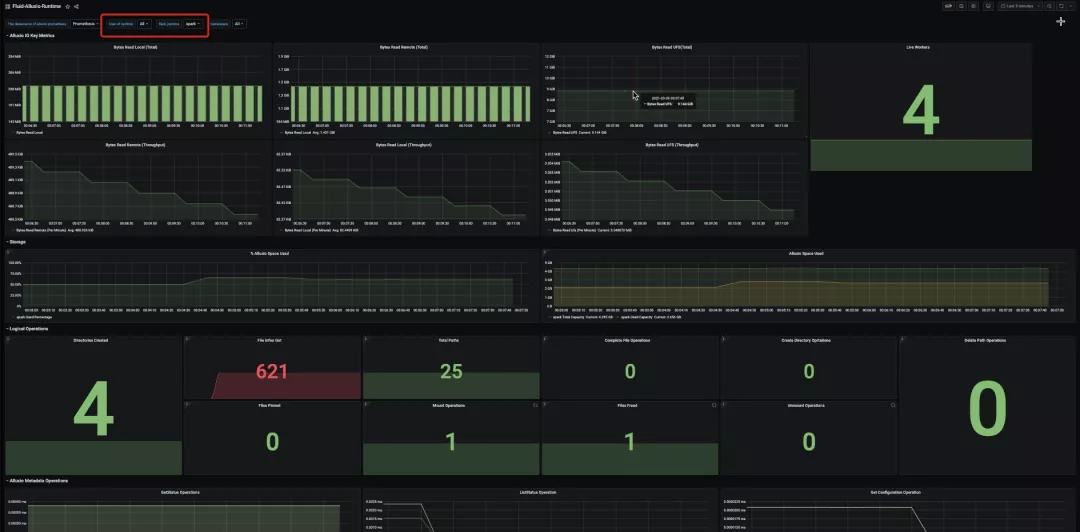
If you want to visualize the monitoring indicators, you can install Grafana to verify the monitoring data. The specific operations can be Reference documents.
5. Deploy metrics server.
Check whether the cluster includes metrics server. If the kubectl top node has correct output and can display memory and CPU, the cluster's metrics server is configured correctly.
kubectl top node
NAME                       CPU(cores)   CPU%   MEMORY(bytes)   MEMORY%
192.168.1.204   93m          2%     1455Mi          10%
192.168.1.205   125m         3%     1925Mi          13%
192.168.1.206   96m          2%     1689Mi          11%
Otherwise, execute the following commands manually:
kubectl create -f integration/metrics-server
6. Deploy the custom metrics API component.
To extend based on custom metrics, you need to have two components:
- The first component is to collect metrics from the application and store them in the Prometheus time series database.
- The second component uses the collected metrics to extend the Kubernetes custom metrics API, k8s Prometheus adapter.
The first component is deployed in the third step. Next, deploy the second component.
If the custom metrics API has been configured, add the configuration related to dataset in the configmap configuration of adapter:
apiVersion: v1
kind: ConfigMap
metadata:
  name: adapter-config
  namespace: monitoring
data:
  config.yaml: |
    rules:
    - seriesQuery: '{__name__=~"Cluster_(CapacityTotal|CapacityUsed)",fluid_runtime!="",instance!="",job="alluxio runtime",namespace!="",pod!=""}'
      seriesFilters:
      - is: ^Cluster_(CapacityTotal|CapacityUsed)$
      resources:
        overrides:
          namespace:
            resource: namespace
          pod:
            resource: pods
          fluid_runtime:
            resource: datasets
      name:
        matches: "^(.*)"
        as: "capacity_used_rate"
      metricsQuery: ceil(Cluster_CapacityUsed{<<.LabelMatchers>>}*100/(Cluster_CapacityTotal{<<.LabelMatchers>>}))
Otherwise, execute the following commands manually:
kubectl create -f integration/custom-metrics-api/namespace.yaml
kubectl create -f integration/custom-metrics-api
Note: since the custom metrics API connects the access address of the Prometheus in the cluster, please replace the Prometheus URL with the Prometheus address you really use.
Check custom indicators:
$ kubectl get --raw "/apis/custom.metrics.k8s.io/v1beta1" | jq
{
  "kind": "APIResourceList",
  "apiVersion": "v1",
  "groupVersion": "custom.metrics.k8s.io/v1beta1",
  "resources": [
    {
      "name": "pods/capacity_used_rate",
      "singularName": "",
      "namespaced": true,
      "kind": "MetricValueList",
      "verbs": [
        "get"
      ]
    },
    {
      "name": "datasets.data.fluid.io/capacity_used_rate",
      "singularName": "",
      "namespaced": true,
      "kind": "MetricValueList",
      "verbs": [
        "get"
      ]
    },
    {
      "name": "namespaces/capacity_used_rate",
      "singularName": "",
      "namespaced": false,
      "kind": "MetricValueList",
      "verbs": [
        "get"
      ]
    }
  ]
}
7. Submit the Dataset used for the test.
$ cat<<EOF >dataset.yaml
apiVersion: data.fluid.io/v1alpha1
kind: Dataset
metadata:
  name: spark
spec:
  mounts:
    - mountPoint: https://mirrors.bit.edu.cn/apache/spark/
      name: spark
---
apiVersion: data.fluid.io/v1alpha1
kind: AlluxioRuntime
metadata:
  name: spark
spec:
  replicas: 1
  tieredstore:
    levels:
      - mediumtype: MEM
        path: /dev/shm
        quota: 1Gi
        high: "0.99"
        low: "0.7"
  properties:
    alluxio.user.streaming.data.timeout: 300sec
EOF
$ kubectl create -f dataset.yaml
dataset.data.fluid.io/spark created
alluxioruntime.data.fluid.io/spark created
8. Check whether the Dataset is available.
It can be seen that the total amount of data in this dataset is 2.71GiB. At present, the number of cache nodes provided by Fluid is 1, and the maximum cache capacity that can be provided is 1GiB. At this time, the amount of data cannot meet the needs of full data cache.
$ kubectl get dataset
NAME    UFS TOTAL SIZE   CACHED   CACHE CAPACITY   CACHED PERCENTAGE   PHASE   AGE
spark   2.71GiB          0.00B    1.00GiB          0.0%                Bound   7m38s
9. When the Dataset is available, check whether the monitoring indicators can be obtained from the custom metrics API.
kubectl get --raw "/apis/custom.metrics.k8s.io/v1beta1/namespaces/default/datasets.data.fluid.io/*/capacity_used_rate" | jq
{
  "kind": "MetricValueList",
  "apiVersion": "custom.metrics.k8s.io/v1beta1",
  "metadata": {
    "selfLink": "/apis/custom.metrics.k8s.io/v1beta1/namespaces/default/datasets.data.fluid.io/%2A/capacity_used_rate"
  },
  "items": [
    {
      "describedObject": {
        "kind": "Dataset",
        "namespace": "default",
        "name": "spark",
        "apiVersion": "data.fluid.io/v1alpha1"
      },
      "metricName": "capacity_used_rate",
      "timestamp": "2021-04-04T07:24:52Z",
      "value": "0"
    }
  ]
}
10. Create HPA tasks.
$ cat<<EOF > hpa.yaml
apiVersion: autoscaling/v2beta2
kind: HorizontalPodAutoscaler
metadata:
  name: spark
spec:
  scaleTargetRef:
    apiVersion: data.fluid.io/v1alpha1
    kind: AlluxioRuntime
    name: spark
  minReplicas: 1
  maxReplicas: 4
  metrics:
  - type: Object
    object:
      metric:
        name: capacity_used_rate
      describedObject:
        apiVersion: data.fluid.io/v1alpha1
        kind: Dataset
        name: spark
      target:
        type: Value
        value: "90"
  behavior:
    scaleUp:
      policies:
      - type: Pods
        value: 2
        periodSeconds: 600
    scaleDown:
      selectPolicy: Disabled
EOF
First, let's explain the sample configuration. There are two parts here: one is the rules of expansion and contraction, and the other is the sensitivity of expansion and contraction:
- Rule: the condition that triggers the capacity expansion behavior is that the amount of cached data of the Dataset object accounts for 90% of the total cache capacity; The expansion object is AlluxioRuntime. The minimum number of copies is 1 and the maximum number of copies is 4; The objects of Dataset and AlluxioRuntime need to be in the same namespace.
- Strategy: k8s version above 1.18 can be used, and the stabilization time and step ratio of one-time expansion and contraction can be set for expansion and contraction scenarios respectively. For example, in this example, a capacity expansion cycle is 10 minutes (periodSeconds), and two copies are added during capacity expansion. Of course, this can not exceed the limit of maxReplicas; After one expansion, the cooling time (stabilization window seconds) is 20 minutes; The volume reduction strategy can be closed directly.
11. Check the HPA configuration. The data proportion of the current cache space is 0. It is far lower than the condition for triggering capacity expansion.
$ kubectl get hpa
NAME    REFERENCE              TARGETS   MINPODS   MAXPODS   REPLICAS   AGE
spark   AlluxioRuntime/spark   0/90      1         4         1          33s
$ kubectl describe hpa
Name:                                                    spark
Namespace:                                               default
Labels:                                                  <none>
Annotations:                                             <none>
CreationTimestamp:                                       Wed, 07 Apr 2021 17:36:39 +0800
Reference:                                               AlluxioRuntime/spark
Metrics:                                                 ( current / target )
  "capacity_used_rate" on Dataset/spark (target value):  0 / 90
Min replicas:                                            1
Max replicas:                                            4
Behavior:
  Scale Up:
    Stabilization Window: 0 seconds
    Select Policy: Max
    Policies:
      - Type: Pods  Value: 2  Period: 600 seconds
  Scale Down:
    Select Policy: Disabled
    Policies:
      - Type: Percent  Value: 100  Period: 15 seconds
AlluxioRuntime pods:   1 current / 1 desired
Conditions:
  Type            Status  Reason               Message
  ----            ------  ------               -------
  AbleToScale     True    ScaleDownStabilized  recent recommendations were higher than current one, applying the highest recent recommendation
  ScalingActive   True    ValidMetricFound     the HPA was able to successfully calculate a replica count from Dataset metric capacity_used_rate
  ScalingLimited  False   DesiredWithinRange   the desired count is within the acceptable range
Events:           <none>
12. Create a data preheating task.
$ cat<<EOF > dataload.yaml
apiVersion: data.fluid.io/v1alpha1
kind: DataLoad
metadata:
  name: spark
spec:
  dataset:
    name: spark
    namespace: default
EOF
$ kubectl create -f dataload.yaml
$ kubectl get dataload
NAME    DATASET   PHASE       AGE   DURATION
spark   spark     Executing   15s   Unfinished
13. At this time, it can be found that the amount of cached data is close to the cache capacity (1GiB) that Fluid can provide, and the elastic scaling condition is triggered.
$  kubectl  get dataset
NAME    UFS TOTAL SIZE   CACHED       CACHE CAPACITY   CACHED PERCENTAGE   PHASE   AGE
spark   2.71GiB          1020.92MiB   1.00GiB          36.8%               Bound   5m15s
From the monitoring of HPA, it can be seen that the expansion of Alluxio Runtime has started. It can be found that the step size of expansion is 2.
$ kubectl get hpa
NAME    REFERENCE              TARGETS   MINPODS   MAXPODS   REPLICAS   AGE
spark   AlluxioRuntime/spark   100/90    1         4         2          4m20s
$ kubectl describe hpa
Name:                                                    spark
Namespace:                                               default
Labels:                                                  <none>
Annotations:                                             <none>
CreationTimestamp:                                       Wed, 07 Apr 2021 17:56:31 +0800
Reference:                                               AlluxioRuntime/spark
Metrics:                                                 ( current / target )
  "capacity_used_rate" on Dataset/spark (target value):  100 / 90
Min replicas:                                            1
Max replicas:                                            4
Behavior:
  Scale Up:
    Stabilization Window: 0 seconds
    Select Policy: Max
    Policies:
      - Type: Pods  Value: 2  Period: 600 seconds
  Scale Down:
    Select Policy: Disabled
    Policies:
      - Type: Percent  Value: 100  Period: 15 seconds
AlluxioRuntime pods:   2 current / 3 desired
Conditions:
  Type            Status  Reason              Message
  ----            ------  ------              -------
  AbleToScale     True    SucceededRescale    the HPA controller was able to update the target scale to 3
  ScalingActive   True    ValidMetricFound    the HPA was able to successfully calculate a replica count from Dataset metric capacity_used_rate
  ScalingLimited  False   DesiredWithinRange  the desired count is within the acceptable range
Events:
  Type     Reason                        Age                    From                       Message
  ----     ------                        ----                   ----                       -------
  Normal   SuccessfulRescale             21s                    horizontal-pod-autoscaler  New size: 2; reason: Dataset metric capacity_used_rate above target
  Normal   SuccessfulRescale             6s                     horizontal-pod-autoscaler  New size: 3; reason: Dataset metric capacity_used_rate above target
14. After waiting for a period of time, it is found that the cache space of the data set has increased from 1GiB to 3GiB, and the data cache is almost complete.
$ kubectl  get dataset
NAME    UFS TOTAL SIZE   CACHED    CACHE CAPACITY   CACHED PERCENTAGE   PHASE   AGE
spark   2.71GiB          2.59GiB   3.00GiB          95.6%               Bound   12m
At the same time, by observing the status of HPA, it can be found that the number of replicas of the runtime corresponding to the Dataset is 3, and the proportion of cache space used is capacity_ used_ When the rate is 85%, the cache expansion will not be triggered.
$ kubectl get hpa
NAME    REFERENCE              TARGETS   MINPODS   MAXPODS   REPLICAS   AGE
spark   AlluxioRuntime/spark   85/90     1         4         3          11m
15. Clean up the environment.
kubectl delete hpa spark
kubectl delete dataset spark
summary
Fluid provides the ability to trigger automatic elastic scaling according to the proportion of cache space occupied by combining the capabilities of Prometheous, Kubernetes HPA and Custom Metrics, so as to realize the on-demand use of cache capacity. This can help users use more flexibly and improve data access acceleration through distributed cache. In the future, we will provide the ability of regular expansion and contraction to provide more certainty for expansion and contraction.
Fluid's code warehouse: https://github.com/fluid-cloudnative/fluid.git , welcome to pay attention and contribute code and star.